5383
Frequency characteristics of resting-state fMRI functional networks1Roman Research Institute, Toronto, ON, Canada, 2Medical Biophysics, University of Toronto, Toronto, ON
Synopsis
This study examines the frequency dependence of functional connectivity patterns as measured using resting-state fMRI (rs-fMRI). We decompose the rs-fMRI signal into its intrinsic mode functions (IMFs) using the recently proposed variational mode decomposition (VMD) technique, which provides increased frequency precision and reduced modal mixing than previous methods. We show that many functional connectivity patterns can only be seen in a certain frequency range, contrasting previous findings. We concluded that the correlation patterns are frequency dependent and are more prominent and consistent in the lower frequency range.
Purpose
It has been suggested that resting-state networks (RSNs) measured using resting-state fMRI (rs-fMRI) are frequency independent1,2. Existing studies have been based on the decomposition of the rs-fMRI signal into its intrinsic mode functions (IMFs) through the use of empirical mode decomposition3 and complementary ensemble empirical mode decomposition2. Each IMF covers a specific frequency band, and the IMF-based representation is insensitive to non-stationarity and non-linearity in the original signal, well suited to rs-fMRI. However, existing results are affected by modal mixing and limited frequency precision, which may skew the physiological interpretation of results. In this study, we obtained the IMFs using variational mode decomposition (VMD)4, which has previously been established to result in minimal modal mixing and higher frequency precision. Based on this new method, we re-examine the frequency dependence of functional connectivity of RSNs.Methods
MRI Data Acquisition
Data was collected from six healthy adults (mean age 29 ± 5.8 years) on a 3T Siemens TIM Trio scanner and a 32-channel head coil. Whole-brain rs-fMRI data were acquired using single-shot gradient-echo EPI, 26 slices, TR = 2 s, FOV = 220x200mm2, voxel size = 3.4x3.4x4.6 mm3 in 240 frames.
Image Preprocessing
The rs-fMRI data were preprocessed using FSL FEAT version 5.0.86, with the first 10 volumes removed and skull stripped using the Brain Extraction Tool. Data were corrected for motion and slice time. A band-pass filtered (0.01 – 0.08 Hz) version of the signal was generated as is customary to functional connectivity calculations. For assessing frequency dependence, VMD was applied to the unfiltered data. Each IMF map was then transformed into MNI space.
Correlation Maps
We used the automated anatomical labeling (AAL)5 to divide the brain into 116 anatomical ROIs2 including the cortex and cerebellum. By examining the frequency distribution of all IMFs across all voxels and participants, 4 IMF groups were identified, namely IMF1: 0.01-0.045 Hz, IMF2: 0.045-0.11 Hz, IMF3: 0.12-0.18 Hz, IMF4: 0.19-0.24 Hz. For each IMF group, we averaged the IMFs within each ROI. We then generated matrices of Pearson correlation coefficients between pairs of ROIs, resulting in a set of four (116x116) correlation matrices for each subject. For reference, an additional correlation matrix was created for each subject using the 0.01-0.08 Hz band-pass filtered data.
Results
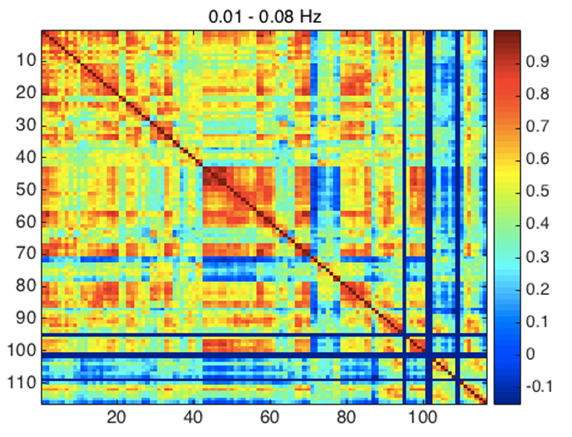
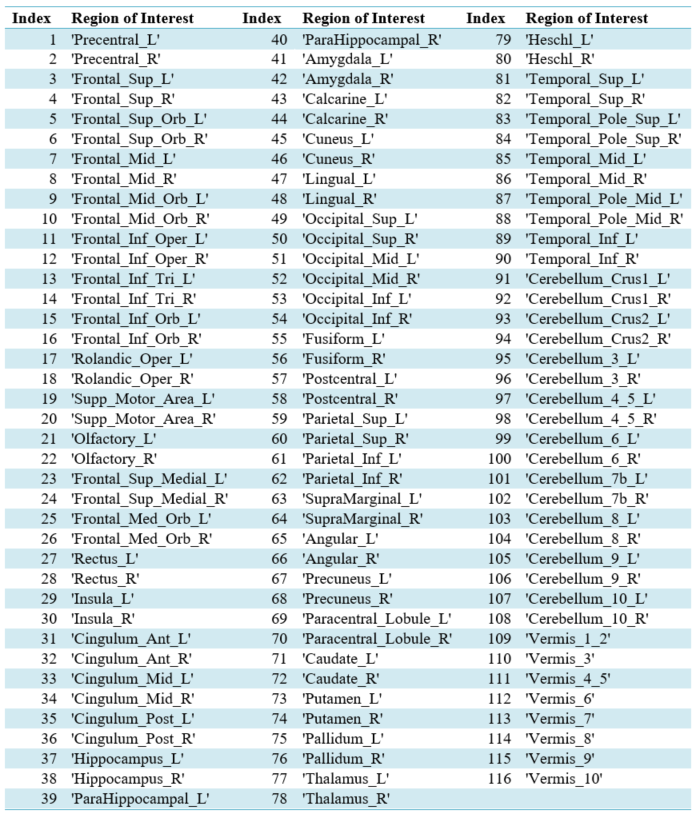
From Fig. 1, we can see that the highest correlations are found using IMFs 1 and 2, while no strong patterns are seen for IMF 3 and 4. Moreover, IMFs 1 and 2 were associated with correlation matrices that most resemble that of the conventionally band-pass filtered signal (Fig. 2), but not in IMF 3 and 4. A list of all regions defined and their indices can be found in Table 1.Discussion
Correlations in the band-pass filtered matrix (Fig. 2) show strong correlation patterns in areas that are part of the motor and control networks (indices 1-20), visual network (indices 43-60) and the medial-temporal network (indices 80-90). Most of these regions can be seen in IMFs 1 and to a lesser extent in IMF 2, but none in IMF 3 and 4. This contrasts previous findings that similar functional connectivity patterns were observed in all IMFs up to 0.22 Hz1,2. Also, the correlation pattern seen in conventional rs-fMRI analysis (in the 0.01-0.08 Hz range) was not found in the frequency range of 0.12-0.24 Hz (IMF 3 and 4) (Fig. 1).Conclusion
In this work, we found that the functional connectivity patterns of RSNs are dependent of frequency and that not all IMFs display the same patterns, contrary to previous reports1,2. The connectivity patterns found in IMF 1 and 2 (and in the 0.01-0.08 Hz band-passed signal) were not seen in the higher frequency range, which may indicate that the biological significance lies within the low frequency spectrum.Acknowledgements
No acknowledgement found.References
1. Niansky RK, Xie J, Miller K, et al. Spectral characteristics of resting-state networks. Prog Brain Res. 2011; 193(1): 256-76.
2. Qian L, Zhang Y, Zheng L, et al. Frequency Dependent Topological Patterns of Resting-State Brain Networks. PLoS One. 2015; 10(4): e0124681
3. Song X, Zhang Y, Liu Y. Frequency Specificity of Regional Homogeneity in the Resting-State Human Brain. PLoS One. 2014; 9(1): e86818.
4. Dragomiretskiy K, Zosso D. Variable Mode Decomposition. Signal Processing, IEEE Transactions. 2014; 62(3): 531-544.
5. Tzourio-Mazoyer N, Landeau B, Papathanassiou D, et al. Automated anatomical labeling of activations in SPM using a macroscopic anatomical parcellation of the MNI MRI single-subject brain. Neuroimage. 2002; 15(1):273-89.
6. Jenkinson M, Bannister P, Brady M, Smith S. Improved optimization for the robust and accurate linear registration and motion correction of brain images. NeuroImage. 2002; 17(2): 825-841.
Figures