5381
Reproducibility of graphical measures and dynamic network features in resting state fMRI1Graduate Program in Neuroscience, University of British Columbia, Vancouver, BC, Canada, 2Pacific Parkinson’s Research Centre, UBC Hospital, Vancouver, BC, Canada, 3Department of Biomedical Engineering Program, University of British Columbia, 4Department of Physics and Astronomy, University of British Columbia, 5Department of Radiology, UBC Hospital, 6Neurology, Faculty of Medicine, University of British Columbia
Synopsis
Resting state fMRI (rsfMRI) has been widely used to study brain function. Numerous informative features derived from rsfMRI data have been proposed, such as graphical metrics and dynamic connectivity, but their robustness is uncertain. In order to verify their reproducibility, we acquired rsfMRI three times for 11 subjects and calculated 7 graphical measures and 7 dynamic network features. None of the measures showed significant differences among the three rsfMRI sessions. Therefore, we concluded that graphical measures and dynamic network features in rsfMRI are at least robust to inter-trial variability, which should ameliorate uncertainties when applying them to clinical research.
Purpose
Resting state fMRI (rsfMRI) has been widely used to study human brain function in healthy subjects and patients with neurological and psychiatric conditions. Recent studies have applied graph theory and time-varying approaches to investigate brain organization and dynamic functional connectivity1,2. As there is a growing trend to include these measures in rsfMRI studies, reproducibility of such features needs to be addressed. Some studies have shown that several graphical measures demonstrate high reliability and reproducibility such as global efficiency, path length, and clustering coefficient among others3–5; however, no studies have measured the test-retest reliability of dynamic features in rsfMRI even though dynamic connectivity has already been proposed as a means to probe cognitive function. This is perhaps partly due to methodology issues and the fact that ways of reporting dynamic connectivity alterations remain diverse6.
The purpose of this study was to investigate whether graphical measures and dynamic network features of rsfMRI were reproducible across different scans in healthy subjects.
Methods
In this study, eleven healthy subjects (25.7±3.6 y/o, 4 females, 7 males) were recruited. Subjects with neurological or psychiatric conditions were excluded. Three resting state fMRI sessions were scanned continuously without a break on a Philips Achieva 3.0 Tesla MRI scanner with an echo-planar imaging sequence with the following parameters: 3×3×3 mm3 resolution, 36 slices, 2000 ms TR, 30 ms TE, 90 degrees flip angle, and 240 volumes/dynamics (8 minutes in total). 3D T1 weighted images were acquired with 1×1×1 mm3 resolution, 60 slices, 28 ms TR, 4 ms TE and 27 degrees flip angle.
Image preprocessing steps were performed in each subject’s native space with functions from SPM (UCL, London) and FSL (FMRIB, Oxford). Cortical parcellation was done in T1 weighted images using the open source Freesurfer program (MGH, Boston) and thirty-six cognition-associated regions-of-interest (ROIs) were extracted after structural and functional images were co-registered7. The ROIs acted as masks to determine the appropriate voxels making up the ROI timecourses. The average timecourses within one ROI (i.e. took timecourses from all the voxels in the ROI and averaged them) were extracted for further analyses and the data were linearly detrended in Matlab to remove a trend which was not related to neural events.
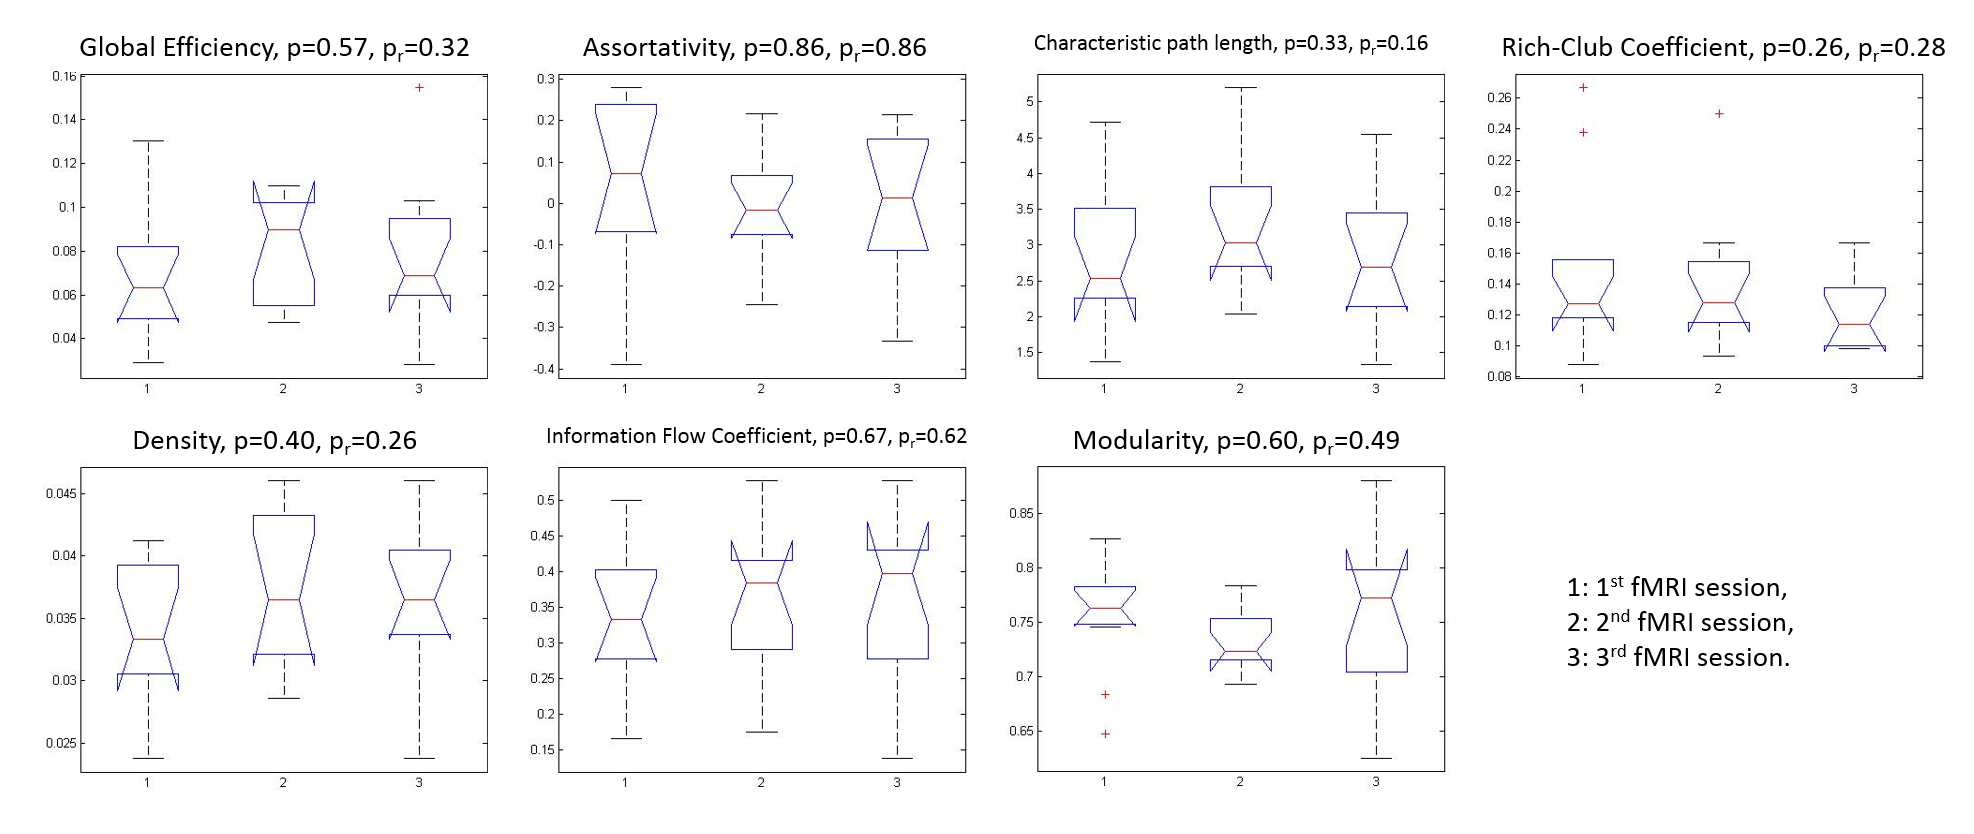
For graphical analysis, binary Pearson’s r correlation matrices were created to form the undirected/unweighted “edges” and the 36 ROIs acted as the “nodes”. The Brain Connectivity Toolbox (https://sites.google.com/site/bctnet/) was used to calculate graphical measures including global efficiency, assortativity, characteristic path length, density, information flow coefficient, modularity, and rich-club coefficient.
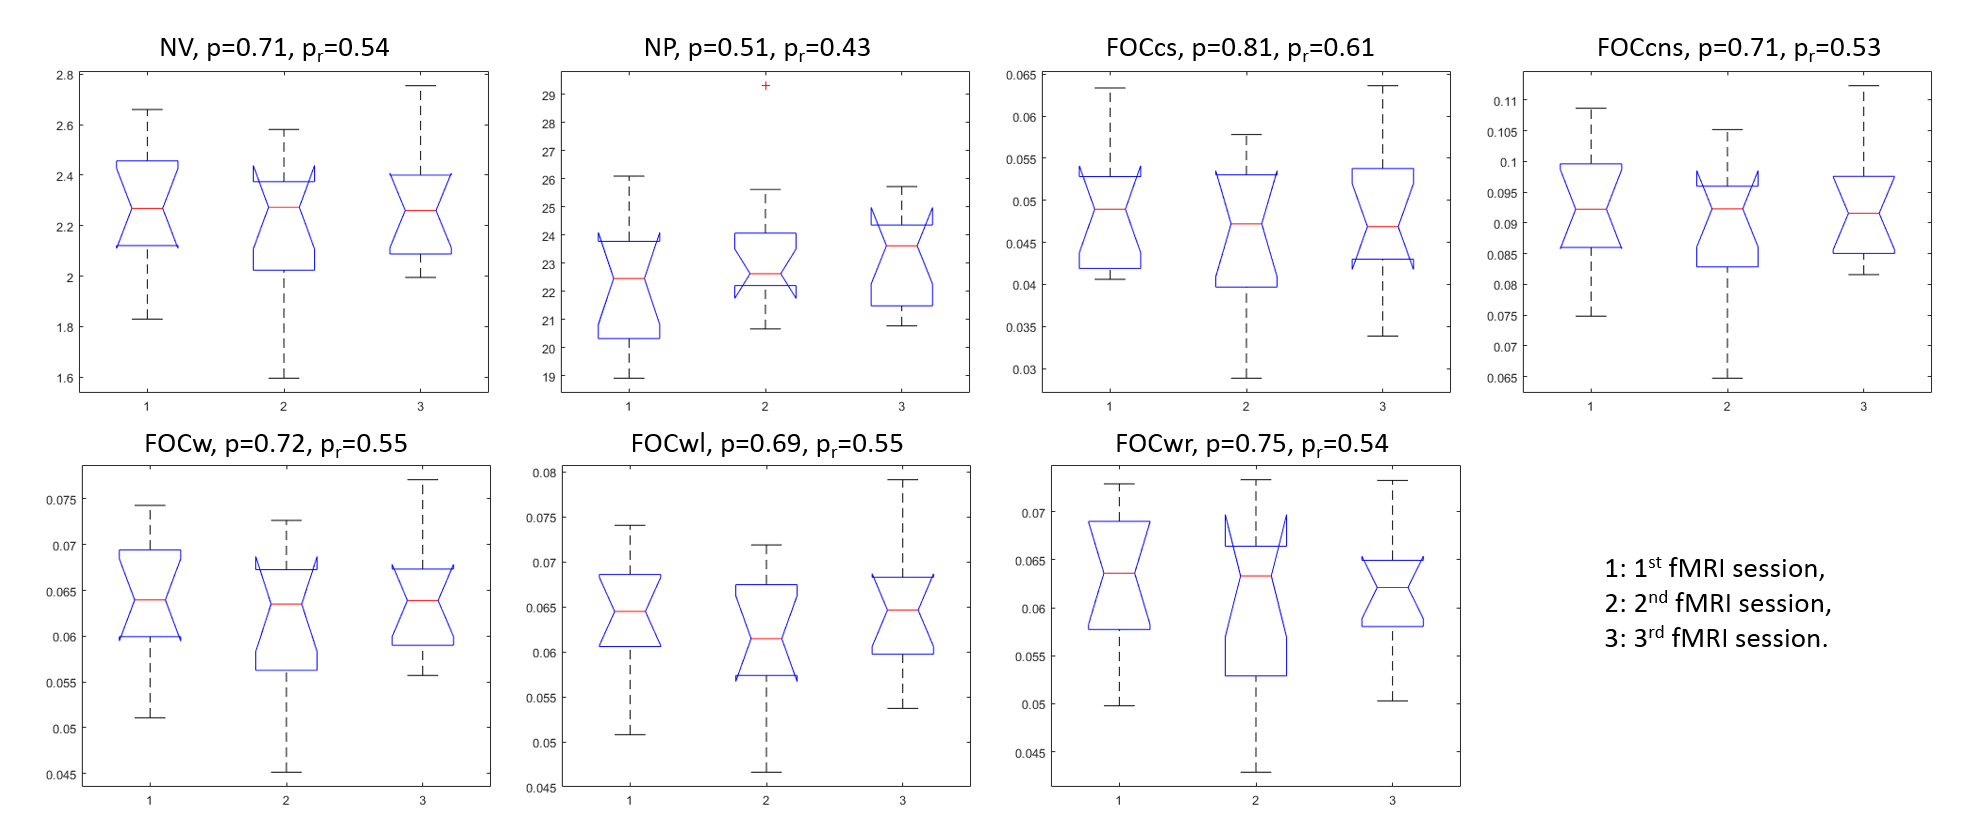
For dynamic network features, a sliding window approach was used with a window length of 20-time points. The window was moved 1-time point forward in each Pearson’s r calculation, resulting in 221 correlation matrices for each subject. Seven network features were acquired based on learned dynamic connectivity: Network Variation (NV), Network Power (NP), Flexibility of Interhemispheric Connectivity (homologous connections, FOCcs), Flexibility of Cross-hemispheric Connectivity (non-homologous connections, FOCcns), Flexibility of Intrahemispheric Connectivity (within hemisphere, FOCw), Flexibility of Left-hemispheric Connectivity (within left hemisphere, FOCl), and Flexibility of Right-hemispheric Connectivity (within right hemisphere, FOCr). These features summarized how connectivity patterns change between two correlation matrices (figure 1).
All the processing was done exactly the same in the three fMRI datasets. Finally, a 1-way ANOVA and a repeated measure ANOVA were carried out to test whether the mean value across subjects of all the measures was statistically different between the three scans.
Results
With ANOVA analyses, none of the graphical measures showed significant differences among the three fMRI sessions (p > 0.05 in all measures, figure 2). In addition, the dynamic network features did not demonstrate significant changes in the three fMRI datasets (p> 0.05 in all features, figure 3).Discussion
Our results further support previous studies that have shown that graphical measures are robust observations for resting state functional connectivity. In fact, research has demonstrated a better correlation between graphical measures and clinical indices than traditional measures and clinical scores8. Moreover, even though dynamic functional connectivity underlines how neural patterns change temporally, our dynamic network features are still reproducible across scans.Conclusion
We conclude that both graphical measures and dynamic network features are reproducible in rsfMRI. Although further investigations are needed (e.g. whether different algorithms of time-varying approach provide similar reproducibility), we propose that graphical measures and dynamic network features may be suitable for clinical research.Acknowledgements
No acknowledgement found.References
1. Hutchison RM, Womelsdorf T, Allen E a., et al. Dynamic functional connectivity: Promise, issues, and interpretations. Neuroimage. 2013;80:360-378. doi:10.1016/j.neuroimage.2013.05.079.
2. Rubinov M, Sporns O. Complex network measures of brain connectivity: Uses and interpretations. Neuroimage. 2010;52(3):1059-1069. doi:10.1016/j.neuroimage.2009.10.003.
3. Shah LM, Cramer JA, Ferguson MA, Birn RM, Anderson JS. Reliability and reproducibility of individual differences in functional connectivity acquired during task and resting state. Brain Behav. 2016;6(5):1-15. doi:10.1002/brb3.456.
4. Braun U, Plichta MM, Esslinger C, et al. Test-retest reliability of resting-state connectivity network characteristics using fMRI and graph theoretical measures. Neuroimage. 2012;59(2):1404-1412. doi:10.1016/j.neuroimage.2011.08.044.
5. Telesford QK, Morgan AR, Hayasaka S, et al. Reproducibility of graph metrics in FMRI networks. Front Neuroinform. 2010;4(December):117. doi:10.3389/fninf.2010.00117.
6. Hindriks R, Adhikari MH, Murayama Y, et al. Can sliding-window correlations reveal dynamic functional connectivity in resting-state fMRI? Neuroimage. 2016;127:242-256. doi:10.1016/j.neuroimage.2015.11.055.
7. Lin S-J, Liu A, MacKay A, Kosaka B, Beveridge, Samantha Vavasour I, Traboulsee, Anthony McKeown MJ. Brain Connectivity Network Dynamics Are Correlated with Cognitive Performance in Multiple Sclerosis. In: The Annual Meeting of the International Society for Magnetic Resonance in Medicine. 2016.
8. Schoonheim M, Geurts J, Wiebenga O, et al. Changes in functional network centrality underlie cognitive dysfunction and physical disability in multiple sclerosis. Mult Scler. 2013;20(8):1058-1065. doi:10.1177/1352458513516892.
Figures