5379
Pseudo-bootstrap network analysis - an application in functional connectivity fingerprinting1Indiana University, Bloomington, IN, United States
Synopsis
As an alternative to template based brain parcellation in functional connectivity analysis, nearly equal-sized random parcellations are applied to individual subjects multiple times to obtain a pseudo-bootstrap sample of the functional network. As one application, the method was applied on the HCP resting state dataset to identify individuals across scan sessions based on the mean functional connectivity. With a parcellation number of 278 and bootstrap sample size of 400, an accuracy rate of ~90% was achieved by simply finding the maximum correlation of mean functional connectivity of pseudo-bootstrap samples between two scan sessions.
Introduction
Brain parcellation divides the brain's spatial domain into small regions, which serve as nodes for network analysis. Ideally the nodes of the functional connectivity (FC) are individual neurons, which is unrealistic for MRI based whole brain imaging. As a compromise in practice, a template-based parcellation derived from a group of subjects is widely used1. The parcels on the template do not necessarily match individual's functional nodes. Considering that a voxel may contain millions of neurons, this kind of parcellation scheme can be regarded as a coarse sampling of the neurons with some constraints (e.g., the neurons are contiguous in space). As an extension, the bootstrap sampling of the neurons (voxels) can be an appealing approach. Here we proposed a pseudo bootstrap (PBS) pacellation method based on roughly equal-sized random parcellation2. These random parcellations can be applied to individual subjects multiple times to obtain a pseudo-bootstrap sample of the network. An application of PBS in functional connectivity fingerprinting was demonstrated.Methods
Resting state functional data from 87 subjects were downloaded from the data release of the HCP (https://www.humanconnectome.org/ ) (Q1 through Q3). Each subject has two sessions of rsfMRI scans: REST1 and REST2, which is one day apart. The dataset have been preprocessed and normalized the MNI template via nonlinear transformation. 400 random parcellation with 278 roughly equal-size parcels on the gray matter of the MNI template was generated using an algorithm by growing voxel neighborhoods around a set of randomly selected voxel-seeds based on geodesic distance. Functional connectivity was computed as the Pearson pair-wise correlation between the time series of the nodes after regressing motion parameters as well as signal from the white matter and CSF, resulting a 278 ´ 278 matrix for each parcellation. Each subject has 400 such FC matrices per session, and the mean of the FC (mFC) forms a vector of 400 elements. This vector was named as the mean FC vector (mFCV). To use the FC as a fingerprint to identify subjects across resting state fMRI scans3, the cross-correlation of the mFCV between all subjects in REST1 and all subjects in REST2 was calculated. A subject j in REST2 was predicted to be subject i in REST1 if the correlation $$$C_{ij}$$$ between node j and i is the largest among all subjects in REST2, i.e.
$$C_{ij}>C_{ik}, for \space k\neq j$$.
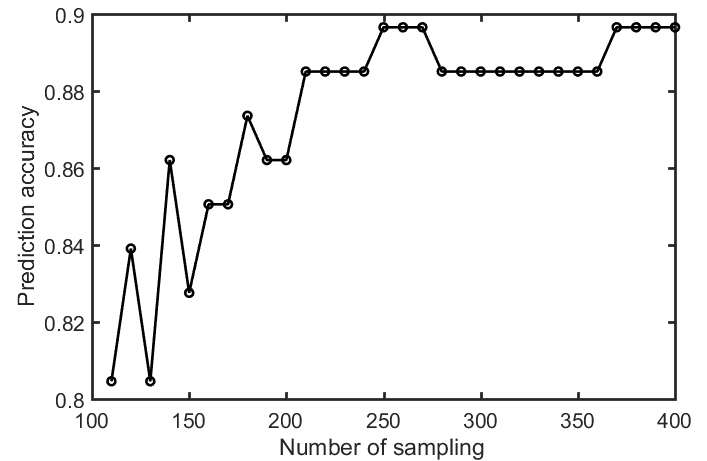
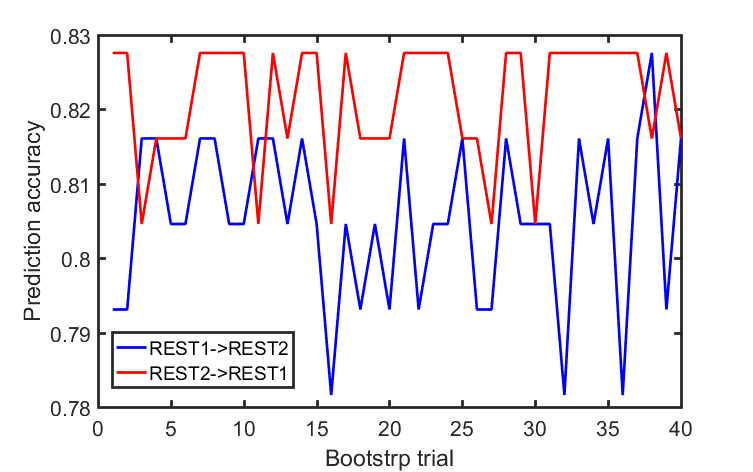
The same principle applied to matching a subject in REST1 a target subject in REST2. The prediction accuracy rate (PCR) was defined as the number of correct matching normalized by the total number of subjects. The effect of number of PBS samples on the PCR was assessed by reducing the number of random parcellation from 400 to 110. As a comparison, we also evaluated the PCR using the fingerprinting method proposed by Finn et al., which was based on the cross-correlation of the FC matrix derived from one single parcellation. The PCR was calculated 40 times with different random parcellation out of the 400.
Results
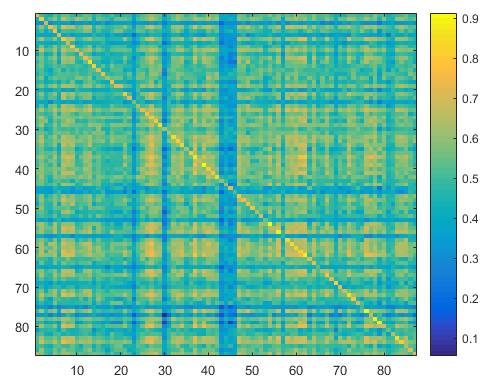
Each pseudo-bootstrap random parcellation gives rise to a FC matrix and a mean FC, an example of the distribution of the mean FC from 400 pseudo-bootstrap samples is shown in (A). The mean standard deviation of this distribution for all subjects is (2.05±0.67) ×10-3 in REST1 and (1.89±0.58) ×10-3 in REST2. The mean FC values of each subject in REST1 and REST2 along with their differences are plotted in (B). Fig. 1B shows that for some subjects, the mean FC value can be dramatically different between REST1 and REST2. Fig. 2 displays the correlation matrix of mFCV between subjects in REST1 and REST2. This correlation matrix represents the likelihood between subjects in terms of the coherence of change of mFC with parcellation. From that correlation matrix, the prediction accuracy rate turned out to be 0.885 from 1->2 (target in REST2) and 0.897 from 2->1 (target in REST1). The prediction accuracy was a function of the sampling number as shown in Fig. 3. As the number of sampling was down to 110 from 400, the accuracy for 2->1 drops from 0.897 to 0.804. With the method directly comparing the FC matrix from a single parcellation, the PCR was between 0.78 and 0.83 from 40 samples (Fig. 4).Discussion
Our results show that a higher prediction accuracy rate was achieved for FC fingerprinting with pseudo bootstrap parcellation compared to template based parcellation. In addition, PBS brings rich statistical analysis on the networks. For instance, with the distribution of the mFC, it is possible to compare the mFC between REST1 and REST2 statistically for individual subject.Acknowledgements
No acknowledgement found.References
1. de Reus MA and van den Heuvel MP, The parcellation-based connectome: limitations and extensions. Neuroimage. 2013;80:397-404. 2. Cheng H. et al., Evaluation of tractography using Fiberfox for whole brain connectome analysis. Proc. ISMRM. 2016;p1661. 3. Finn ES et al., Functional connectome fingerprinting: identifying individuals using patterns of brain connectivity. Nat Neurosci. 2015;18:1664-71.Figures