5378
Resting State Network Dynamics using Sliding-Window Detrending and Meta-Statistics: A New Approach for Real-time fMRI1Neurology, Physics and Astronomy, University of New Mexico, Albuquerque, NM, United States, 2NeurInsight LLC, Albuquerque, 3Neurology, Physics and Astronomy, University of New Mexico, 4CreativeC LLC, Albuquerque, 5Neurology, Physics and Astronomy, Electrical and Computer Engineering, University of New Mexico, Albuquerque, NM, United States, 6NeurInsight LLC, Albuquerque, NM, United States
Synopsis
This study introduces a real-time confound-tolerant approach for mapping resting-state network (RSN) dynamics that is compatible with ultra-high-speed fMRI and integrates the following processing steps: (a) iterative optimization of seed selection, (b) sliding-window online detrending of confounding signals, and (c) seed-based sliding-window correlation analysis using hierarchical running averages (meta-statistics) for mapping connectivity dynamics. The method maximizes sensitivity and specificity of mapping RSNs with enhanced suppression of spurious connectivity in WM and GM. This methodology is suitable for online monitoring of data quality, for clinical applications and basic neuroscience research of resting-state connectivity, for which there are no currently available tools.
Introduction
The discovery of resting-state functional connectivity1 enabled characterization of brain function in a network-based framework. An increasing number of studies have focused on dynamic function network connectivity (dFNC)2-5. Modulation of resting-state networks (RSNs) with task-based real-time fMRI has been studied6. However, the feasibility of real-time mapping of dFNC at the single-subject level has not yet been demonstrated. Here, we introduce a computationally efficient and confound-tolerant approach for mapping resting state network dynamics that is compatible with increasingly available ultra-high-speed fMRI data acquisition methods. This approach consists of the following steps: (a) clustering based iterative seed optimization that tailors the seed selection to the subject’s functional anatomy7, (b) sliding-window detrending of movement parameters, WM, and CSF time-courses, and (c) seed-baseMethods
Iterative seed optimization7 was performed in a pre-scan using Brodmann areas (BAs) as initial seed regions for wSCA. Optimized seeds for subsequent iterations were generated by masking the BAs using thresholded meta-mean correlation maps. Sliding window correlation with online detrending was computed as follows8,
$$\rho=\frac{\vec{x_s} \vec{r_s}}{|{\vec{x_s}|}{|\vec{r_s}}|}=\frac{(\vec{x}-\sum_{i=0}^{L-1} \alpha_i \vec{S_i})(\vec{r}-\sum_{i=0}^{L-1} \beta_i S_i)}{| {\vec{x}-\sum_{i=0}^{L-1} \alpha_i \vec{S_i}}| |{\vec{r}-\sum_{i=0}^{L-1} \beta_i \vec{S_i}}|}$$
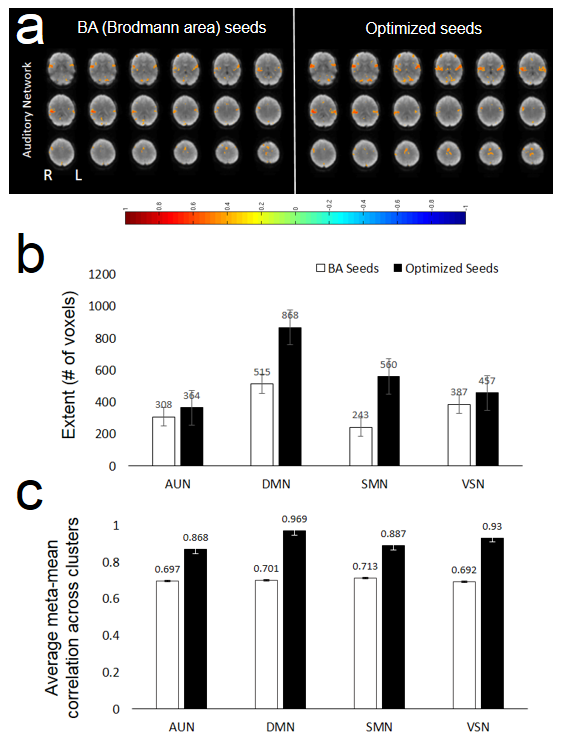
with αi and βi being the detrending coefficients. Hierarchical sliding window meta-statistics were computed using a running mean across a 1stlevel wSCA and a 2ndlevel running mean across the 1stlevel correlation maps (Figure 1). This approach was implemented in the TurboFIRE fMRI analysis software package8,9 using dynamic multi-threading. Resting state data (eyes-open) were collected in 3 healthy controls on a 3T scanner using MB-EPI10 (TR/TE: 292/35 ms, flip angle: 30o, voxel size: (3 mm)3, 32 slices, 10 min scan). Informed consent was obtained. Data were reconstructed and transferred in real-time to an external 6-core Linux workstation using a custom designed TCP/IP interface. Real-time processing included motion correction, 4s moving average temporal low pass filter, 5 mm isotropic Gaussian filter, spatial normalization into MNI space and 1st level wSCA with 8s sliding window and running mean. The complete pipeline with detrending and 1st and 2nd level meta-statistics (1st level-window: 8s; 2nd level-window: 30s) was tested offline using a custom-designed high-performance 16-core workstation (3.4 GHz) (CreativeC LLC, Albuquerque). Computer simulations showed that the 1st level meta-statistics with an 8s sliding-window provides a ~2.5-fold suppression for single spikes and signal-offsets11. Seed optimization7 was performed in 4 major resting state networks (RSNs) using unilateral seed regions (auditory-AUN–BA41, default-mode-DMN–BA7, sensorimotor-SMN–BA01-04, visual-VSN–BA17) using the first 1.5min of the scan and correlation threshold of 0.6.
Results
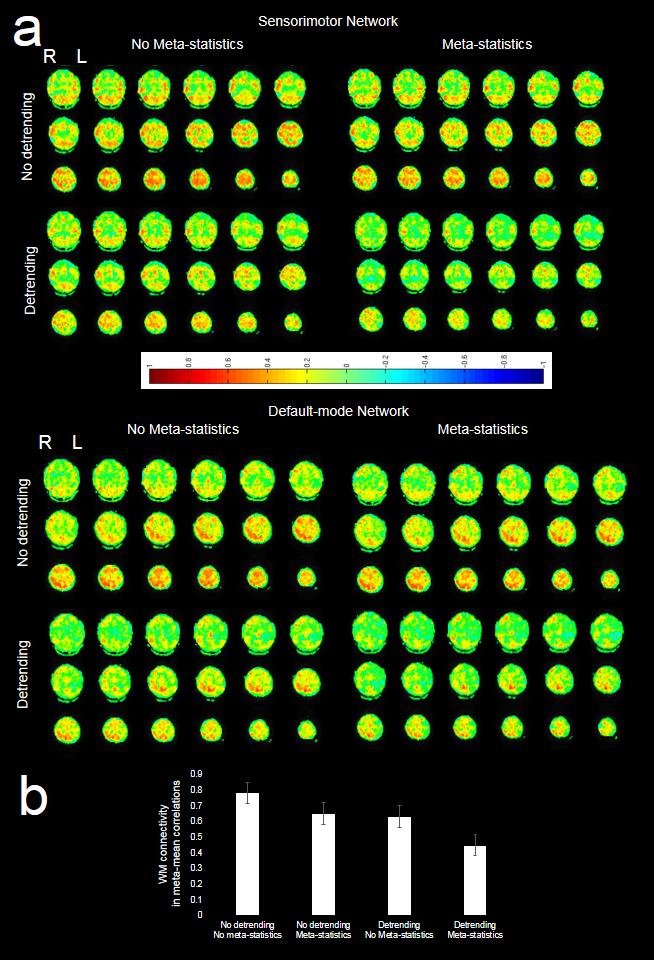
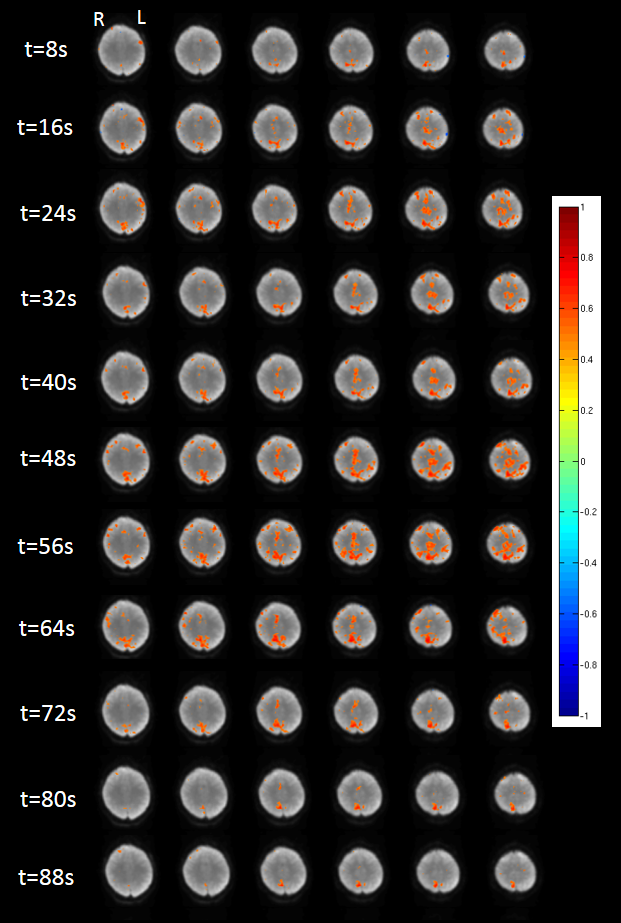
Image reconstruction and transfer took less than one TR. The computation time of the individual components of the processing pipeline using the 16-core workstation is shown in Figure 2. The latency between image transfer and update of the fully processed dFNC map was approximately ~6 TRs. Preliminary studies of seed optimization showed an increase in the spatial extent of connectivity and mean correlation coefficients, which increased contralateral connectivity after the 1st iteration (Figure 3). Strong suppression of artifactual connectivity in white matter and gray matter regions were measured with both detrending and 1st level wSCA (Figure 4). The suppression of artifactual connectivity in WM and GM regions was stronger with detrending than with 1stlevel wSCA. Combining the two methods further enhanced confound suppression (Figure 4). Mapping of dFNC revealed fluctuations in the amplitudes and spatial patterns of the 4 RSNs. An example of dynamically changing connectivity strength in the DMN is shown in Figure 5.Discussion
The study demonstrates the feasibility of real-time monitoring of changes in dFNC in single-subjects at time scales of 10s of seconds using an integrated real-time fMRI analysis pipeline that is compatible with highly sensitive ultra-high speed data-acquisition. We have shown that subject-specific seed optimization maximizes sensitivity and specificity of mapping intra-network connectivity in single-subjects. The combination of detrending and wSCA with hierarchical meta-statistics minimizes the impact of confounding signal sources. The performance of the current software tool is limited by the computational power of the workstation and adaption of the software (e.g., parallelization/multithreading) to the available computational resources. GPU based processing is expected to improve processing performance to match the TR of ultra-high-speed fMRI pulse sequences.Conclusions
This methodology is suitable for online monitoring of data quality in RSNs, for clinical applications such as presurgical mapping, and for neuroscience research using experimental feedback of resting state connectivity, for which there are currently no tools available.Acknowledgements
This research was supported by the National Institutes of Health grant numbers 1R41NS090691-01A1, 1R21EB018494-01A1. We gratefully acknowledge Arvind Caprihan for discussing the mathematical framework of the wSCA methodology. We thank Howard Yonas, Neurosurgery, University of New Mexico, Albuquerque, and Jan Mintorovitch, NeurInsight LLC, Albuquerque for their support of the project. A special thanks to Diana South for assistance with scanner operations.References
1. Biswal, B., Yetkin, F. Z., Haughton, V. M., and Hyde, J. S., 1995. Functional connectivity in the motor cortex of resting human brain using echo-planar MRI. Magn. Reson. Med. 34, 537-541. doi: 10.1002/mrm.1910340409.
2. Allen, E. A., Damaraju, E., Plis, S. M., Erhardt, E. B., Eichele, T., Calhoun, V. D., 2014. Tracking the whole-brain connectivity dynamics in the resting state. Cerebral cortex, November 11, 2014. doi:10.1093/cercor/bhs352.
3. Zalesky, A., Fornito, A., Cocchi, L., Gollo, L. L., Breakspear, M. 2014. Time-resolved resting-state brain networks. PNAS Vol. 111. www.pnas.org/cgi/doi/10.1073/pnas.1400181111
4. Hansen, E. C. A., Battagila, D., Spiegler, A., Deco, G., Jirsa, V. K. 2015. Functional connectivity dynamics: Modeling the switching behavior of the resting state. Neuroimage 105 (2015) 525-535.
5. Deng, L., Sun, J., Cheng, L., Tong, Shanbao. 2016. Characterizing dynamic local functional connectivity in the human brain. Nature. Doi: 10.1038/srep26976.
6. Sulzer J, Haller S, Scharnowski F, Weiskopf N, Birbaumer N, Blefari ML, Bruehl AB, Cohen LG, DeCharms RC, Gassert R, Goebel R, Herwig U, LaConte S, Linden D, Luft A, Seifritz E, Sitaram R. Real-time fMRI neurofeedback: progress and challenges. Neuroimage 2013;76:386–99.
7. Vakamudi, K., Ackley, E. S., Posse, S. 2015. Automated subject specific seed optimization improves detection of resting-state fMRI connectivity. ISMRM 2015, Toronto.
8. Gembris, D., Taylor, G. J., Schor, S., Frings, W., Suter, D., and Posse, S., 2000. Functional Magnetic Resonance Imaging in Real Time (FIRE): Sliding-Window Correlation Analysis and Reference-Vector Optimization. Mag. Reson. Med. 43:259-268.
9. Gao, K., Posse, S. 2003. TurboFire: Real-Time fMRI with Automated Spatial Normalization and Talairach Daemon Database, NeuroImage 19 (2), 838, 2003.
10. Moeller S, Yacoub E, Olman CA, Auerbach E, Strupp J, Harel N, Ugurbil K. Multiband multislice GE-EPI at 7 tesla, with 16-fold acceleration using partial parallel imaging with application to high spatial and temporal whole-brain fMRI. Magn Reson Med. 2010;63(5):1144-1153.
11. Vakamudi, K., Damaraju, E., Posse, S. 2016. Enhanced confound tolerance of resting fMRI: Combinnig regression and sliding-window meta-statistics. Hum Brain Mapp. 2016.
Figures
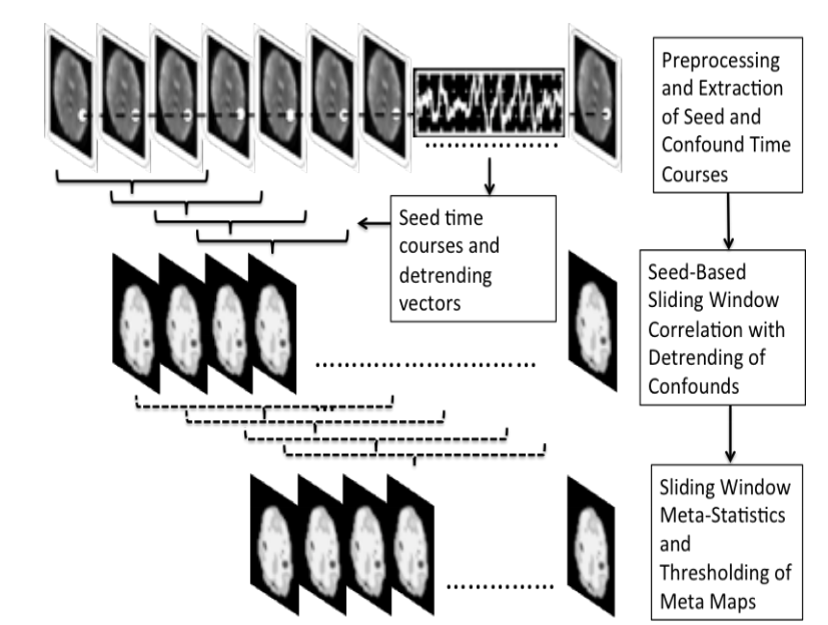
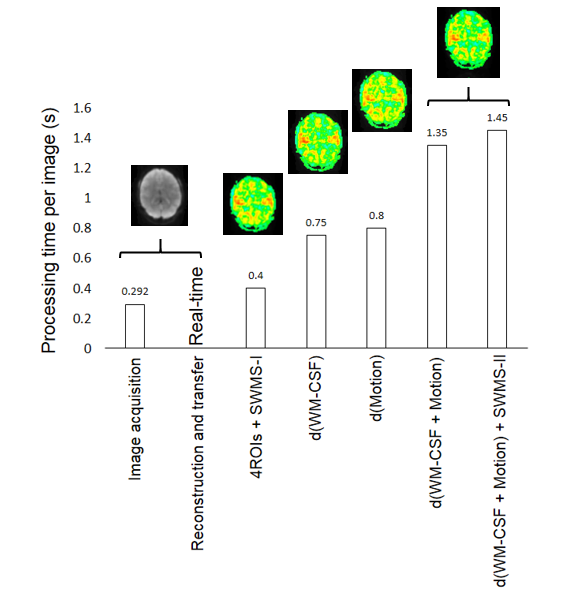
Figure 2. Processing times of each processing step along with resulting AUN maps with optimized-seed from right BA41 (displayed at zero-threshold to identify the artifactual WM connectivity). The latency between the transfer of the reconstructed image to the fully detrended map with hierarchical meta-statistics is ~1.2 s (~6 images).
Labels: 4ROIs+SWMS-I – 4 seed-regions belonging to 4-RSNs+1st level meta-statistics; d(WM-CSF) – only WM and CSF time-courses detrending; d(Motion) – only motion detrending; d(WM-CSF + Motion) – detrending of 6-rigid-body motion, WM, and CSF time-courses; d(WM-CSF + Motion)+SWMS-II – addition of 2nd sliding-window meta-statistics to the detrending of motion, WM, CSF.