5377
A computer aid diagnosis of diabetic nephropathy based on the combination of IVIM and BOLD imagingLihua Chen1, Zhizheng Zhuo2, Tao Ren1, Shuangshuang Xie1, Yu Zhang2, and Wen Shen1
1Radiology, Tianjin First Center Hospital, Tianjin, People's Republic of China, 2Philips healthcare, Beijing, People's Republic of China
Synopsis
To detect the changes of kidney diseases, magnetic resonance imaging(MRI) as a noninvasive approach has been proved to be more suitable for detecting and monitoring diabetic nephropathy(DN). Intravoxel incoherent motion (IVIM) and blood oxygenation level dependent (BOLD) MR imaging have been confirmed their high potential in detecting changes of renal function in patients with chronic renal diseases and transplanted kidneys.
Introduction
Diabetes nephropathy(DN), is followed by renal function deteriorating slowly and progression to end-stage renal disease, after the earliest clinical evidence of microalbuminuria is detected. The early diagnosis of the renal functional changes is vital for the clinical treatments. Intravoxel incoherent motion (IVIM) and blood oxygenation level dependent (BOLD) MR imaging have been confirmed their high potential in detecting changes of renal function in patients with chronic renal diseases and transplanted kidneys1,2. In this work, computer aid diagnosis of the renal functional changes related to diabetic nephropathy was proposed based on the combination of IVIM and BOLD imaging.Methods
Six patients with type 2 diabetes (mean age 44.0±3.9 years) and 10 healthy controls (mean age 24.1±6.7 years) were involved and examined using a 3.0 T MR scanner (Ingenia, Philips Healthcare, Best, the Netherlands). All six patients with chronic kidney disease due to diabetic nephropathy showed increasing 24 hours proteinuria. Coronal-oblique IVIM was obtained with following parameters: voxel size = 0.9×0.9×4.0 mm3, TE/TR - 52/500ms, and 11 b values of 0, 10, 20, 30, 50, 75, 100, 200, 300, 500, and 700 s/mm2. The perfusion fraction(f), pseudo-diffusion coefficient (D*) and diffusion coefficient(D) were calculated by a bi-exponential fitting method. BOLD-MRI using multiple T2*-weighted gradient echo sequence, was acquired in coronal-oblique plane with the following parameters: TR=117ms; TE=2.3-39.1ms, echo time spacing=9.2ms; flip angle=35°; slice thickness=5mm, matrix=220×220. The medullary and cortical R2* (R2star) values were quantified with BOLD. Three sections nearest to the renal hilum were selected for region of interest (ROI) analysis. For each selected section, three ellipsoid ROIs of approximately 10-15 pixels were placed in the medulla, and a ROI of 80-120 pixels was manually delineated to cover the renal cortex. For the cortex and medulla, totally 8 parameters were extracted for each patient. All the parameters were compared between patients and healthy controls by using Mann-Whitney U in SPSS 17.0 software (SPSS Inc., Chicago, IL, USA) and P <0.05 indicated a significant difference. ROC analysis was carried out to evaluate the ability of the parameters, which showed a significant difference between patients and normal controls. Finally, based on the IVIM and R2* parameters those showed a statistically difference, a couple of classifiers (including naïve bayes, artificial neural network, support vector machine and random tree) were performed to predict the renal functional situation, which can be used as a computer aid diagnosis of the early diabetic nephropathy.Results and Discussion
For the cortical D, there are significant differences between the patient and normal controls groups. The mean values of cortical D are 1.87±0.10×10⁻³mm2/s and 2.03±0.06×10⁻³mm2/s for patients and normal controls respectively. The mean values of cortical and medullar R2*(9.92±0.39 s-1 and 23.05±6.01 s-1) of patient group slightly increased compared to healthy controls’ (9.14±0.70 s-1and 17.73±1.05 s-1), which was consistent with previous study3. The results may indicate that these changes, including decreased perfusion of cortex, decreased diffusion of both cortex and medullar combined increased oxygenation consumption may coexist in patients with DN. The ROC analysis result was shown in Figure 1 and the classification results based on a multiple classifiers were shown in Table 1. The naïve bayes showed the best performance (accuracy of 87.5%, sensitivity of 83.3% and specificity of 90%) for the differentiation of diabetic nephropathy from normal controls, which indicated that this classifier can be applied as a computer aid technique to help the doctors diagnose the disease.Conclusion
The IVIM and BOLD were able to reflect perfusion, diffusion and oxygenation information in healthy controls and patients with diabetes nephropathy, and the classifiers especially naïve bayes have the ability to differentiate the diabetic nephropathy from the normal controls which can help the doctors to diagnose the disease in early stages.Acknowledgements
No acknowledgement found.References
[1]Wang ZJ, Kumar R, Banerjee S, Hsu CY. Blood oxygen level-dependent (BOLD) MRI of diabetic nephropathy: preliminary experience. J Magn Reson Imaging. 2011;33(3):655-60. [2] Neugarten J, Golestaneh L. Blood oxygenation level-dependent MRI for assessment of renal oxygenation. Int J Nephrol Renovasc Dis. 2014; 21;7:421-35. [3]Yin WJ, Liu F, Li XM, et al. Noninvasive evaluation of renal oxygenation in diabetic nephropathy by BOLD-MRI. Eur J Radiol. 2012;81(7):1426-31.Figures
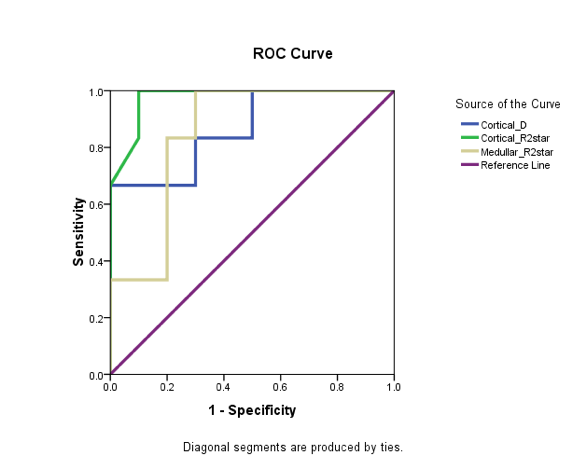
The ROC analysis results of the cortical D,
cortical R2star and medullar R2star. The AUCs (area under the curve) are 0.867,
0.975 and 0.850 respectively.
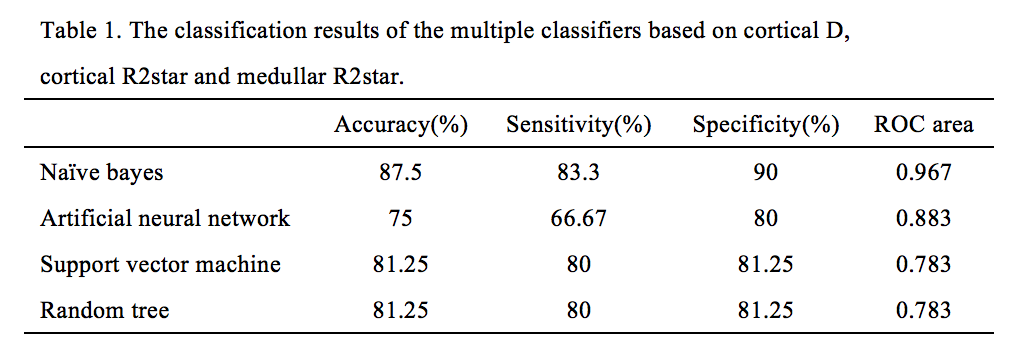
Table 1