5375
Influence of temporal filtering and global signal regression on resting state networks in the rat brain1RG Translatioanl Imaging, Department Neuroimaging, Central Institute of Mental Health, Medical Faculty Mannheim / Heidelberg University, Mannheim, Germany
Synopsis
In a test-retest fMRI experiment we examined the influence of temporal filtering and global signal regression (GSR) on resting state networks in rats. Connectivity and topological properties as well as their test-retest reliability were assessed for eight filtering variants (with and without GSR, four frequency bands). We found GSR to strongly impair the expected structure of networks. The choice of temporal filtering frequencies whereas did not have a significant effect. Test-retest-reliability was low for all filtering variants. Based on our results we recommend to use less restrictive bandpass filters but no GSR.
Introduction
Network approaches have become increasingly important in resting state fMRI in recent years. Despite the popularity of the methods standard procedures generally agreed on are missing for some aspects. One of these is the choice of frequency limits for temporal filtering of the resting state signal. A widely used (but arbitrary) frequency range is 0.01 Hz to 0.1 Hz. But, especially in rodents with physiological signals well beyond Nyquist‘s limit, extending the analysis to higher frequencies could yield additional information. Another issue under discussion is whether global signal regression can improve the quality of networks or introduces spurious negative correlation 1. In this study the impact of the choice of bandpass filter limits and global signal regression on resting state networks was investigated. Additionally the test-retest reliability of network results was examined. To that end a repeated measurements study design was assessed and functional networks were calculated for globally regressed and non-regressed datasets and various bandpass filters. Connectivity as well as network metrics describing functional integration and segregation were examined. A similar study in humans showed small world network properties and moderate reliability2.Methods
Resting state fMRI data from 8 healthy rats (each scanned twice) was preprocessed as previously described3. GSR was applied to each dataset. All further analyses were conducted on GSR and non GSR data. Three different bandpass filters were applied. Beside the common choice, 0.01-0.1 Hz, we filtered at 0.11-0.2 Hz and 0.21-0.3 Hz. Additionally we applied a highpass filter (>0.01 Hz). In total there were eight variants of filtering to compare for each measurement. Functional brain networks were calculated for each dataset individually by pairwise correlation of 46 regional timecourses. Regions were defined by an anatomical atlas4, voxel wise timecourses were averaged over all voxels in a region. For network analysis, especially the calculation of graph theoretical measures, we thresholded the networks at a sparsity range of 0.1 to 0.4 with a stepwidth of 0.1. As there is currently no clear interpretation of the role of negatively weighted edges in functional networks, we decided to restrict further analysis to positively weighted edges. Global and local efficiencies5 as well as centrality measures (betweenness and degree centralities were calculated using Brain Connectivity Toolbox6. Because the choice of network density is somewhat arbitrary, we regarded areas under the curve (AUC, integral of a network property over a range of densities), rather than single density values. The influence of temporal filtering and GSR was assessed by two-way ANOVA. Furthermore test-retest-reliability of connectivity and network structure was assessed by intra class correlation (ICC)7.Results
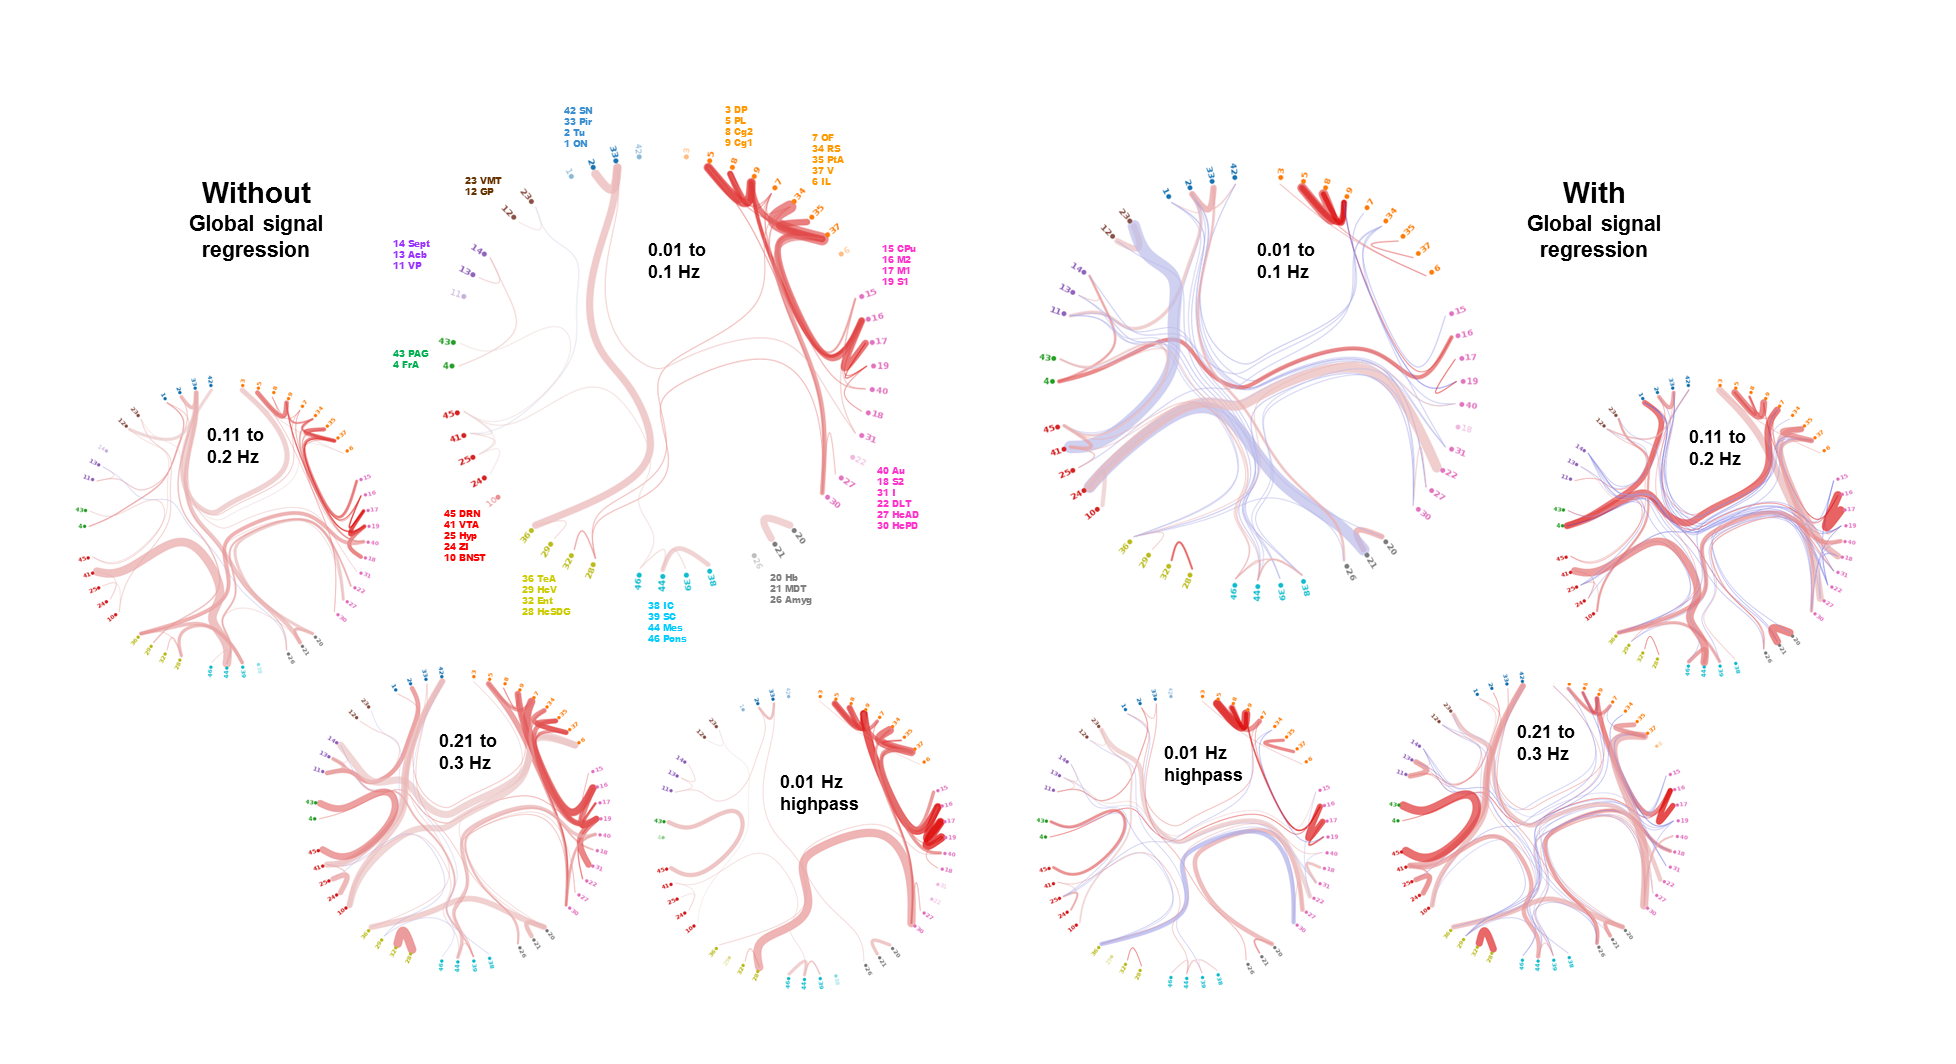
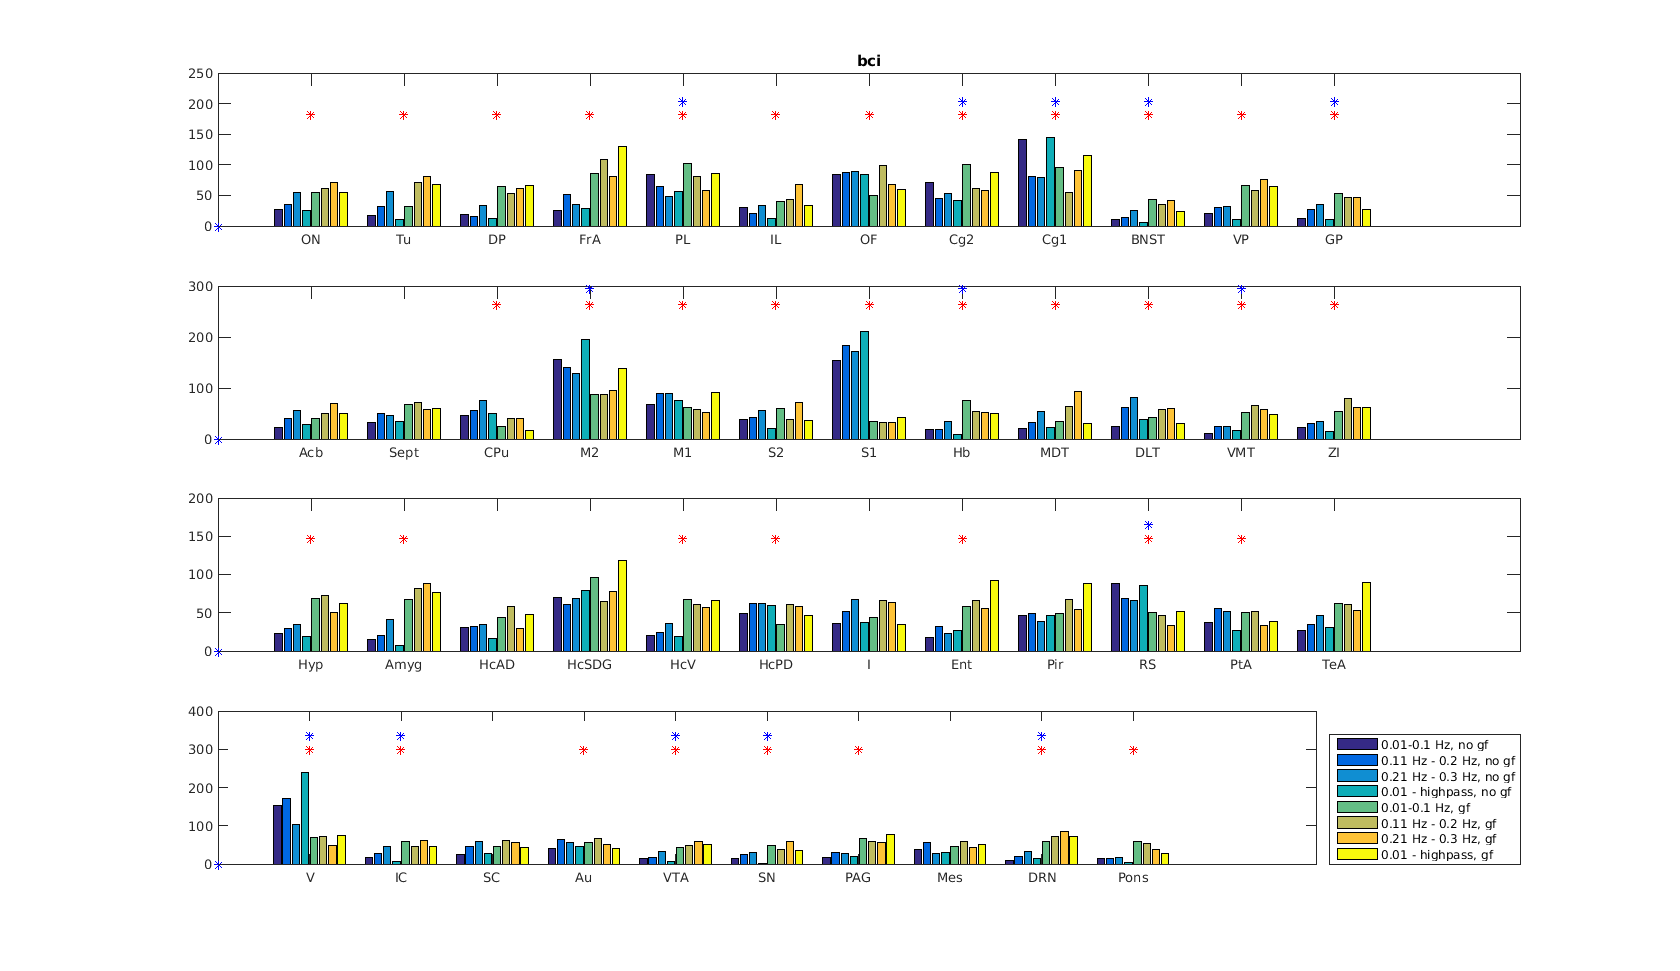
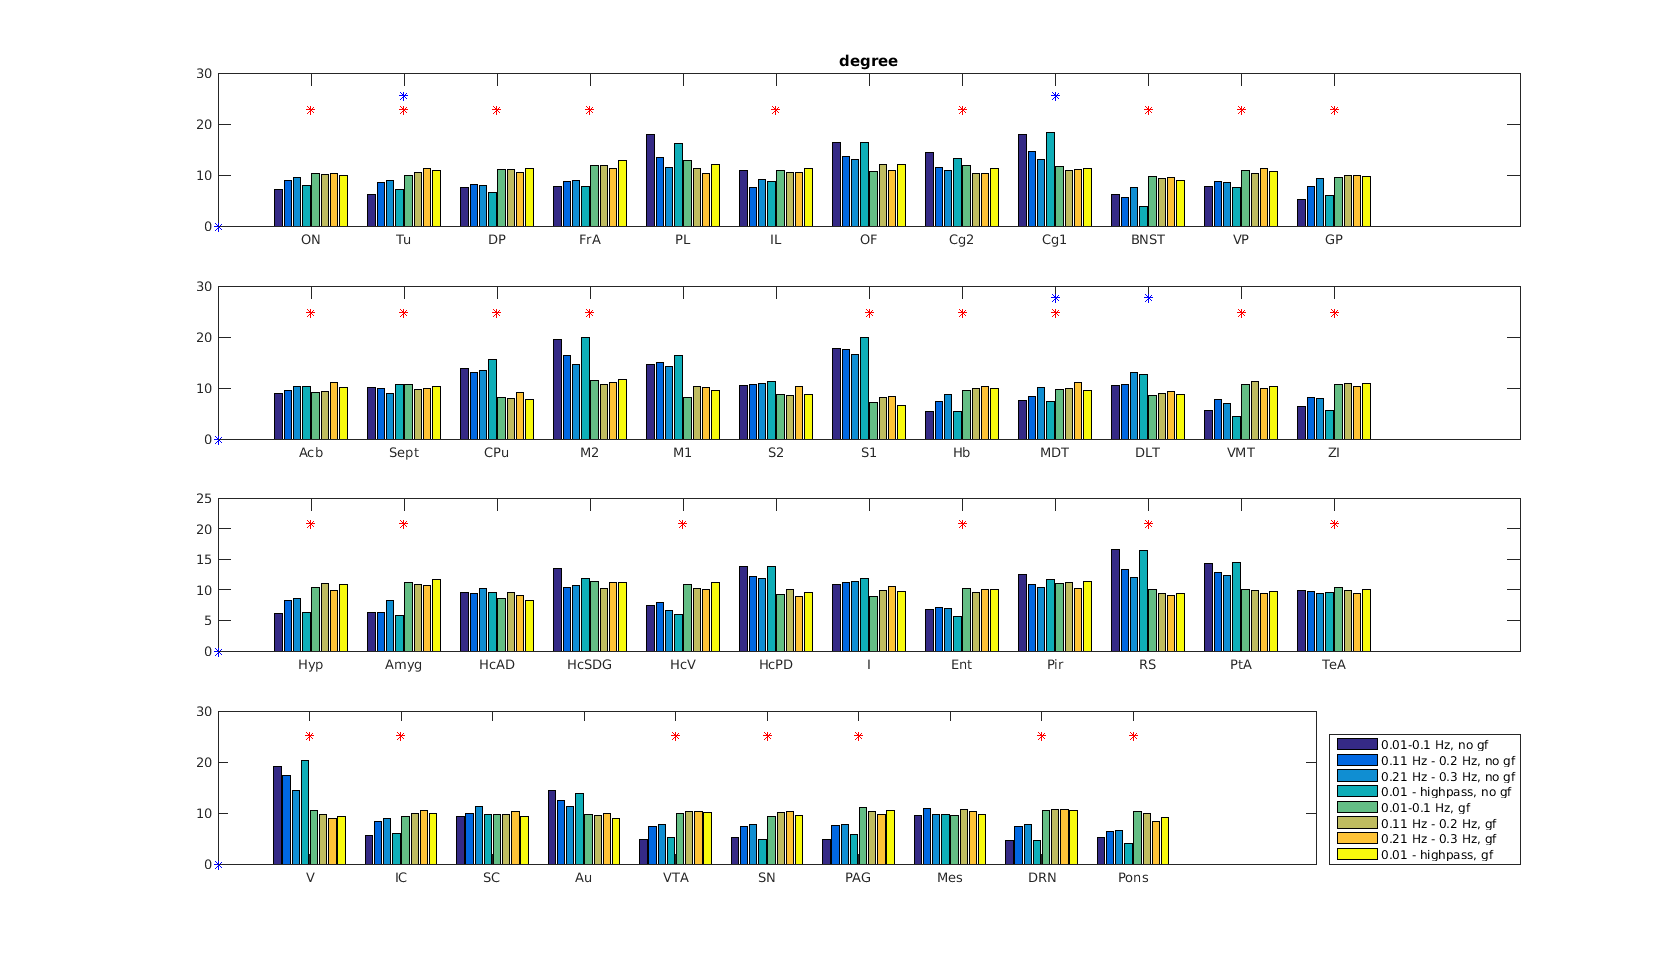
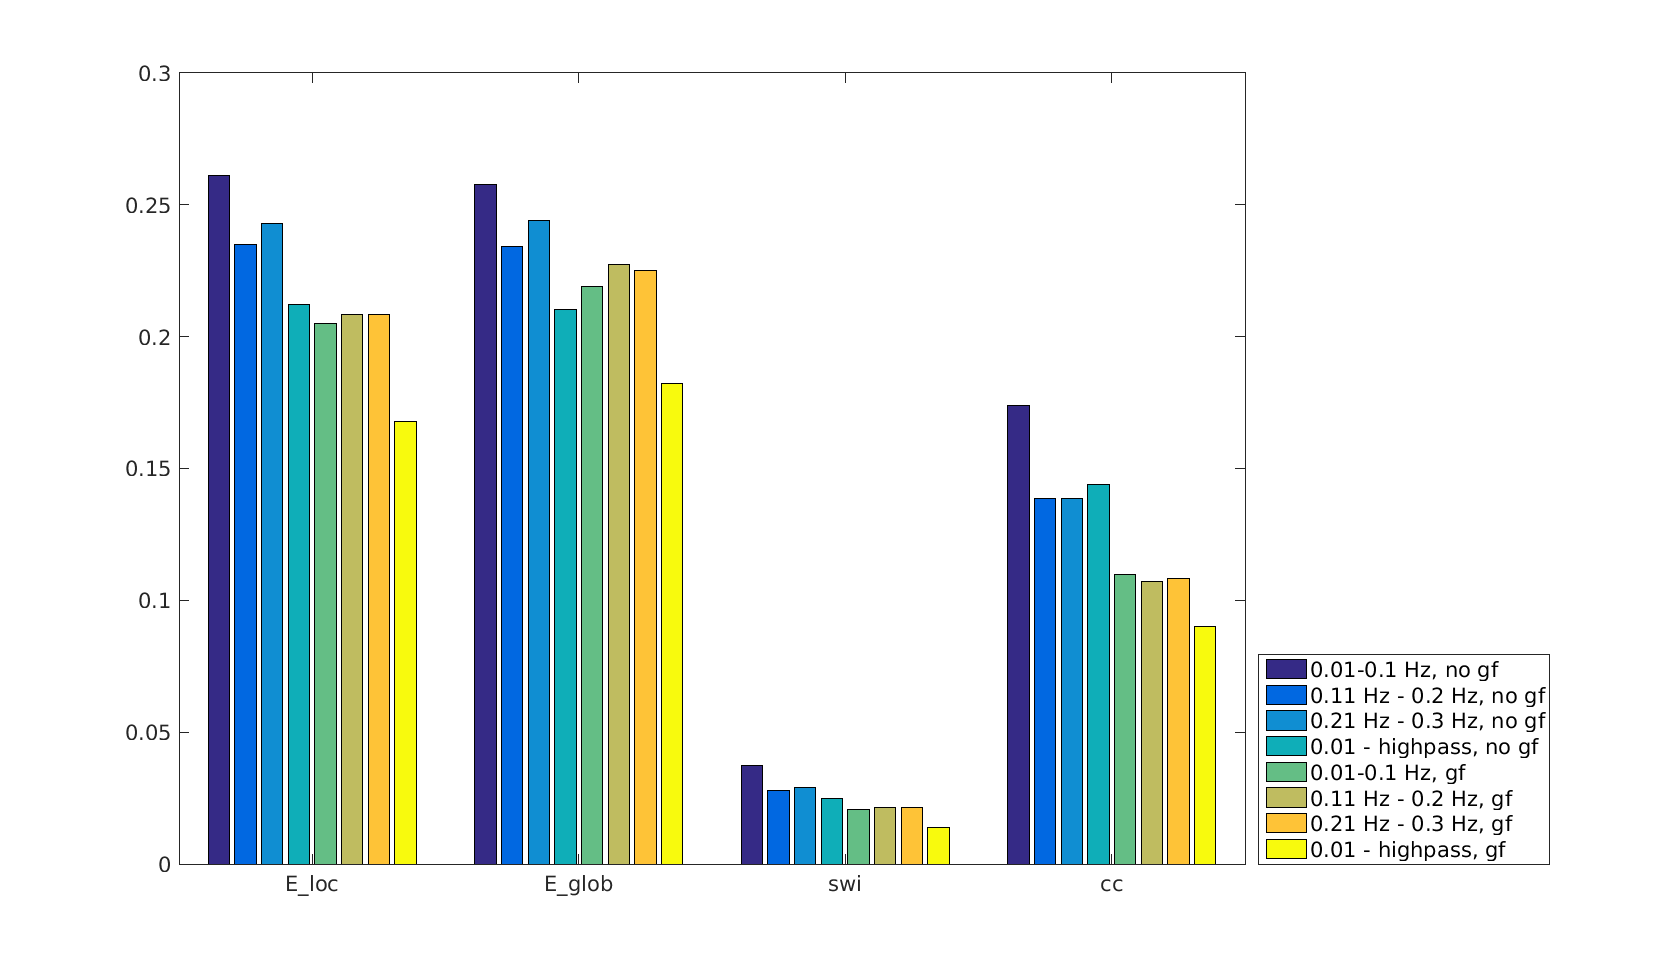
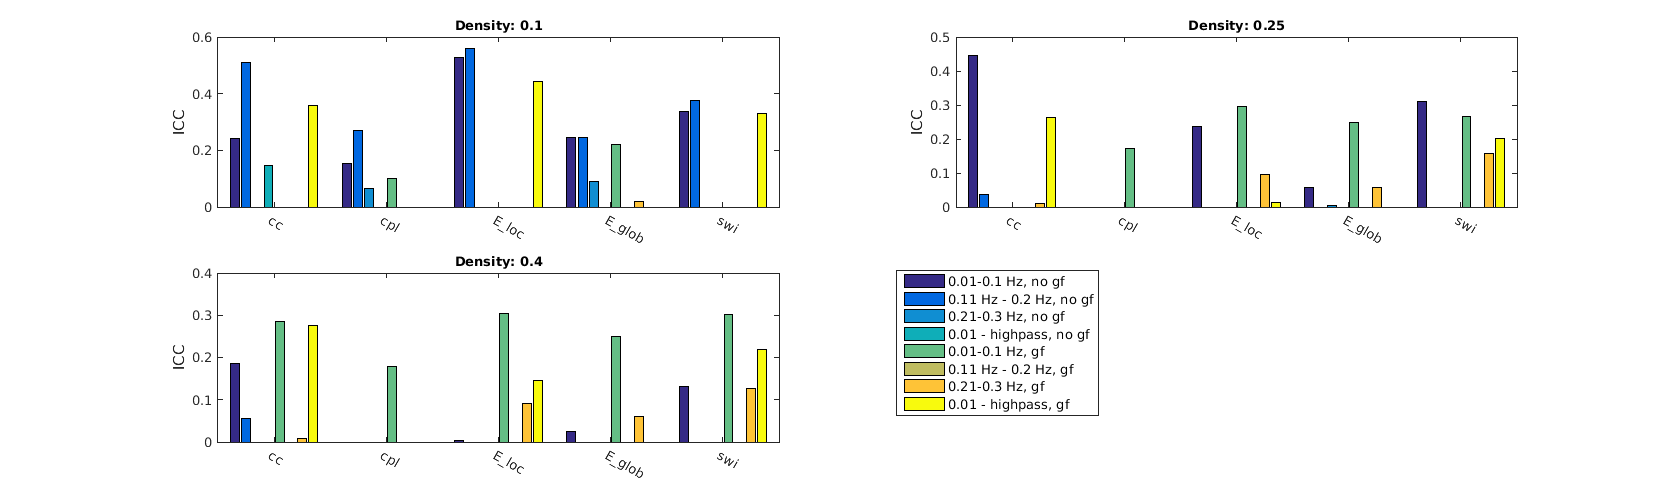
Functional connectivity structure for different filtering strategies (Fig 1) shows that global signal filtering has a strong impact on functional networks. An increased percentage of negatively weighted edges was observed along with alterations in network structure. As expected the non globally-regressed networks showed strongly connected default mode (DMN) and sensory-motor (SM) networks. After global signal regression, connectivity in these typical subnetworks was decreased in favor of mostly negatively weighted long range connections. The choice of temporal filter did not change network structure substantially (Fig 1). Strong DMN and SM were still found in higher frequency ranges. Nevertheless additional connectivity occurred at higher frequencies. For all filtering strategies there were few connections (not necessarily the strongest) showing high ICC (0.7-0.8), for most edges ICC values were very low (0-0.3). Degree and betweenness centralities are significantly influenced by GSR (Fig 2,3). AUC values are indicating a loss of structure. While non GSR networks show higher centralities in DMN and SM regions, after GSR centralities are more uniformly distributed over the brain. DMN regions are less central after GSR and at higher frequencies. Accordingly, overall efficiency and small-worldness are decreased, GSR having stronger effect than temporal filtering (Fig 4). Reliability of network properties was mostly poor (0-0.3) but tended to be higher (~0.5) at low frequencies (Fig 5). Interestingly for low network densities non GSR networks were more reliable, for higher densities GSR networks had higher ICC.Discussion
Despite generally low test-retest- reliability for the connection strength as well as global and local graph metrics, resting state networks showed the expected structure (strong DNM and SM areas). GSR was found to produce less structured and less efficient networks. The application of GSR is therefore not recommended. Regarding the choice of bandpass filter limits, the traditional choice (0.01 - 0.1 Hz) leads to networks more clearly showing the expected properties than higher frequencies. Nevertheless frequencies above 0.1 Hz yield additional connectivity information and should be take into account.Acknowledgements
We thank Felix Hörner for excellent technical assistance.References
1. Murphy K, Birn RM, Handwerker DA, Jones TB, Bandettini PA. The impact of global signal regression on resting state correlations: Are anti-correlated networks introduced? NeuroImage 2009; 44(3): 893-905.
2. Braun U, Plichta MM, Esslinger C, Sauer C, Haddad L, Grimm O, et al. Test-retest reliability of resting-state connectivity network characteristics using fMRI and graph theoretical measures. Neuroimage 2012; 59(2): 1404-1412.
3. Gass N, Schwarz AJ, Sartorius A, Schenker E, Risterucci C, Spedding M, et al. Sub-anesthetic ketamine modulates intrinsic BOLD connectivity within the hippocampal-prefrontal circuit in the rat. Neuropsychopharmacology 2014; 39(4): 895-906.
4. Schwarz AJ, Danckaert A, Reese T, Gozzi A, Paxinos G, Watson C, et al. A stereotaxic MRI template set for the rat brain with tissue class distribution maps and co-registered anatomical atlas: Application to pharmacological MRI. NeuroImage 2006; 32(2): 538-550.
5. Latora V, Marchiori M. Economic small-world behavior in weighted networks. The European Physical Journal B-Condensed Matter and Complex Systems 2003; 32(2): 249-263.
6. Rubinov M, Sporns O. Complex network measures of brain connectivity: uses and interpretations. Neuroimage 2010; 52(3): 1059-1069.
7. Shrout PE, Fleiss JL. Intraclass correlations: Uses in assessing rater reliability. Psychological Bulletin 1979; 86(2): 420-428.
Figures