5373
Structural basis of functional networks: A fMRI/DTI fusion approach in network level1Biomedical Engineering, Amirkabir University of Technology (Tehran Polytechnic), Tehran, Iran, 2School of Cognitive Sciences, Institute for Research in Fundamental Sciences (IPM), Tehran, Iran
Synopsis
MRI provides the capability of obtaining different information from various aspects of the brain. More comprehensive understanding of the brain can be achieved by combining multimodal brain imaging data. Using Diffusion Tensor Imaging (DTI) in addition to resting state fMRI (rs-fMRI), we have proposed a novel multivariate fusion approach to find supportive structural basis of brain functional networks. Two known functional networks and their counterpart structural networks were extracted through this method.
Introduction
rs-fMRI is a well-known approach to explore brain functional connectivity (FC). However, the association of function with brain structure which can be assessed by diffusion imaging, is challenging. Although various information of different aspects of brain can be obtained by using these methods separately, joint analysis of data leads to important cross-information that cannot be detected using a single modality. Recently, there has been a growing interest in multimodal fusion methods, namely between DTI and fMRI, which find relationship between extracted voxel based features through data driven methods[1]. There have been remarkable achievements in these approaches but they are mostly in the voxel level and therefore cannot provide direct information about brain connectivity. Here, we extended a data driven Graph-ICA[2] method to a multimodal fusion method to investigate relationship of brain structural and functional connectivity. Using our proposed graph joint-ICA method, brain network level relationship can be found to determine supporting structural network of well-known functional network.Methods
DTI, resting-state fMRI and T1-weighted images of 32 (21 females, 11 males) healthy participants were obtained from the International Consortium for Brain Mapping (ICBM) database in the Image Data Archive (IDA) of the Laboratory of Neuro Imaging (LONI) (http://www.loni.usc.edu/ICBM/). All MRI scans were acquired with 1.5 Tesla Siemens Sonata scanner.
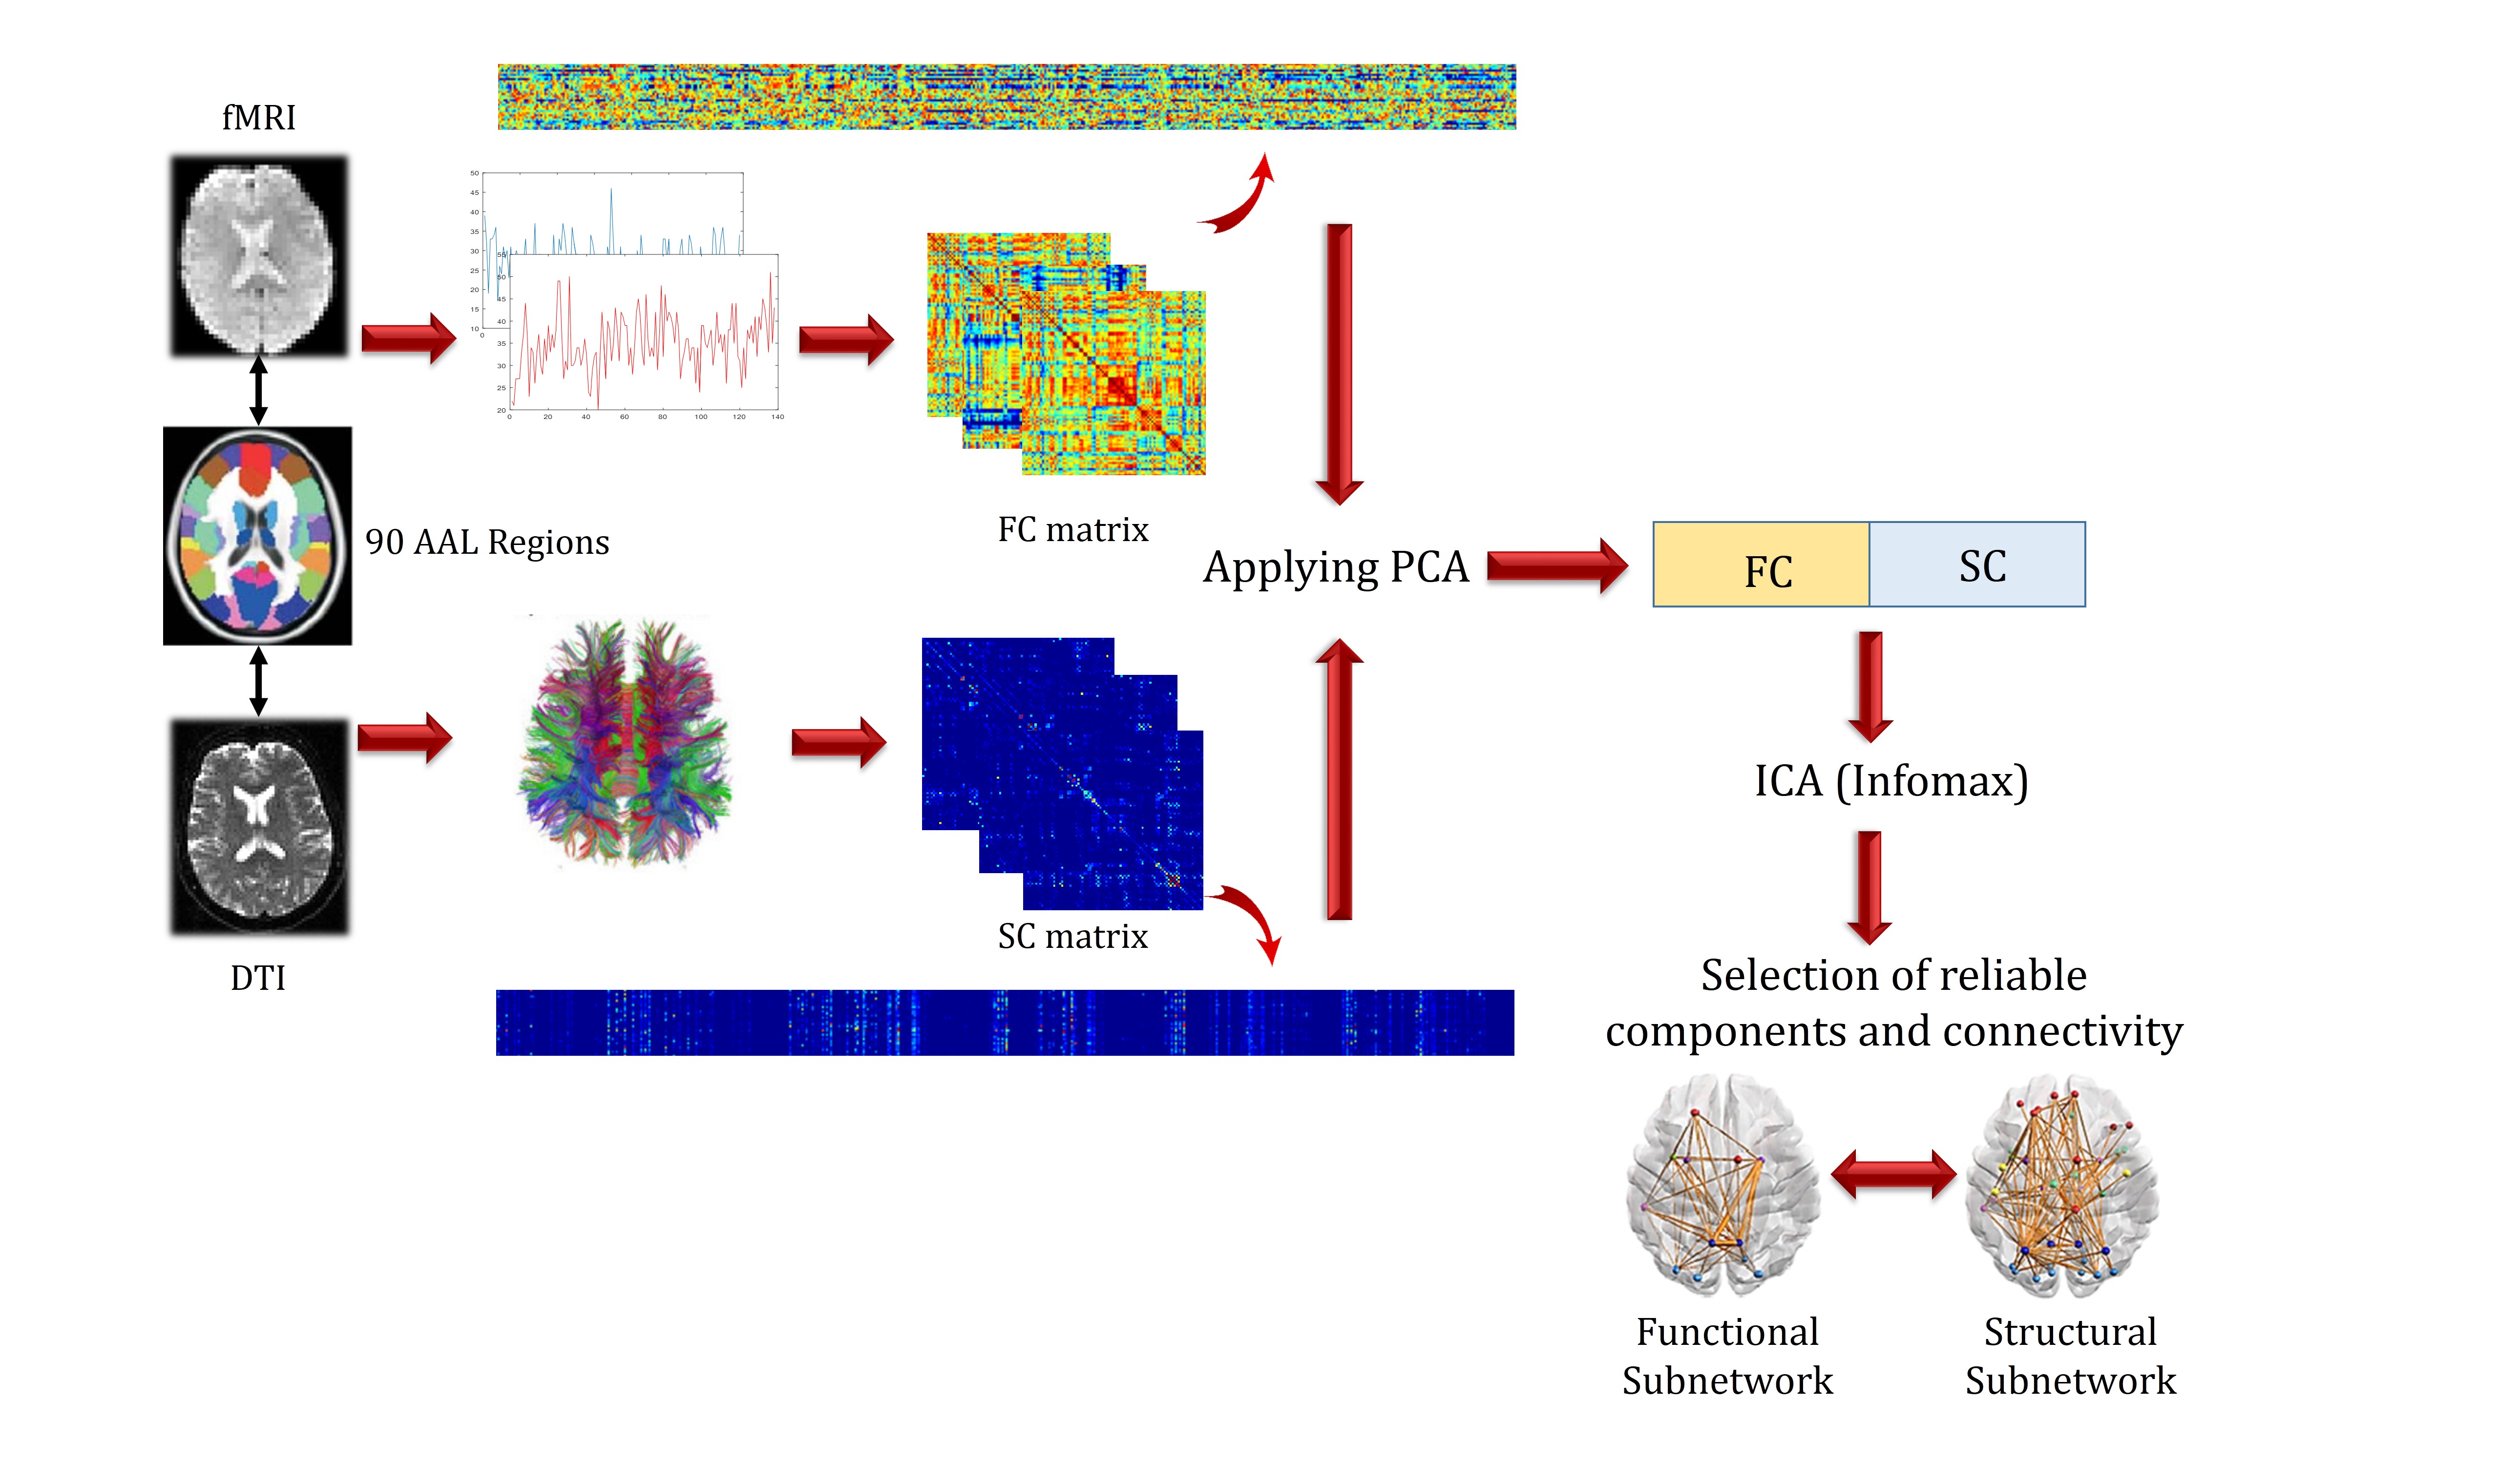
Functional Connectivity: Each dataset included 138 EPI brain volumes for functional imaging of each subject. Pre-processing of fMRI was performed using FMRIB Software Library (FSL) (version 5.0.6). Nuisance variables (average signal of CSF and white matter) were regressed out from the regional time series. Band pass filtering (0.009-0.08 Hz) was also applied. After image registration to standard 2mm3 Montreal Neurological Institute (MNI) template, the preprocessed data were parcellated to 90 cortical and subcortical regions using Anatomical Automatic Labelling (AAL) templates. Functional connectivity (FC) matrix of each subject was constructed by calculating normalized pairwise Pearson’s correlation of BOLD signal.
Structural Connectivity: Diffusion images consist of 30 diffusion weighted images with b-value of 1000 s/mm2 and five T2-weighted images with no diffusion sensitization gradients (b=0 s/mm2). Preprocessing and Tractography were implemented in diffusion MR toolbox ExploreDTI. Considering AAL parcellation, structural connectivity (SC) matrix was constructed. Each element of SC matrix is number of fibers passing through each pair of regions which are normalized by the total volume of connected region pairs.
Fusion Method: Lower triangular part of SC and FC matrices were vectorized for each subject and then stacked to form the overall connectivity matrices. The matrices were then normalized column-wise separately. Principle Component Analysis (PCA) was used for each matrix to reduce data dimension and the reduced matrices were then concatenated horizontally. Joint ICA (jICA) based on Informix algorithm[3] was applied on the matrix. To identify reproducible components, the procedure was repeated 100 times and high reproducible components were selected based on RAICAR[4] (Ranking and averaging independent component analysis by reproducibility) algorithm. Reliable connections of selected components were determined by bootstrap resampling[5]. Connections were selected based on two criteria: 1) having large magnitude of bootstrap ratio and 2) not including zero in 95% confidence interval. This procedure is demonstrated in Fig.1. Statistically significant connections were chosen based on 97.22% confidence (z-score of 2.2). FC and SC corresponding networks are finally determined called related functional-structural brain sub-networks.
Results
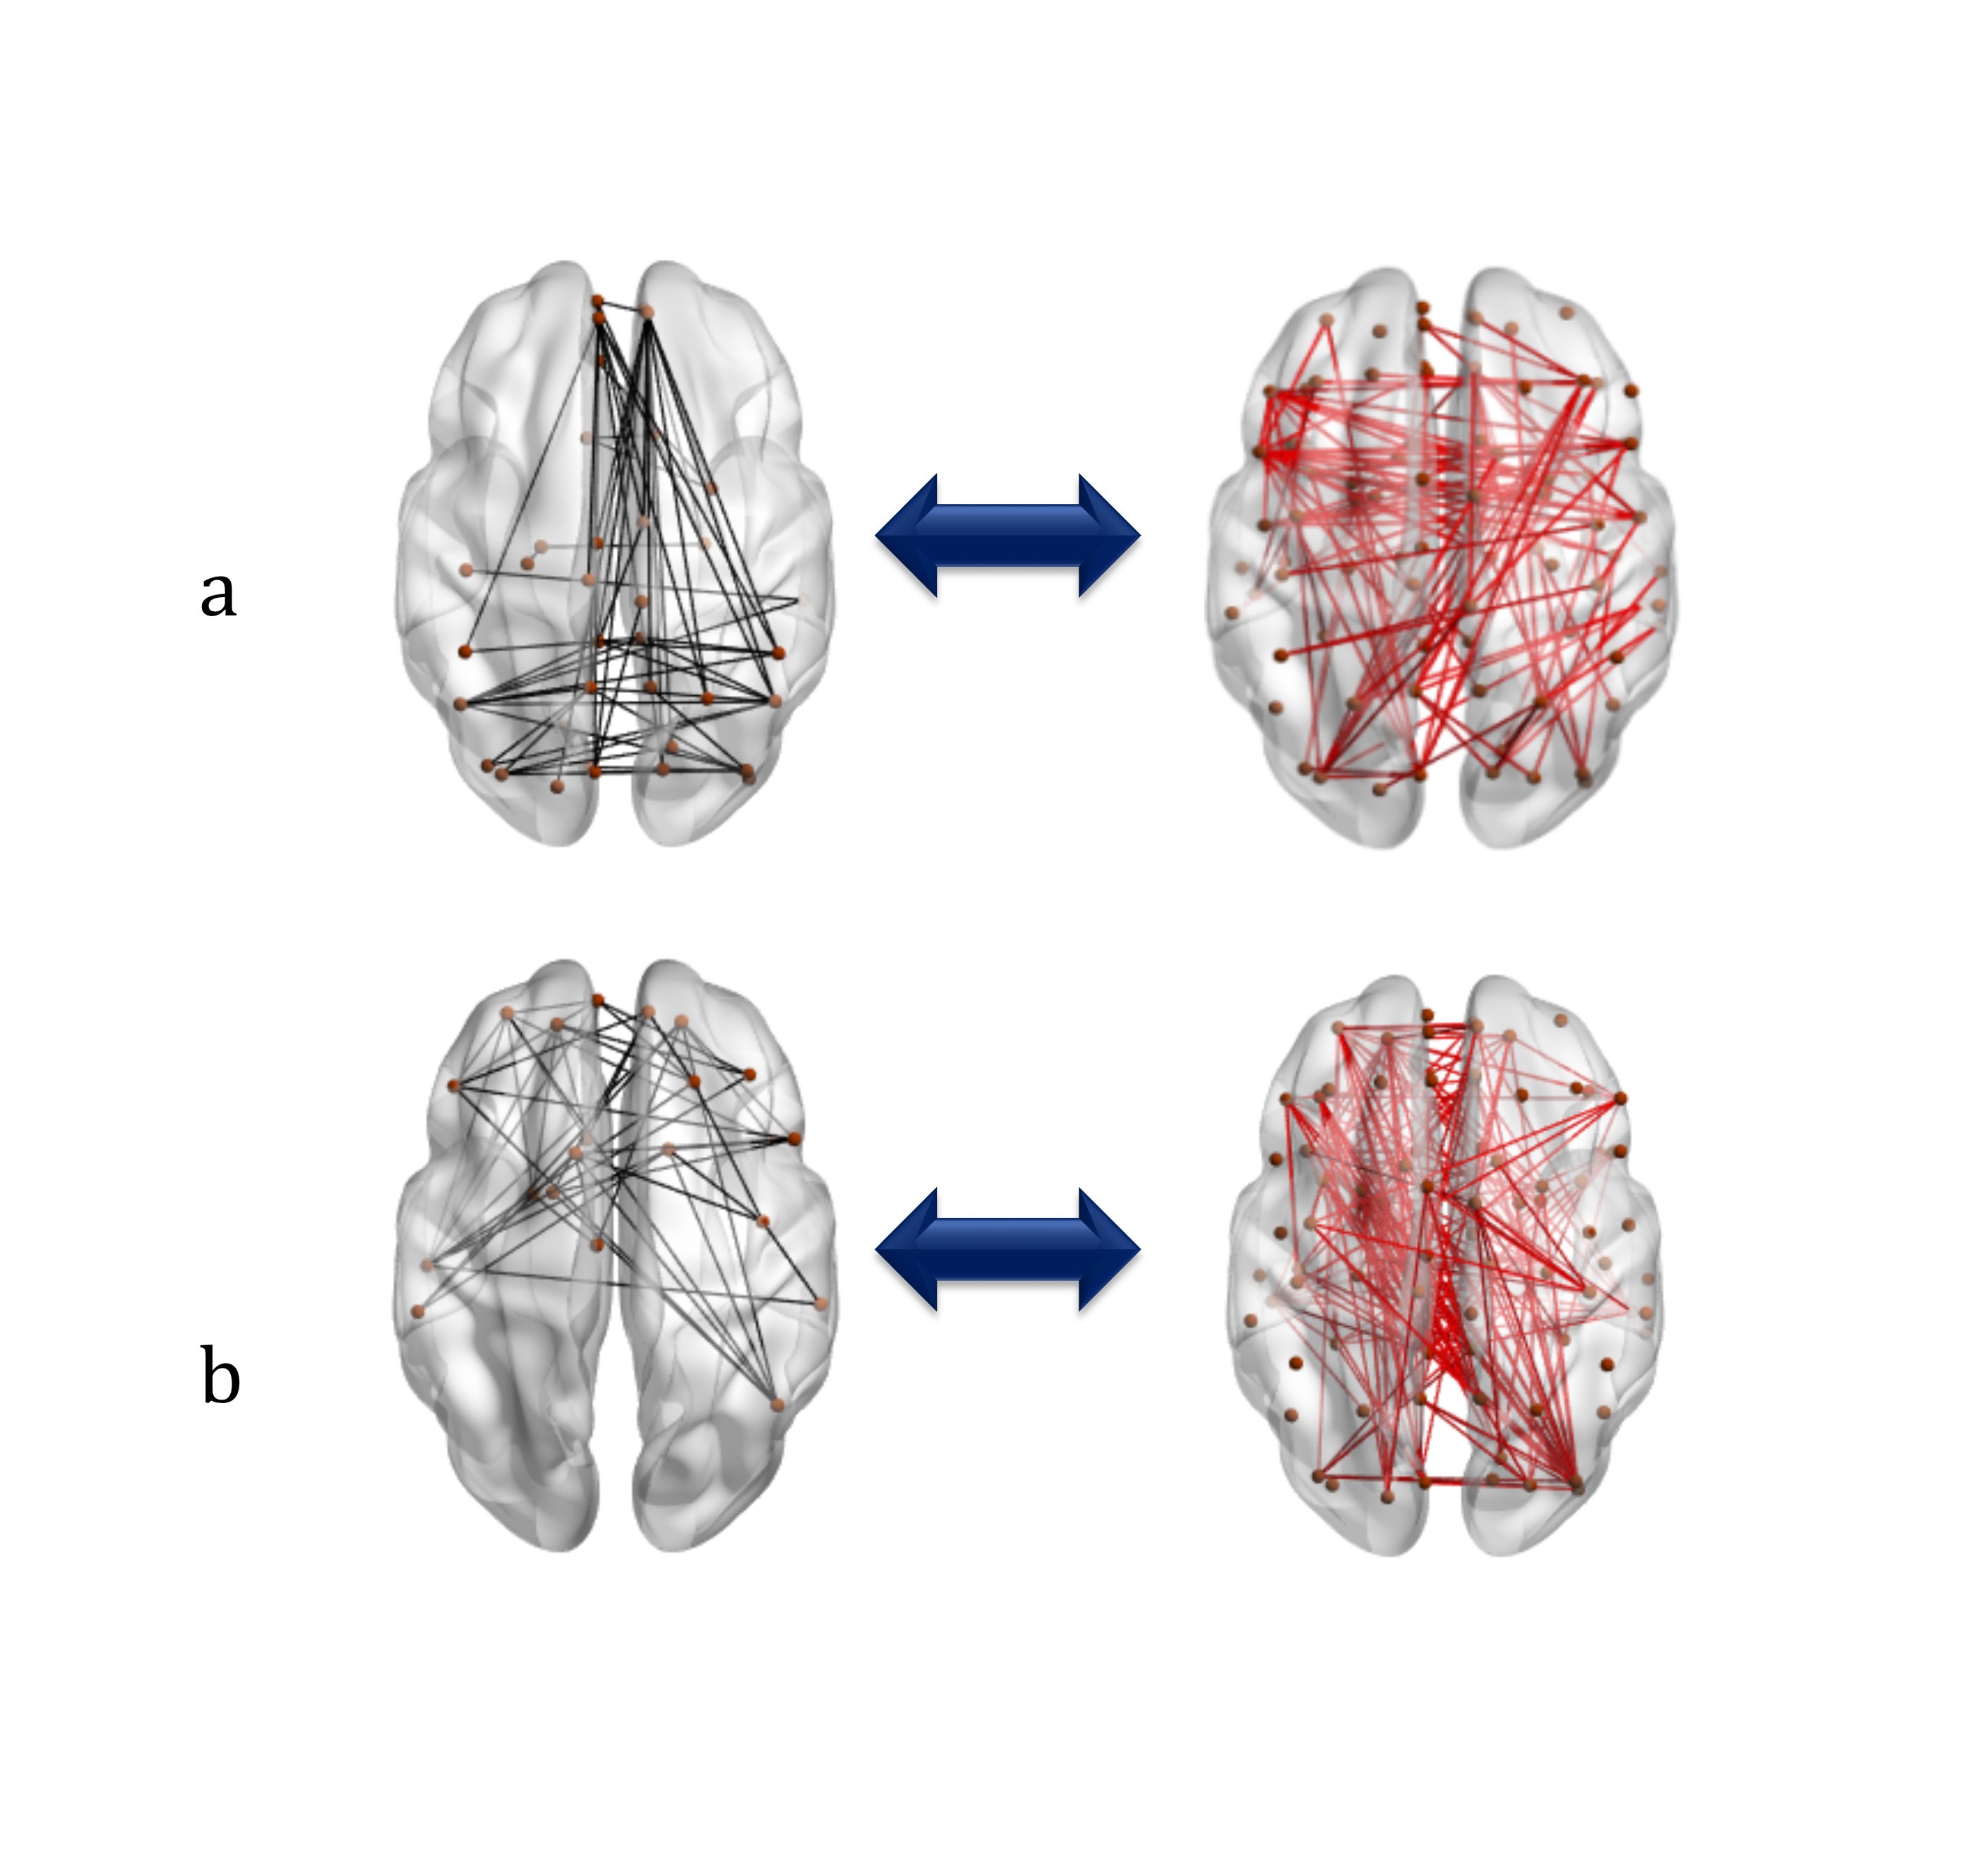
Among eight FC-SC related components, two associated
networks were selected based on their functional part of components. Fig.2 represents
the results. FC and SC are shown in black and red color respectively. One
functional network, shown in Fig.2-a along with its structural counterpart, include
connectivity between medial prefrontal cortex, posterior cingulate cortex and
precuneus. This network is closely matched
to Default Mode Network (DMN). The
functional network of second component captured connectivity of frontotemporal
network encompassing connectivity like medial orbitofrontal cortex, inferior
frontal gyrus and superior temporal gyrus as well. Subsequently, the corresponding
structural subnetworks of each functional networks are presented in the left
image.Discussion and Conclusion
Two functional networks and
their corresponding structural subnetworks were reported here. Finding of
functional networks closely in agreement with DMN and frontotemporal networks, delineates
the capability of the proposed method to identify network level relationship in
brain. In this study, we have extended a data driven approach to investigate structure-function
relationship. In comparison with other multimodal fusion methods which exert
voxel based analysis, our proposed Graph-jICA enables us to examine network
level analysis rather than voxel based fusion. This approach may lead to
further findings about prediction of function from structural connectivity.Acknowledgements
No acknowledgement found.References
[1] J. Sui, T. Adali, Q. Yu, J. Chen, and V. D. Calhoun, “A review of multivariate methods for multimodal fusion of brain imaging data,” J. Neurosci. Methods, vol. 204, no. 1, pp. 68–81, 2012.
[2] B. Park, D. S. Kim, and H. J. Park, “Graph independent component analysis reveals repertoires of intrinsic network components in the human brain,” PLoS One, vol. 9, no. 1, pp. 1–10, 2014.
[3] A. J. Bell and T. J. Sejnowski, “An Information-Maximization Approach to Blind Separation and Blind Deconvolution,” Neural Comput., vol. 7, no. 6, pp. 1129–1159, 1995.
[4] Z. Yang, S. LaConte, X. Weng, and X. Hu, “Ranking and averaging independent component analysis by reproducibility (RAICAR).,” Hum. Brain Mapp., vol. 29, no. 6, pp. 711–25, 2008.
[5] B. Mišic, R. F. Betzel, M. A. de Reus, M. P. van den Heuvel, M. G. Berman, A. R. McIntosh, and O. Sporns, “Network-Level Structure-Function Relationships in Human Neocortex,” Cereb. Cortex, no. April, p. bhw089, 2016.
Figures