5371
On the feasibility of estimating functional connectivity from hypercapnia BOLD MRI data1The Russell H. Morgan Department of Radiology, Johns Hopkins School of Medicine, Baltimore, MD, United States, 2Department of Biomedical Engineering, Johns Hopkins School of Medicine, Baltimore, MD, United States, 3Center for Vital Longevity and School of Behavioral and Brain Sciences, University of Texas at Dallas, Dallas, Texas, Dallas, TX, United States, 4Department of Psychiatry, University of Texas Southwestern Medical Center, Dallas, TX, United States
Synopsis
Resting-state fMRI, particular based on Blood-Oxygenation-Level-Dependent (BOLD) signal, has been extensively used to measure functional connectivity (FC) in the brain. A recent report proposed that FC can also be evaluated from hypercapnia BOLD image. In this work, we aim to systematically compare FC derived from hypercapnia BOLD data with those obtained from traditional resting-state BOLD data in a large cohort (170 healthy participants). Our results suggest that the hypercapnia and resting-state FC maps are spatially correlated across voxels, amplitude-wise correlated across subjects.
Purpose
Functional connectivity (FC) is typically estimated from resting-state fMRI. A recent report proposed that FC can also be extracted from BOLD data collected under hypercapnia challenge, after regressing out the CO2 effects on BOLD signal and subjecting the residual BOLD time-course data to conventional FC analyses1. If validated, this approach would provide a time-efficient method to obtain multiple vascular and neural measures in a single scan. Furthermore, simultaneous, registration-free measurements of vascular and neural indices may lay the foundation of potential calibration/normalization of BOLD-based FC results using vascular measures. However, the previous report did not provide a systematic validation of the hypercapnia-FC with resting-state-FC results. Therefore, in the present study, we conducted a validation study in a large cohort of 170 healthy subjects ranging from 20-89 years old.Methods
A total of 170 healthy adult subjects (50.7±19.6 years old, 64 males and 106 females) were studied on a 3 Tesla MRI system (Philips)2 . Informed consent was obtained using IRB-approved protocol. The hypercapnia scan consisted of interleaved breathing of room-air and CO2-enriched air (5% CO2,21% O2, and 74% N2) in 1-minute blocks for 9 minutes, while BOLD images (TR/TE/flip angle=2000 ms/25ms/80°, voxel size 3.4x3.4x3.5mm) were acquired. A traditional resting-state BOLD scan was also performed using identical BOLD imaging parameters, with a scan duration of 5.2 minutes.
The data analysis was conducted using SPM and in-house MATLAB scripts3. Resting-state and hypercapnia fMRI preprocessing steps included: realignment of BOLD images to their respective first volume within each scan. The BOLD images were then normalized to the image template of Montreal Neurological Institute (MNI) via T1-weighted high resolution anatomic image. Finally, the BOLD images were spatially smoothed using a Gaussian filter with a full-width half-maximum of 4mm.
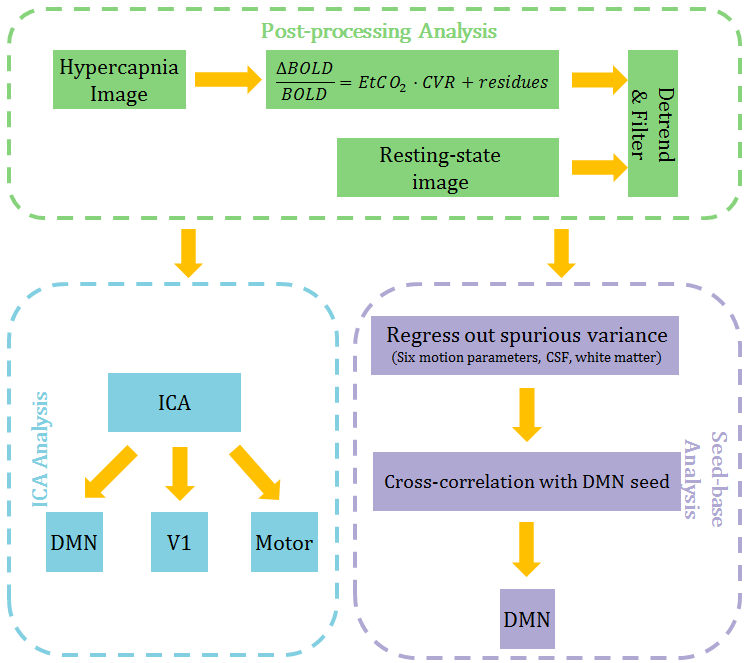
The post-processing followed the steps outlined in Fig. 1. Briefly, the CO2 effect on BOLD time-course in the hypercapnia data was factored out through General Linear Regression using end-tidal CO2 time-course. All data were temporally band-pass filtered and detrended. We performed ICA analysis4 to identify DMN, V1, motor network and calculated voxel-wise spatial correlation between the resting-state and hypercapnia derived maps. For seed-based analysis5 , we examined the inter-subject cross-correlation of the two methods for several regions in DMN, including Prefrontal Cortex (PFC), Posterior Cingulate (PCC), Left Angular Gyrus (LAG), Right Angular Gyrus (RAG). Additionally, we examined the age related differences in FC using both methods.
Results & Discussion
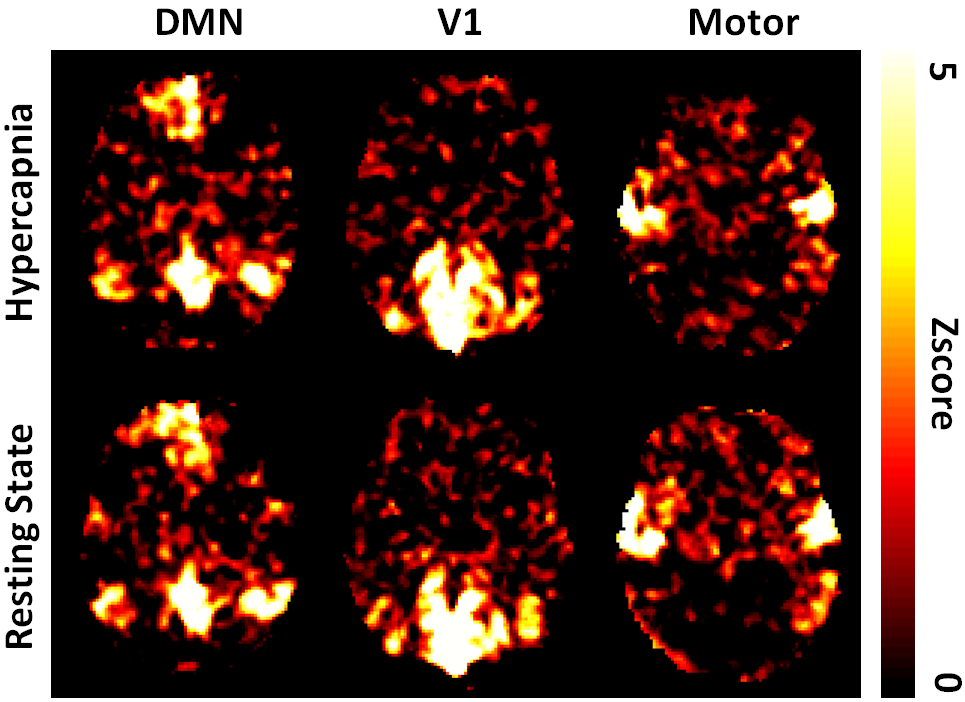
Fig. 2 shows examples of DMN, V1, and motor network estimated from resting-state and hypercapnia BOLD data, which revealed that the patterns of these two sets of results are generally consistent. Voxel-wise spatial correlation between the maps was found to be 0.34±0.17 (N=170, mean±SD), 0.35±0.18, and 0.26±0.15 for DMN, V1, and motor network, respectively.
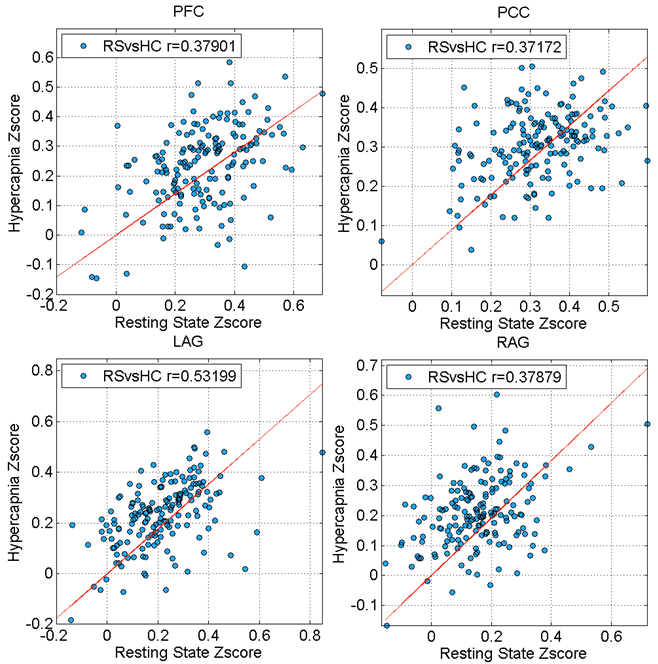
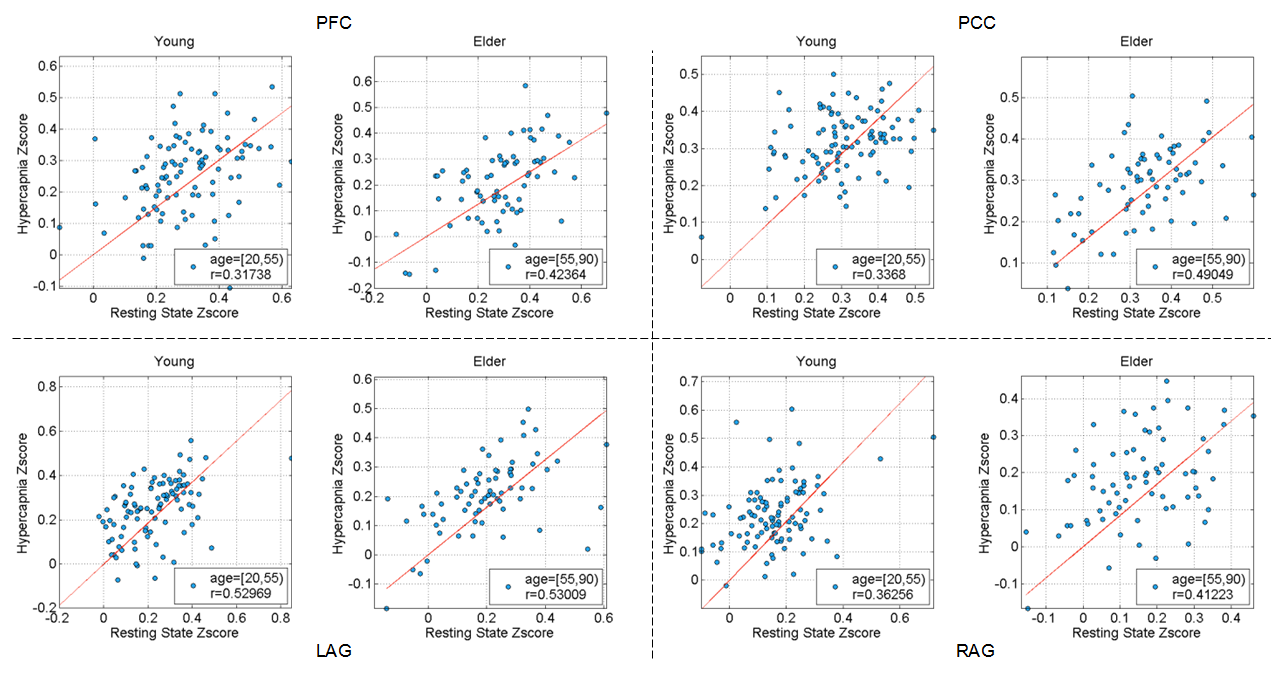
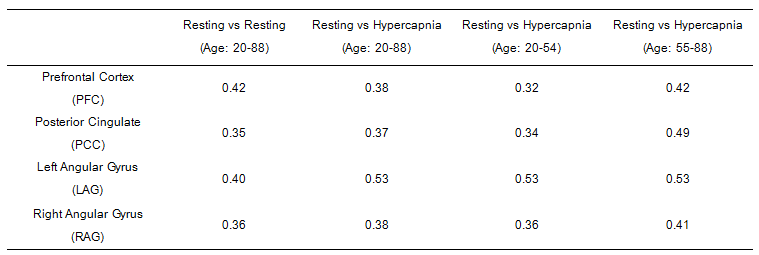
Fig. 3 depicts correlation between quantitative z-scores from the resting-state and hypercapnia datasets. Each symbol represents data from one subject. A significant correlation is seen in all regions examined. To interpret these correlation values in the context of normal variations across resting-state fMRI data, we also examined such correlations between two halves of the resting-state data. The correlation values are summarized in Table 1. It can be seen that the resting-vs-hypercapnia correlation is similar or slightly higher than the resting-vs-resting data (although one needs to keep in mind that the resting-resting comparison was based on half-length data). When splitting the 170 participants into two age groups (younger: 20-54 years; elder 55-88 years), the resting-vs-hypercapnia correlation was present in both age groups, but slightly higher in the elder group (Table 1).
Examination of z-score as a function of age suggested that PFC-PCC6 showed an age-related reduction in connectivity (Fig. 4). This effect has a p value of 0.01 and 0.08 for hypercapnia and resting-state data, respectively. PCC connections to LAG (p=0.02) and RAG (p=0.01) were also found to reduce with age from the hypercapnia data, but not from the resting-state data.
Conclusion
In this work, we conducted a systematic comparison of FC derived from hypercapnia BOLD data with those obtained from traditional resting-state BOLD data in a large cohort of 170 healthy participants. Our results suggested that the hypercapnia and resting-state FC maps were spatially correlated across voxels, amplitude-wise correlated across subjects, and the correlations were observed for both younger and elder groups. Hypercapnia BOLD MRI data allows simultaneous estimation of FC and vascular properties, which may benefit the interpretation of FC data in the context of vascular function.Acknowledgements
No acknowledgement found.References
1. Liu, P., et al, Multiparametric imaging of brain hemodynamics and function using gas-inhalation MRI. Neuroimage, In-press. 2016
2. Xu, F., et al, The influence of carbon dioxide on brain activity and metabolism in conscious humans. Journal of Cerebral Blood Flow & Metabolism. 2011
3. Liu, P., et al. A comparison of physiologic modulators of fMRI signals. Human brain mapping. 2013
4. Joel, Suresh E., et al. On the relationship between seed-based and ICA-based measures of functional connectivity. Magnetic Resonance in Medicine. 2011
5. Fox, Michael D., et al. The human brain is intrinsically organized into dynamic, anticorrelated functional networks. Proceedings of the National Academy of Sciences of the United States of America. 2005
6. Li, Karl, et al. Progressive Bidirectional Age-Related Changes in Default Mode Network Effective Connectivity Across Six Decades. Frontiers in Aging Neuroscience. 2016
Figures