5368
Top-down modulation in a directed sensory attention task1Sir Peter Mansfield Imaging Centre, School of Physics and Astronomy, University of Nottingham, Nottingham, United Kingdom, 2Centre for Human Brain Health (CHBH), University of Birmingham, Birmingham, United Kingdom
Synopsis
Attentional top-down effects are known to modulate responses when spatially directing attention within sensory modality. The directing of attention between sensory modality is less well understood. Here we present fMRI data using a Posner type attention paradigm between sensory areas (visual and somatosensory). We show that the visual, somatosensory and IPS regions are recruited during attention periods, with some of these areas modulated by degree of attention. Additional IPS regions were modulated strongly with attention recruitment. This paradigm presents top-down influence on cortical regions, allowing the study of the top-down influences of attention switching between sensory modalities.
Purpose
Although the brain’s passive response to primary sensory stimulation is robust, subject attention can significantly enhance or reduce these low-level responses [1]. Top-down modulation has been demonstrated in visual [1] and somatosensory [2] paradigms using functional MRI (fMRI). However as responses may be due to the combined influence of bottom-up (i.e. subtle changes in the stimulus input) and top-down processes, obtaining a precise understanding these mechanisms can be challenging [3]. We developed a novel paradigm to investigate 7T fMRI response modulation to varying degrees of cued attention between the visual and somatosensory domains.Methods
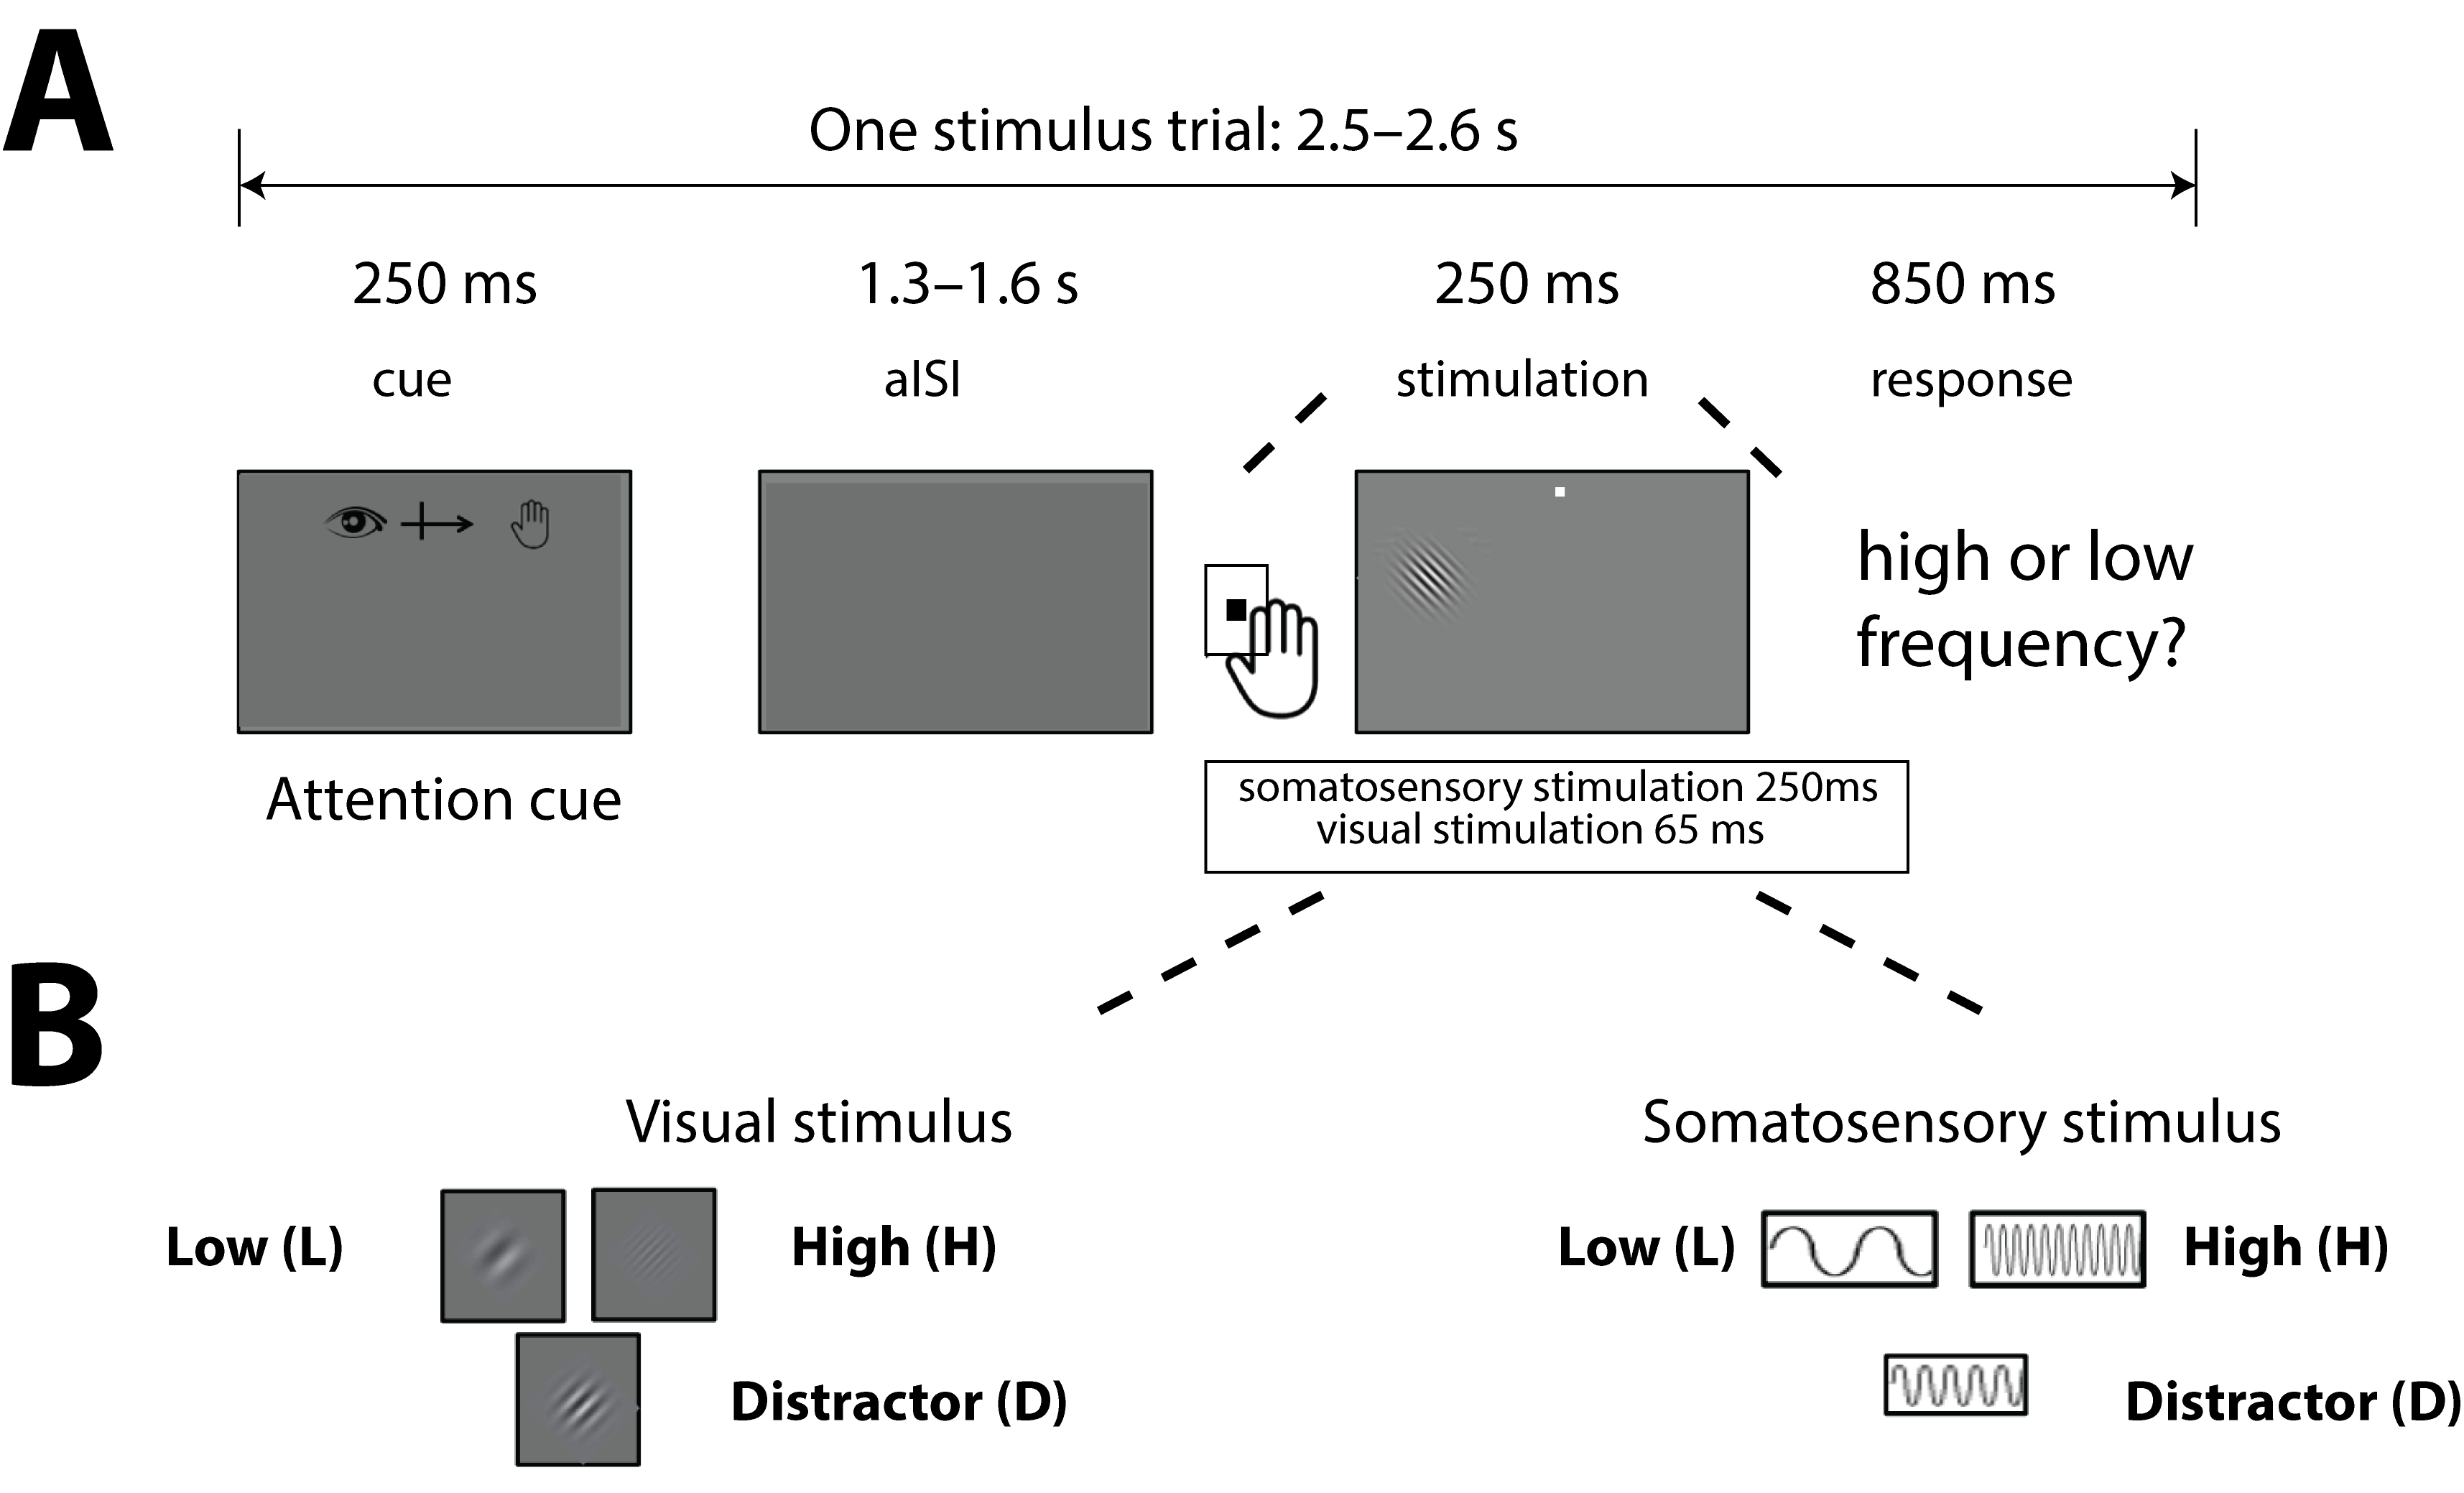
We employed a variant of the Posner paradigm [4] as shown in Figure 1. Subjects fixated on a central dot while target stimuli were presented in either the visual or somatosensory domain. Subjects reported (with a button press) whether target stimuli were of high or low frequency whilst non-target stimuli (middle frequency) were presented in the other sensory domain. A 250ms cue period indicated to subjects the probability (0, 40, 60, 100%) of the target appearing in the visual domain, thus subjects’ modulated their attention between visual (V) and somatosensory (S) domains. In one fMRI run, 25 trial blocks of the four conditions (S/V 100/0, 60/40, 40/60, 0/100) were presented in a random order, with four runs acquired per subject.
Data acquisition
GE-EPI fMRI data were acquired on 7 healthy subjects using a simultaneous multi-slice (SMS) protocol on a 7T Philips Achieva (TR/TE=1900/32ms, 1.5 mm3 resolution, multiband factor 2, 58 slices covering visual and somatosensory cortices, 210 volumes per run). Respiratory and cardiac traces were acquired for physiological correction. For each subject, a PSIR anatomical image (0.7 mm3, 98 slices, TI= 785/2685 ms) was acquired.
Data analysis
fMRI data were physiological-noise corrected using RETROICOR [5], re-aligned (within and between runs/subject), co-registered to anatomical images, normalized to MNI space [SPM12 (www.fil.ion.ucl.ac.uk/spm/)] and spatially smoothed (4.5 mm). A GLM was created with 4 regressors for each of the attentional conditions formed from a boxcar of aISI periods convolved with a HRF. Results were grouped across runs and subjects in a second level fixed effects analysis. First the ‘main effect of task’ conditions was assessed. Second, to analyze the modulation by attention, a linear regression was fit to the beta weights derived from the GLM for each condition, masked by areas activated by the ‘main effect of task’ conditions. Further analysis at the individual subject level was restricted to the visual stream and intraparietal sulcus (IPS) (i.e. small volume corrected) to where modulatory attentional effects were hypothesized to occur. PSIR data were segmented to determine grey matter using Freesurfer (http://freesurfer.net) for subsequent display of activation on surface representations.
Results
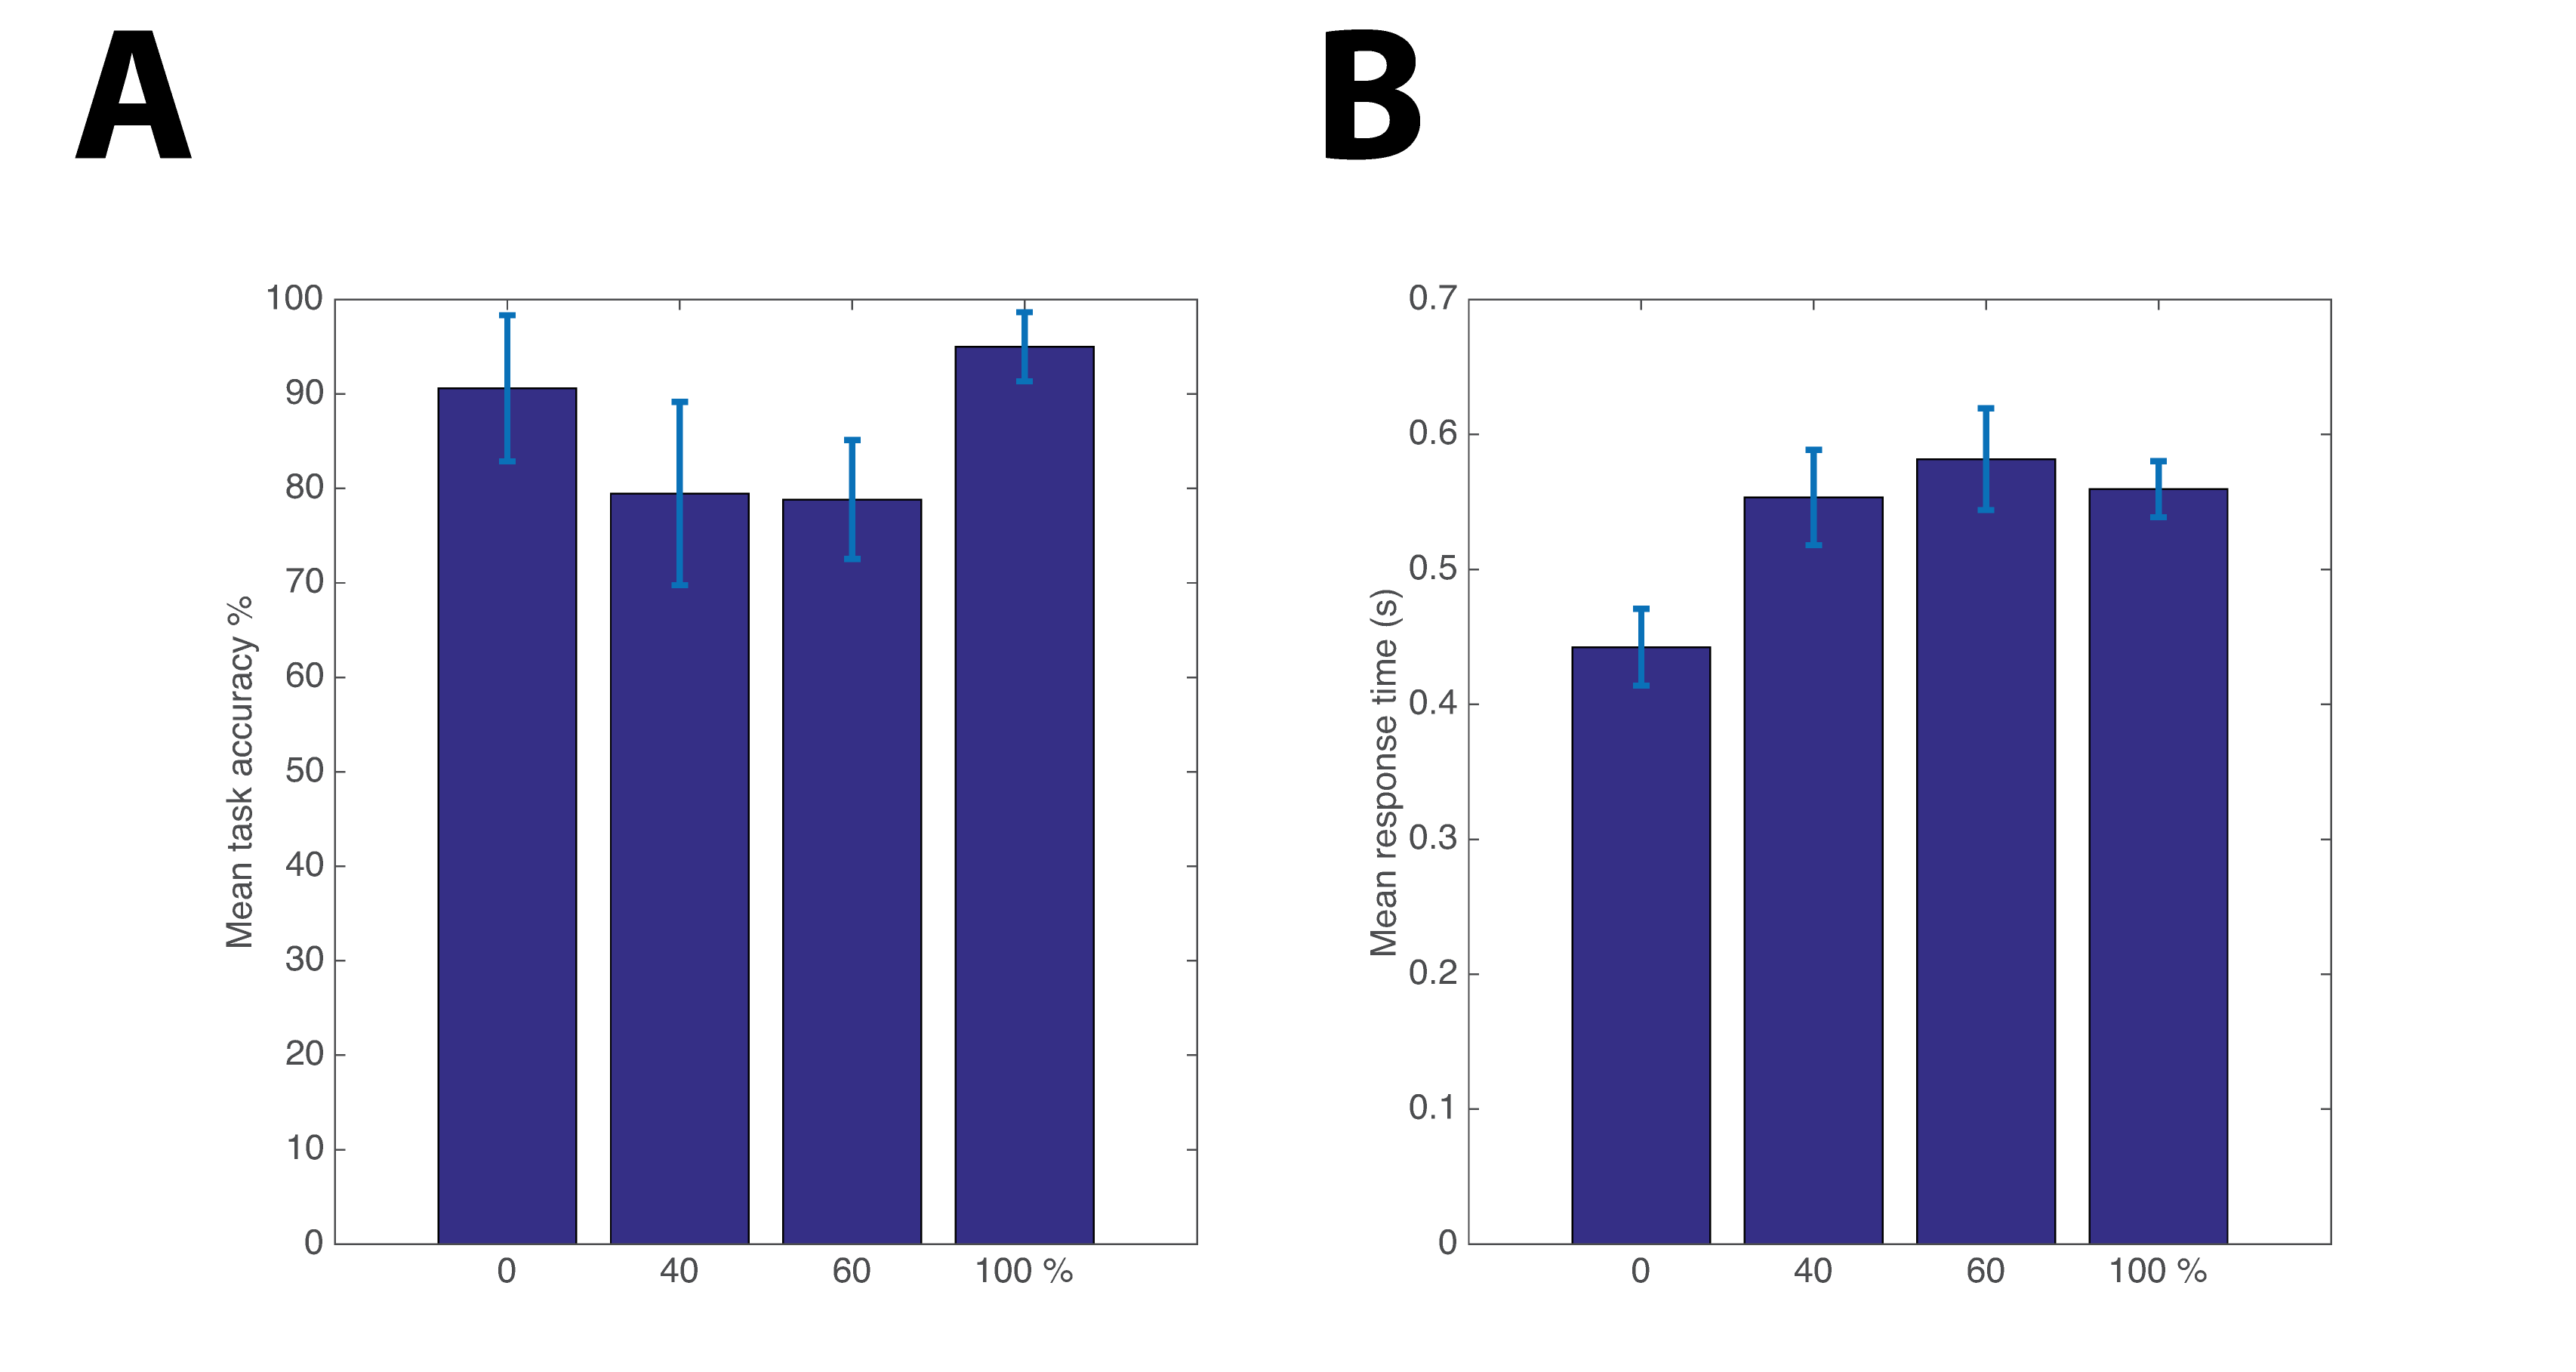
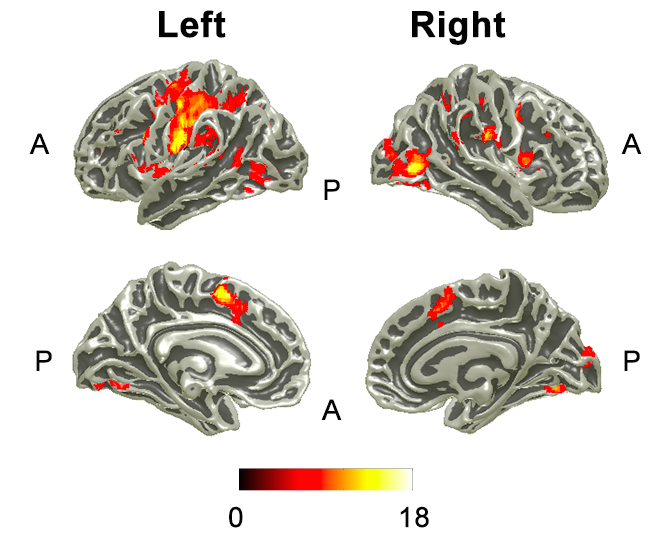
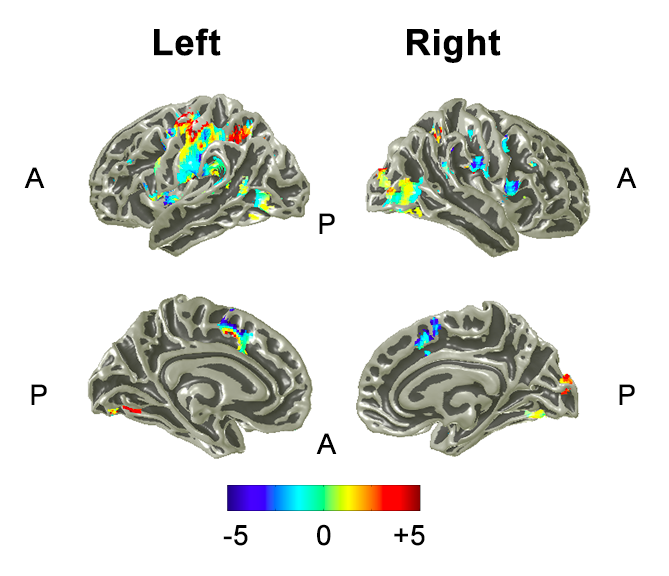
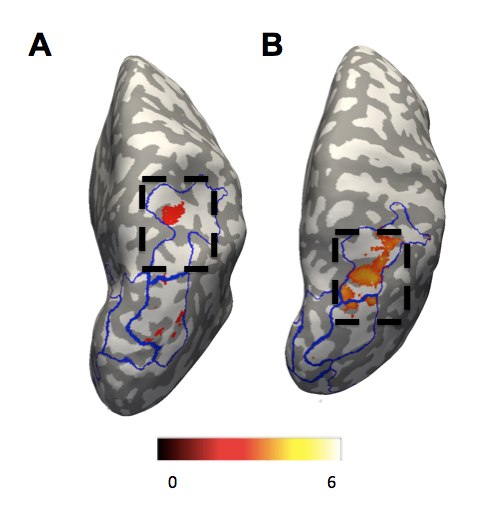
Behaviorally, subjects had the highest accuracy for a single attention condition (S/V: 0/100, 100/0) and the lowest when dividing attention (S/V: 40/60 60/40), Fig. 2A. Subjects’ response time was increased as subjects directed their attention to the visual stimulus, Fig. 2B. The group main effect to the task showed significant (p<0.05 FWE) activity over those sensory areas between which attention was directed to; right primary visual cortex (V1) and secondary somatosensory cortex (S2), and higher order areas in the visual stream of V2, V3 and IPS, as shown in Fig.3. The left motor cortex was also activated in response to the button press. Figure 4 shows those areas displaying a modulation of directed attention effects and the gradient (denoted by amplitude) of this sensory modulation across conditions. The visual stream generally shows positive modulations, whereas the sensorimotor areas show the inverse modulation, in line with attentional division. In addition, in 4 of 7 subjects a significant linear modulation was observed within the visual stream system (Fig. 5) in an area outside of the IPS region active in response to the ‘main effect of task’.Discussion and Conclusions
These results demonstrate directed sensory attention paradigm which modulates the BOLD activity in two sensory processing streams. When restricting analyses (i.e. a small volume correction) to the visual stream on an individual subject level, IPS is linearly modulated by attention (Figure 5) in 4 out of the 7 subjects, in line with the evidence that IPS is engaged in controlling attentional modulation [6]. This attentional paradigm presents top-down influence on cortical regions and thus can be used as a robust paradigm to probe the relative infra-/supra-granular contributions with high-resolution layer-specific fMRI.Acknowledgements
Leverhulme trust supported this work.References
[1] McMains, Stephanie, and Sabine Kastner. "Interactions of top-down and bottom-up mechanisms in human visual cortex." The Journal of Neuroscience 31(2) (2011): 587-597.
[2] Johansen-Berg, H., Christensen, V., Woolrich, M., & Matthews, P. M. (2000). Attention to touch modulates activity in both primary and secondary somatosensory areas. Neuroreport, 11(6), 1237-1241.
[3] Beck, Diane M., and Sabine Kastner. "Top-down and bottom-up mechanisms in biasing competition in the human brain." Vision research 49, no. 10 (2009): 1154-1165.
[4] Posner, Michael I., and Yoav Cohen. "Components of visual orienting." Attention and performance X: Control of language processes 32 (1984): 531-556.
[5] Glover, Gary H., Tie-Qiang Li, and David Ress. "Image-based method for retrospective correction of physiological motion effects in fMRI: RETROICOR." Magnetic resonance in medicine 44, no. 1 (2000): 162-167.
[6] Bressler, Steven L., Wei Tang, Chad M. Sylvester, Gordon L. Shulman, and Maurizio Corbetta. "Top-down control of human visual cortex by frontal and parietal cortex in anticipatory visual spatial attention." The Journal of neuroscience 28, no. 40 (2008): 10056-10061.
Figures