5367
Evidence of modulation of laminar profiles by contextual modulation in V1 using high-resolution fMRI1Department of Psychology, University of Minnesota, Minneapolis, MN, United States, 2Department of Psychology, University of Washington, Seattle, WA, United States, 3Office of the Associate Dean for Research, University of Minnesota, Minneapolis, MN, United States, 4Department of Neuroscience, University of Minnesota, Minneapolis, MN, United States
Synopsis
We characterized depth-dependent laminar profiles of surround suppression in human early visual cortex with high-resolution 7T fMRI. In a block-design participants viewed circular target stimuli (gratings defined by sinusoidal luminance modulation) surrounded by an annulus with a grating either parallel or orthogonal to the target grating. The surround was placed either adjacent to the target grating (Near) or separated from the target by 2° of visual angle (Far). Results show a similar activation profile for Parallel and Orthogonal conditions in the Far condition across depth. For the Near condition, contextual modulation occurred more in deep, rather than superficial layers.
Introduction
The high-resolution fMRI signal varies across cortical depth1-3, but the extent to which these variations correspond to known electrophysiological data has yet to be fully explored. When a target stimulus is enclosed by a similarly-patterned surround, early visual responses are suppressed. The strength of the suppression varies according to the distance of the surround from the target as well as the correspondence of the surround’s visual characteristics to the target characteristics. Specifically, electrophysiological evidence gathered from nonhuman primates show that near-surround suppression is more sharply modulated by different orientations than far-surround suppression4. Further, this modulation occurs more in superficial layers than in deep layers. In this experiment we use high-resolution fMRI to describe laminar profiles in human subjects that reflect the contextual modulation of neural responses.Method
Data acquisition
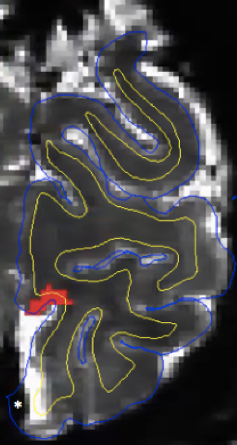
Five healthy adult subjects were studied with a 7T Siemens scanner with AC84 head gradient insert and a custom-made 9-channel receive, 4-channel transmit head coil5. Functional data were acquired with 0.8 mm isotropic T2-weighted EPI images (FOV = 192 x 144 mm; R=2; echo-spacing = 0.78). T1-weighted anatomical data were acquired in a separate scanning session. Cortical grey matter segmentation was calculated in Freesurfer. Functional data were motion-corrected and registered to anatomical data using AFNI. Only responses in regions of interest in which registration accuracy was verified by visual inspection (Fig. 1), were analyzed.
Experimental design
Responses to target stimuli were measured during 12 block-design scans. Stimulus and rest blocks were 12 sec; 4 stimulus conditions (targets with Near/Far x Parallel/Orthogonal surrounds) were repeated 5 times in each scan and randomly interleaved, including 6 rest blocks. The target stimuli were circular sinusoidal gratings with a diameter of 1.5° of visual angle. These targets were positioned at 3° eccentricity slightly below the horizontal meridian. The targets were surrounded by an annular grating (width = 2°) positioned either immediately adjacent to the central target (Near condition) or separate from the central target (Far condition, Fig. 2) by 2° of visual angle. These surrounds were composed of a sinusoidal grating either parallel to or orthogonal to the target grating. Both target and surround gratings had a 2 cycle/degree carrier frequency and flickered at 4 Hz.
Data pre-processing
Data were motion- and distortion- compensated using phase-encode-reversed EPI acquisitions to estimate susceptibility-induced distortions. After registration of unwarped data to MP-RAGE reference anatomy, an additional non-linear warping step was computed to remove residual distortions. Transformation matrices from all three processing steps were combined so data were only resampled once.
Data analysis
Regions of interest were identified by a set of four independent localizer scans that contrasted the target location with the near surround grating location at random orientations in a block design. Regression analysis (GLM) assessed fMRI response modulation (percent signal change) for four stimulus conditions in each voxel. Functional voxels were then sorted into seven depth bins based on registration to cortical segmentation in reference anatomy. The bins were evenly distributed from 20% below the FreeSurfer white matter (WM) surface to 20% above the FreeSurfer gray matter (GM) surface. The bottom and top bins were discarded, as they represented WM and pial surface responses, and the average beta weight (percent signal change) for all voxels in the five remaining bins was computed for each condition in each subject. As an equi-volume solution6 was not used to define cortical depth, the location of middle layers cannot be accurately assessed for the regions of high cortical curvature considered in the analysis; thus, results are only considered in terms of superficial and deep layers.
Results
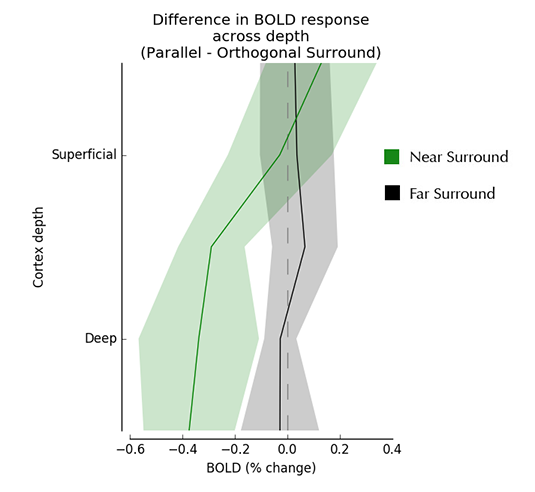
We characterized orientation dependence of surround suppression in the Near and Far conditions by calculating the difference in BOLD activation in the parallel and orthogonal conditions across depth. There was little difference in BOLD activation across depth in the Far condition; in the Near condition, greatest orientation dependence was observed in deep layers (Fig. 3).Discussion and Conclusion
Electrophysiological data from nonhuman primates show greater orientation dependence for Near surround suppression4, which is consistent with our data. In this study the difference in BOLD activation in the Near condition was strongest in deep layers, conflicting with electrophysiology data showing the strongest modulation in superficial layers. This discrepancy may be driven by the fact that electrophysiology data only report the responses of neurons being stimulated at their preferred orientation, while fMRI data pool across a diverse population, but further experimentation is necessary to account for this discrepancy in laminar profiles of surround suppression.Acknowledgements
This work was supported by NIH R21 EY025731, P41 EB015894, P30 EY011374, P30 NS076408, S10 RR026783, W. M. Keck FoundationReferences
1. Goense J, Logothetis N. Laminar specificity in monkey V1 using high-resolution SE-fMRI. Magn Reson Imaging. 2006;24(4),381-392.
2. Koopmans P, Barth M, Norris, D. Layer-specific BOLD activation in human V1. Hum Brain Mapp. 2010;31(9),1297-1304.
3. Olman C, Harel N, Feinberg D, et al. Layer-specific fMRI reflects different neuronal computations at different depths in human V1. PloS one. 2012;7(3)e32536.
4. Shushruth S, Nurminen L, Bijanzadeh M, et al. Different orientation tuning of near-and far-surround suppression in macaque primary visual cortex mirrors their tuning in human perception. J Neurosci. 2013;33(1),106-119.
5. Adriany G, Waks M, Tramm B, et al. An open faced 4 ch. loop transmit/16 ch. receive array coil for HiRes fMRI at 7 Tesla. Proc Intl Soc Mag Reson Med. 2012.
6. Waehnert M, Dinse J, Weiss M, et al. Anatomically motivated modeling of cortical laminae. Neuroimage. 2014;93,210-220.
Figures