5350
Linear and non-linear BOLD effects in grip force execution are reproduced in observation1Department of Brain and Behavioral Sciences, University of Pavia, Pavia, Italy, 2Brain Connectivity Center, C. Mondino National Neurological Institute, Pavia, Italy, 3Department of Diagnostic Radiology, Faculty of Applied Medical Science, KAU, Jeddah, Saudi Arabia, 4UCL Institute of Neurology, Queen Square MS center, University College London, London, United Kingdom, 5UCL Institute of Neurology, Wellcome Trust Centre for Neuroimaging, University College London, United Kingdom, 6Department of Brain and Behavioral Sciences, University of Pavia, Italy, 7UCL Institute of Neurology, Queen Square MS Centre, University College London, London, United Kingdom, 8Brain MRI 3T Mondino Research Center, C. Mondino National Neurological Institute, Pavia, Italy
Synopsis
In this pilot study, we investigated whether the non-linear BOLD response to varying grip force (GF) is reproduced when observing others performing the task. We used an fMRI squeezeball paradigm with two conditions: action execution (AE - subjects performed the task) and action observation (AO - subjects watched a video of the task). In both conditions, activations were detected in areas constituting the action execution-observation network and both areas evidenced linear and non-linear relations with the GF. These results indicate that action observation calls on the same context sensitive and high level processing necessary for execution.
Introduction
Activation of the action execution-observation network (AEON) in subjects observing complex motor tasks is thought to provide a fundamental cue for imitation learning and inferring other’s intentions, providing the basis for motor training in physiological and rehabilitative conditions [1, 2]. Crucially, several motor areas activated during the execution of a motor task are activated during observation of the same task when performed by others (i.e. in the mirror system) [3, 4]. The relationship between an applied grip force (GF) and BOLD signals shows characteristic non-linearity in sensory, pre-motor, associative and visual areas and in cerebellum [5]. Using a squeezeball paradigm, we asked whether the non-linear behaviour of the BOLD response to varying GF levels is reproduced when observing others performing the task.Methods
Subjects: 8 right-handed healthy volunteers (5 females; aged 28 years (±5.42)). MRI protocol: 3T MRI (Philips Achieva) with a 32-channel head coil. Sequence parameters: 1) volumetric 3DT1; 2) GE-EPI fMRI: volumes =200, TR =2.5s, TE =35ms, voxel size =3x3x2.7mm3, FOV =192x192mm2, slices =46, flip angle =90°, total scan-time 500s. Paradigm: Event-related fMRI squeezeball task using the whole right hand [5]; duration 8.33min; 75 trials (15*5 GFs between 20% and 60% of maximum contraction; counter-balanced order). The task (right hand) performed by a female was also recorded; the video included the whole hand and forearm, on a plane background colour, palm up. Before and after the MRI session subjects underwent a behavioural session, when they watched the video and scored the perceived GF. In the MRI scanner, two randomised conditions were delivered: 1) [AE] subjects had to perform the squeezeball task themselves, while their responses were also recorded; 2) [AO] subjects watched the recorded video. Behavioural data analysis: orrelation between the real behavioural performance (recorded on video) and the subject’s perception of GF was estimated. fMRI data analysis (SPM12). fMRI data pre-processing: slice timing; realignment of volumes and re-slicing of the mean image; co-registration of the re-sliced mean image to 3DT1; normalization and smoothing of EPI volumes (8mm Gaussian kernel). A general linear model including polynomial expansions up to the 4th order was applied. The contrast images of (each of the five) polynomial coefficients were entered into a between subject analysis and tested with one sample t-tests. For the AO analysis, a similar pipeline was followed. Here, the GF levels corresponded to those observed recorded. Significant results were defined using a threshold of p<0.001 (minimum extent=10 voxels).Results
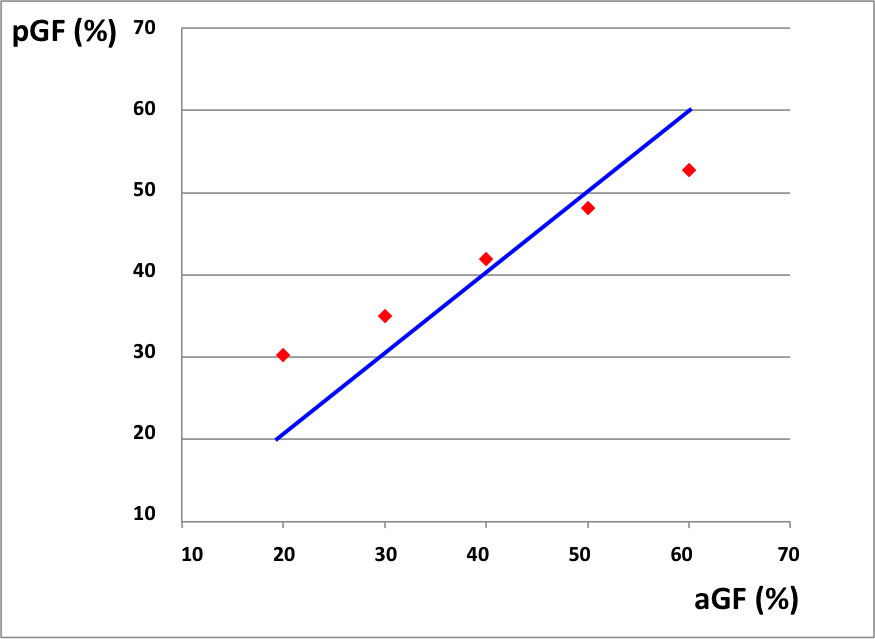
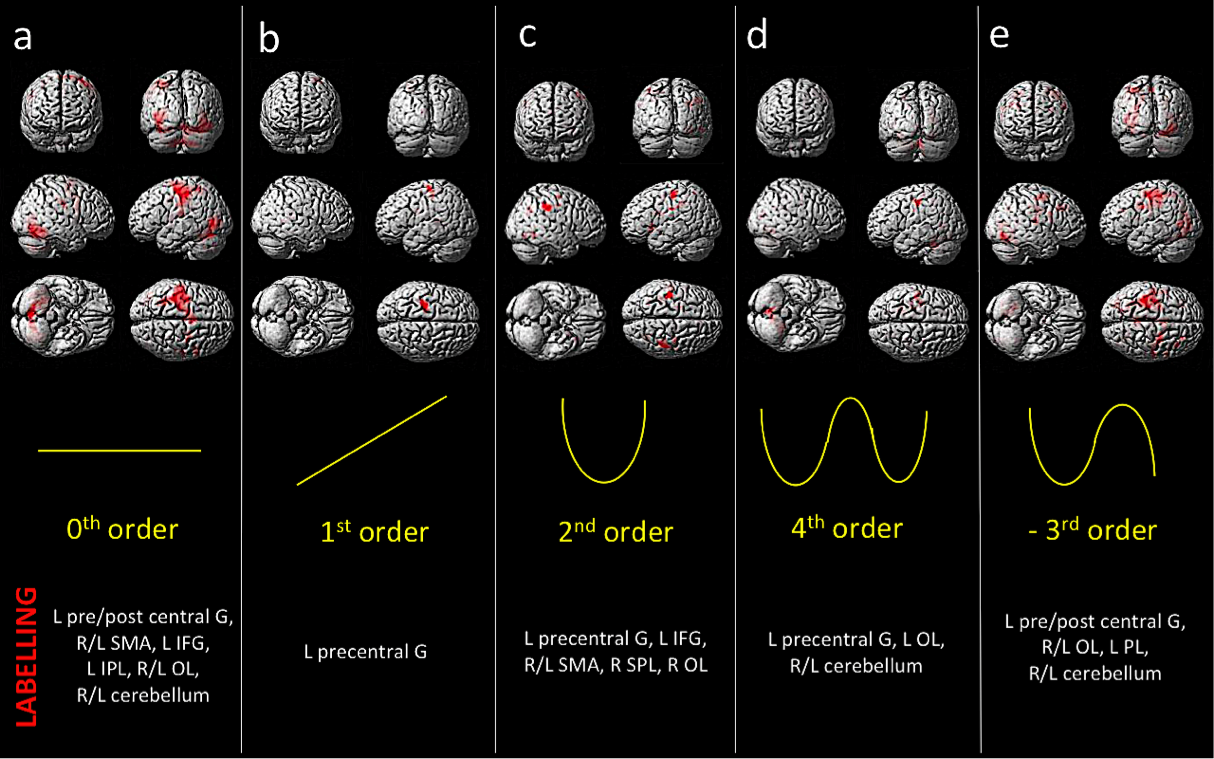
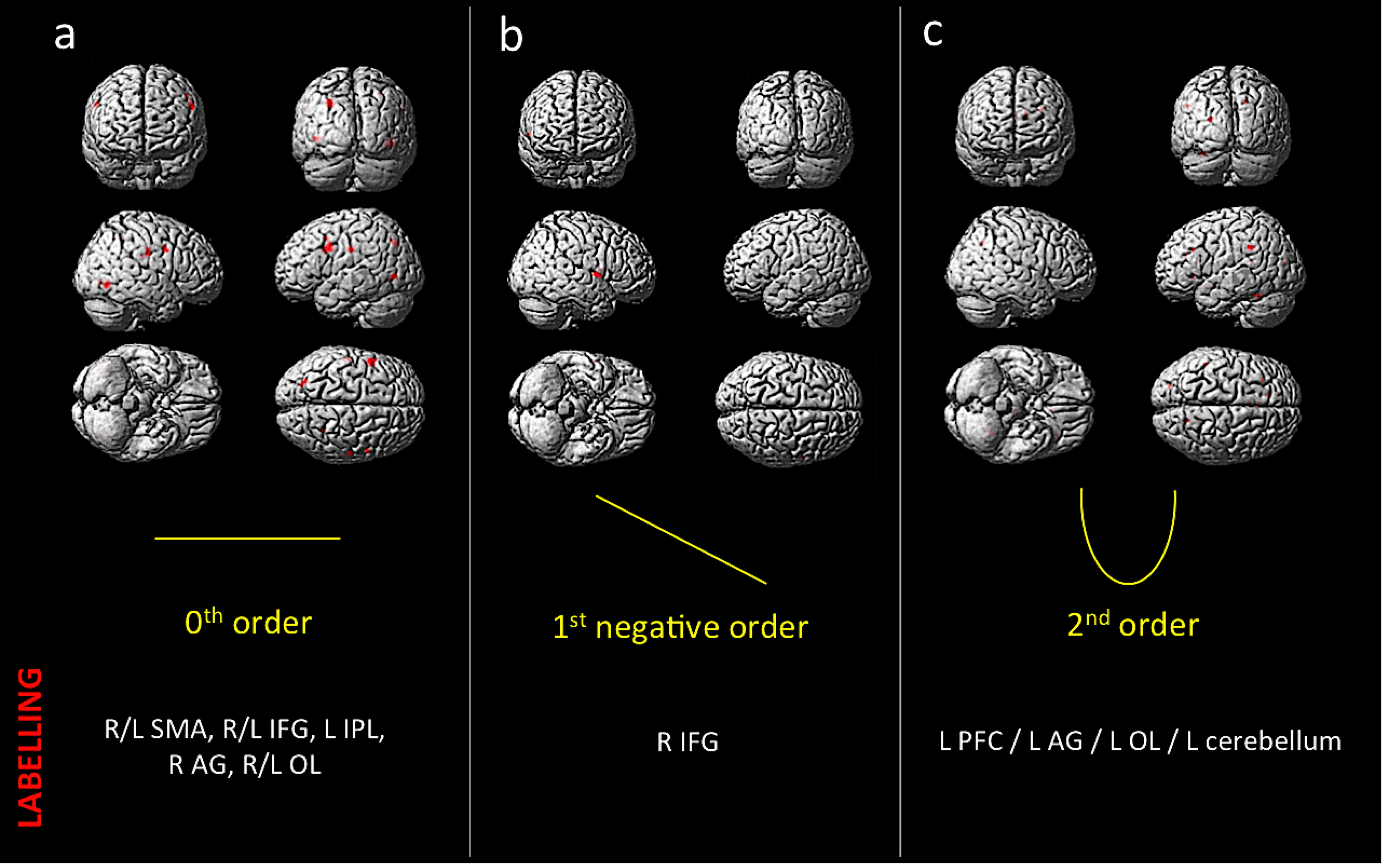
Behavioral results: Data showed a positive correlation between the applied and perceived GF (Fig.1). fMRI results: In the AE condition, activations were detected as follows: 0th order in motor, premotor and sensory cerebral and cerebellar areas (p<0.05; FWE corr); 1st order in the motor cortex (p<0.001; k=10); 2nd order in frontal, parietal and occipital lobes (p<0.001; k=10); 4th order in sensorimotor and cerebellar areas (p<0.001; k=10); -3rd order in frontal, parietal and occipital lobes as well as cerebellum (p<0.05; FWE corr) (Fig.2). In the AO condition, activations (p<0.001,k=10) in the 0th order were seen in primary sensory and secondary visual cortices, premotor and parietal cortices; -1st order in the premotor cortex; 2nd order in the prefrontal cortex, parietal and occipital lobes and in the cerebellum (Fig.3).Discussion and conclusion
Behavioral results on AO endorse the recognition of the observed GF trend. Results on AE are consistent with previously reported data [5]. AO responses were found in regions considered to be part of the AEON [3], activated irrespective of observed GF or in a negative linear relationship with GF. These areas are involved in movement preparation and visual tracking of motion. Moreover, cerebellar activity indicates a 2nd order response to the observed GF. The cerebellum is indeed involved in the early stages of motor learning [6] and neuroimaging studies demonstrate that observation of movements, imagination and motion share common substrates including the cerebellum [7,8]. These encouraging (preliminary) results, indicate that the non-linearity is likely to be due to high level processing of motor functions as it is present to a certain extent in AO as well as AE. This study contributes to understanding the functional anatomy of AO with respect to AE. The next step will be to increase the number of subjects and merge AE and AO results (via interaction and conjunction analysis) to create a parametric model of the AEON.Acknowledgements
Brain Connectivity Center (BCC) - C. Mondino National Neurological Institute, University of Pavia; NIHR BRC UCLH/UCL High Impact Initiative; UK MS Society; Functional Imaging Laboratory (FIL, University College of London, UCL); Sasha Ondobaka and Francesco Rigoli for useful discussions.References
[1] Porro, C.A., et al., 2007. Enhancement of force after action observation: behavioural and neurophysiological studies. Neuropsychologia. 45, 3114-21.
[2] Caligiore, D., et al., 2013. The contribution of brain sub-cortical loops in the expression and acquisition of action understanding abilities. Neurosci Biobehav Rev. 37, 2504-15.
[3] Gatti, R., et al., 2016. The effect of action observation/execution on mirror neuron system recruitment: an fMRI study in healthy individuals. Brain Imaging Behav.
[4] Kilner, J.M., Friston, K.J., Frith, C.D., 2007. Predictive coding: an account of the mirror neuron system. Cogn Process. 8, 159-66.
[5] Alahmadi, A.A., et al., 2016. Complex motor task associated with non-linear BOLD responses in cerebro-cortical areas and cerebellum. Brain Struct Funct. 221, 2443-58.
[6] Weaver, J., 2015. Motor Learning Unfolds over Different Timescales in Distinct Neural Systems. PLoS Biol. 13, e1002313.
[7] Decety, J., et al., 1997. Brain activity during observation of actions. Influence of action content and subject's strategy. Brain. 120 ( Pt 10), 1763-77.
[8] Grèzes, J., Decety, J., 2001. Functional anatomy of execution, mental simulation, observation, and verb generation of actions: a meta-analysis. Hum Brain Mapp. 12, 1-19.
Figures