5343
Characterization of the Gray Matter Hemodynamic Response Function with High-Resolution Functional MRI1Neuroscience, Baylor College of Medicine, Houston, TX, United States
Synopsis
Functional magnetic resonance imaging (fMRI) measures the hemodynamic response to neural activation. Brief periods (2 s) of multisensory neural stimulation evoke the hemodynamic response function (HRF) across the majority of cerebral cortex. High (2 mm) spatial resolution enables the characterization of the HRF restricted to the gray matter, avoiding partial volume effects into nearby white matter and vascular tissue. HRF amplitude and timing measurements from eight healthy subjects showed temporal stability and stereotypical spatial amplitude patterns, suggesting that this method could be adapted to diagnose pathologies associated with abnormal neurovascular coupling.
Purpose
The HRF typically consists of an initial dip or delay, a hyperoxic peak, and subsequent ringing as blood flow and oxygen metabolism respond to neural activation1. Several studies have associated various brain pathologies with changes in the HRF2-4 suggesting that measurement of the HRF could be useful diagnostic of pathology. We characterized the HRF across cerebral cortex and subjects using various timing and amplitude parameters. Previous fMRI studies showed high subject variability, which may have been due to contamination of the measurements by partial volume effects caused by their coarse (3-5 mm) spatial resolution5. Use of high spatial resolution (2 mm voxels) mitigated this effect. Also, previous experiments used very simple stimulus protocols that limited activation to small portions of cortex. In this study, a strong HRF was evoked across the majority (~76%) of the cerebral cortex by an audiovisual stimulus protocol combined with a fast-paced task. After normalization, the HRF amplitudes from healthy subjects show stereotypical spatial patterns and general timing stability.Methods
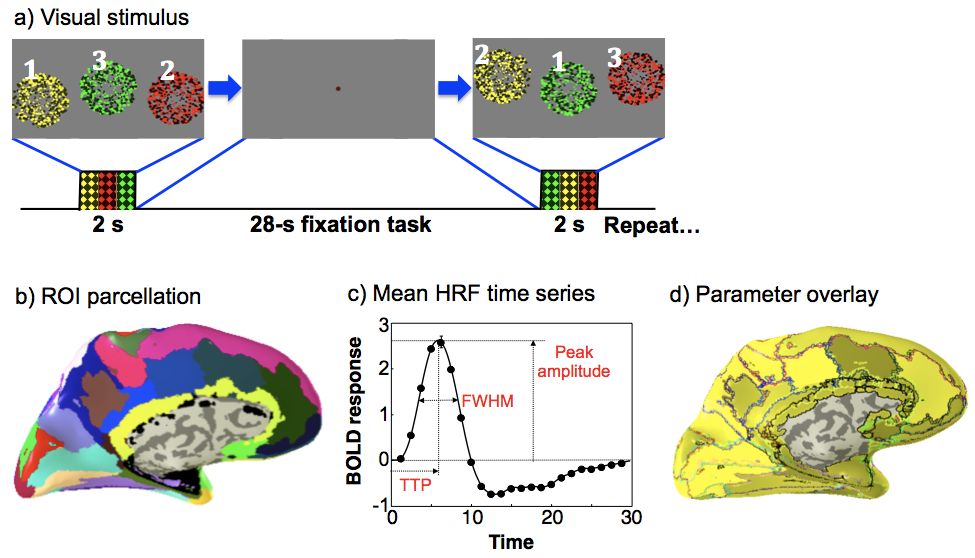
Subjects (N = 8) fixated upon a central colored dot on a display. Stimulus onset was cued by a change of dot color for 0.5 seconds before a 2-second stimulation period. Visual stimulation consisted of three round regions of randomly flickering colored dots appearing sequentially for 667 ms (Fig. 1a). Each region was colored red, yellow, or green, and had a corresponding audio stimulus of filtered white noise: a medium pitch for yellow, low pitch for red, and high pitch for green. Subjects were tasked with responding to each dot display by pressing a button that matched the color and sound presented. 16 HRF measurements were collected in each run, and 5 runs were collected per session to yield 80 measurements for each subject.
Imaging was performed on a 3T Siemens Trio scanner equipped with a 32-channel head coil. FMRI data were collected using an SMS-accelerated EPI sequence (G = 2, SMS = 3) to obtain 2-mm cubic voxels across the entire brain with TR = 1.25 s. Functional data were transformed to individual volume anatomies, collected with an MP-RAGE sequence (0.7-mm voxels) for further analysis. Each anatomy was segmented to extract the gray matter, and divided into 75 surface regions of interest (ROIs) using FreeSurfer6 (Fig. 1b). HRFs were analyzed to obtain peak amplitude, time-to-peak, and full-width-at-half-maximum (FWHM) both in individual gray-matter voxels and in ROIs. ROI HRFs corresponded to the average response across the top 50% of ROI voxels by contrast-to-noise ratio (CNR, Figs. 1c, d).
Results
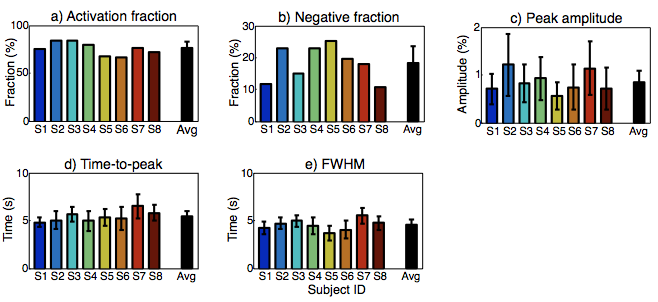
Averaged across subjects, 75.9±6.6% of cerebral cortex showed strong (CNR > 3) HRF amplitudes (Fig. 2a). Most activation was positive, but negative HRF amplitudes were observed in 18.3±5.4% of activated cortex (Fig. 2b). Amplitudes of the positive HRFs varied widely across the cortical surface and between subjects. In contrast, timing parameters of the positive HRFs exhibited far greater spatial consistency across the cortical surface and across subjects (Figs. 2c, d). Mean time-to-peak was 5.41±0.55 s; FWHM was 4.54±0.57 s.
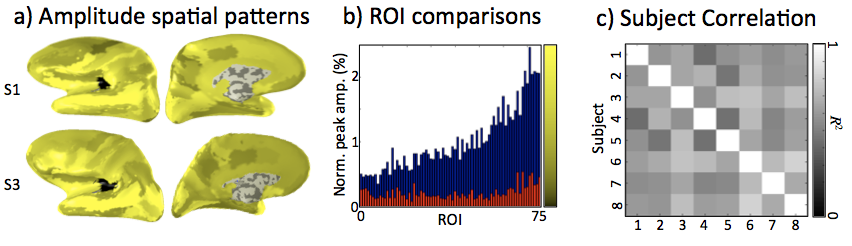
After normalization by dividing by the mean amplitude across ROIs for each subject, HRF amplitudes showed similar spatial activation patterns across subjects (Figs. 3a, b). Cross correlations (R2) between amplitude patterns across subjects confirm the consistency of spatial patterns (Fig. 3c). The mean correlation across subjects was R2 = 0.62. Similar comparisons were made for the temporal parameters. Time-to-peak measurements spatial patterns showed modest similarity across subjects (Fig. 4). Mean correlation was R2 = 0.27, notably weaker than for the amplitude distributions. This was due in part to the overall timing consistency across the cortical ROIs. Behavior of the FWHM was similar to time-to-peak.
Discussion
The simple multisensory task efficiently activated the majority of cerebral cortex showing both positive negative HRF responses. Observed peak amplitudes varied substantially across cortical regions; however, after normalization strong spatial correlations were observed between subjects. Thus, the task evoked a stereotypical spatial pattern of response when analyzed using a standardized, curvature-based parcellation scheme. Moreover, we observed general HRF temporal stability across the cortical surface. Together, these two features suggest that the stereotypical neurovascular coupling evoked by our task across the cortical surface could become an attractive diagnostic tool for clinical applications.Conclusions
Results support the use of our fMRI methods to characterize the HRF across the majority of cerebral cortex with the potential to diagnose and treat pathology that manifest changes in neurovascular coupling.Acknowledgements
Work supported by NIH R21HL108143, NSF BCS1063774, NIH R01NS095933References
1. R.B. Buxton, Dynamic models of BOLD contrast, NeuroImage 62, 953-961 (2012)
2. L.M. Carusone, et al., Hemodynamic response changes in cerebrovascular disease: implications for functional MR imaging, American Journal of Neuroradiology 23, 1222-1228 (2002)
3. R.S. Marshall, The functional relevance of cerebral hemodynamics: why blood flow matters to the injured and recovering brain. Curr Opin Neurol 17, 705-709 (2004)
4. A.C. Roc, et al., Altered hemodynamics and regional cerebral blood flow in patients with hemodynamically significant stenoses. Stroke 37, 382-387 (2006)
5. G. Aguirre, et al., The variability of human BOLD hemodynamic responses, NeuroImage 8, 360-369 (1998)
6. C. Destrieux, et al., Automatic parcellation of human cortical gyri and sulci using standard anatomical nomenclature, NeuroImage 53, 1-15 (2010)
Figures