5342
Detection of Functional Activity in Somatosensory Pathways Using Tactile Stimulations1Department of Computer Science, Chengdu University of Information Technology, Chengdu, People's Republic of China, 2Vanderbilt University Institute of Imaging Science, Nashville, TN, United States, 3Brain Institute, Vanderbilt University, Nashville, TN, United States, 4Vanderbilt Kennedy Center, Vanderbilt University, Nashville, TN, United States, 5Department of Radiology and Radiological Science, Vanderbilt University Medical School, Nashville, TN, United States, 6Department of Biomedical Engineering, Vanderbilt University, Nashville, TN, United States, 7Department of Electrical Engineering and Computer Science, Vanderbilt University, Nashville, TN, United States
Synopsis
Functional magnetic resonance imaging has been widely used in measuring functional connectivity between cortical regions, but it has not been well-established in white matter to date. While we have previously demonstrated that resting state BOLD signals exhibit structure-specific correlations, suggesting that neural activities may be encoded in white matter BOLD signals as well, in this study we further confirm that functional stimulations can induce activities in relevant white matter pathways.
Background
Functional magnetic resonance imaging is a well-established method for detecting neural activity in brain cortex on the basis of blood oxygenation level dependent (BOLD) contrast1, but detection of neural activity in white matter by fMRI has been controversial2. Recently, there has been growing evidence suggesting BOLD signals in white matter also contain neural activity information3. To further demonstrate this, the brain somatosensory system was activated with tactile stimulations and distributions of BOLD signals in related white matter pathways were examined in both temporal and frequency domains. The results indicate that BOLD signals in white matter may also encode neural activity, which, given sensitive methods, may be detectable as well.Methods
MRI data were acquired from twelve healthy and right-handed adults (mean age = 27.8 yrs, stdev = 4.8 yrs), using a 3T Philips Achieva scanner (Philips Healthcare, Inc., Best, Netherlands) and a 32-channel head coil. For each subject, the following set of MRI data were acquired: a) T2*-sensitive images using a multi-echo gradient echo, echo planar imaging (EPI) sequence with TR=3 s, TE=45 ms, matrix size=, FOV= mm2, 34 axial slices of 3 mm thick with zero gap, and 145 volumes. The images were acquired three times for each subject, respectively in resting state and with left and right palm stimulations. The sensory stimuli were prescribed in a block design format, starting with 30 seconds of palm stimulations by continuous brushing followed by 30 seconds of no stimulation, and so on. b) diffusion weighted images (DWI) obtained using a single-shot, spin echo EPI sequence with b=1000 s/mm2, 32 diffusion-sensitizing directions, TR=8.5 s, TE=65 ms, SENSE factor=3, matrix size=128×128, FOV=256×256, 68 axial slices of 2 mm thick with zero gap. Prior to imaging, each subject gave informed consent according to protocols approved by the Vanderbilt University Institutional Review Board.
All BOLD time series were corrected for slice timing and head motion, and subsequently smoothed with a Gaussian kernel at FWHM=4 mm using SPM12. The smoothed BOLD signals were then linearly detrended and normalized into unit variance voxel by voxel, and band-pass filtered to retain frequencies only of 0.01-0.08 Hz. Meanwhile, diffusion tensors were constructed from the DWI data using a least square approach4.
The primary somatosensory cortex (PSC) region, thalamus and base of pons in each hemisphere were defined in the MNI space initially. The PSC included Brodman’s areas (BA) 1, 2 and 3 in the postcentral gyrus, which was multiplied by an activation map generated on the basis of the magnitude of stimulus frequency. The activation adjusted PSC along with the thalamus and base of pons were then transferred to DWI space to guide fiber tracking. Probabilistic fiber tracking was applied for each hemisphere from thalamus to PSC and from thalamus to pons. Resulting streamlines were first automatically clustered into fiber bundles using an algorithm we developed earlier5 and then the one with the largest mean magnitude of stimulus frequency was chosen as the bundle skeleton.
Within the PSC region, the first principal component of all BOLD signals was derived, with which three maps of Pearson linear correlations were computed, respectively for resting state, left and right palm stimulations. These maps were subsequently co-registered with the b=0 DWI image for each subject and maximum correlation coefficient within a window of three voxels along the perpendicular direction of the bundle skeleton was projected onto it.
Results and Discussion
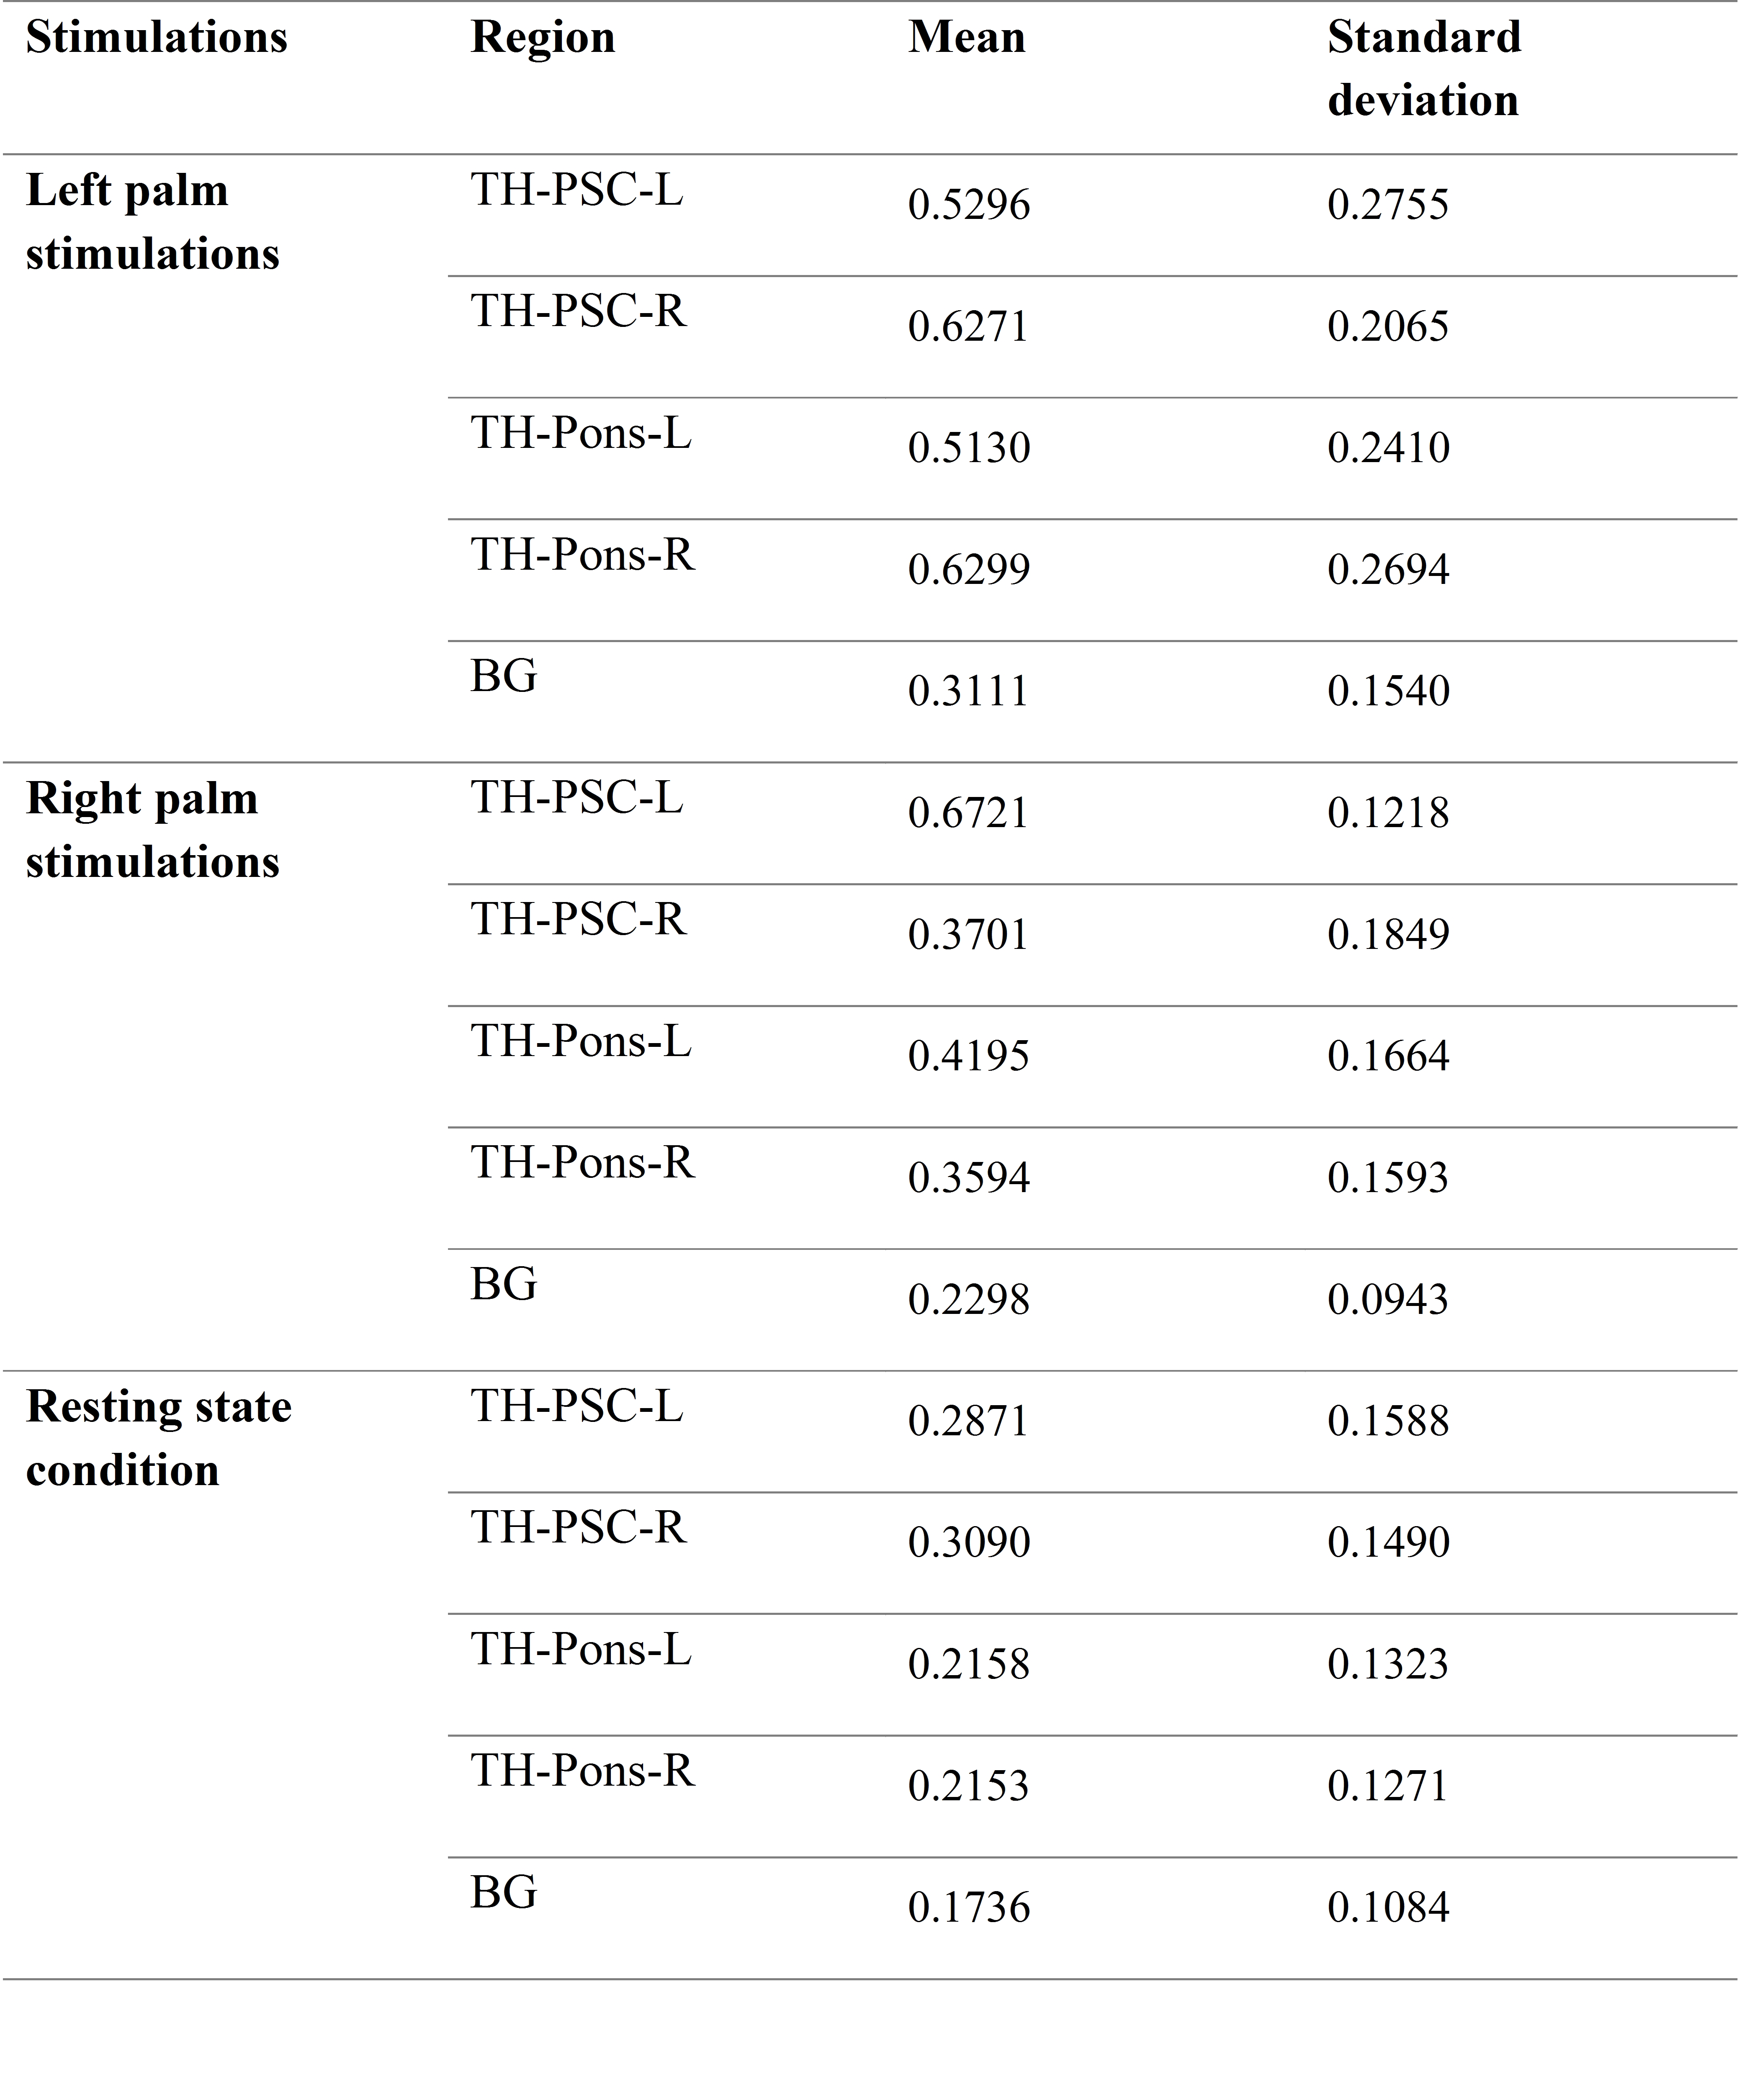
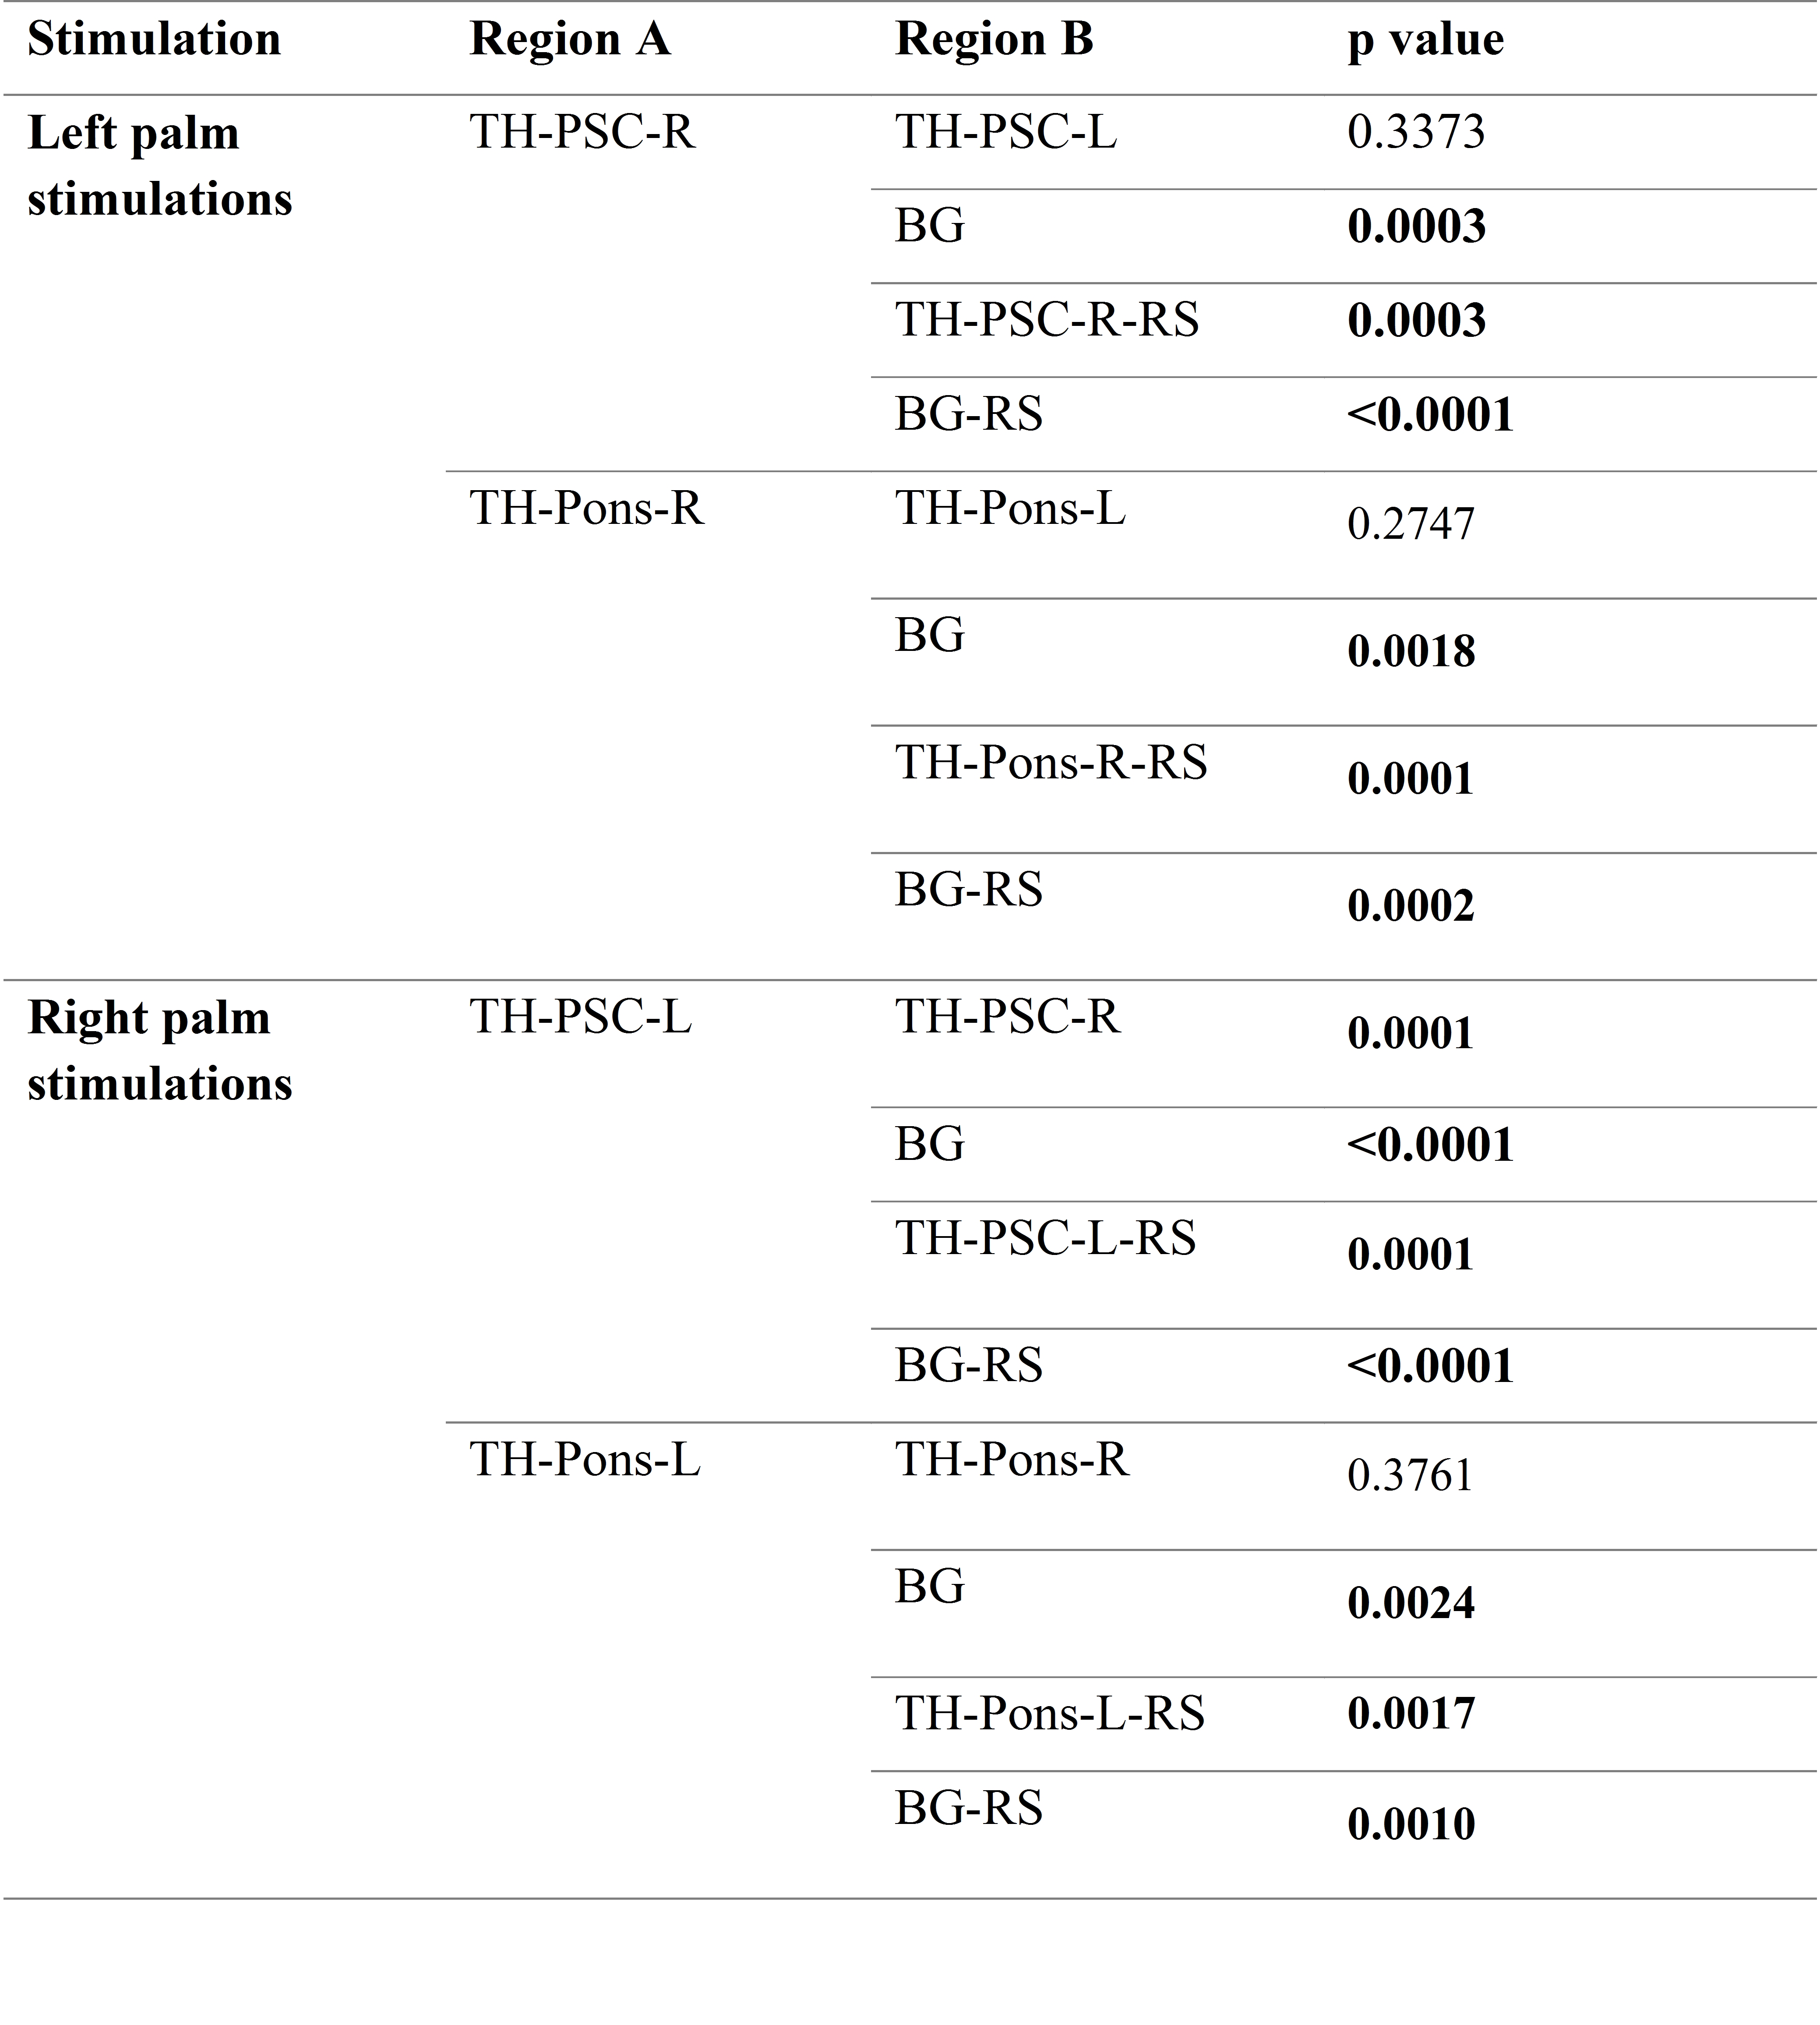
For all the twelve subjects studied, mean temporal correlation along the thalamus-PSC and thalamus-pons bundles in both hemispheres were calculated and converted to Fisher’s Z-scores for statistical testing. Summary statistics and comparisons using two-tailed, two sample students’ t-tests are given in Tab. 1 and 2. It can be seen from Tab. 1 that the mean temporal correlations along the bundle skeletons in both hemispheres during stimulations were generally higher than those in resting state and background regions. Tab. 2 shows that the correlation along the thalamus-PSC bundle contralateral to the stimuli was significantly higher those at rest and background white matter both during stimulations and at rest (p<0.05); with right palm stimulations, the thalamus-PSC bundle in the left hemisphere has significantly higher correlation than the thalamus-PSC bundle in the right hemisphere (p<0.05).Conclusion
This study demonstrates that BOLD signals in white matter may be related to evoke neural activities and may be detectable using sensitive methods.Acknowledgements
This work is supported by NIH grants NS093669 (JCG), HD044073 (LEC), HD015052 (LEC) and MH064913 (LEC).References
1. Ogawa S, Lee TM, Kay AR, Tank DW.Brain magnetic resonance imaging with contrast dependent on blood oxygenation. Proc Natl Acad Sci USA. 1990; 87:9868-9872.
2. Logothetis NK, Pauls J, Augath M, Trinath T, Oeltermann. Neurophysiological investigation of the basis of the fMRI signal. Nature. 2001; 412:150-157.
3. Gawryluk JR, Mazerolle EL, D’arcy RCN. Does functional MRI detect activation in white matter? A review of emerging evidence, issues, and future directions. Front Neurosci. 2014; 8(239):1-12.
4. Jones DK, Cercignani M. Twenty-five pitfalls in the analysis of diffusion MRI data. NMR Biomed 2010; 23:803–20.
5. Ding Z, Gore J C, Anderson A W. Classification and quantification of neuronal fiber pathways using diffusion tensor MRI. Magnetic Resonance in Medicine, 2003, 49(4): 716-721.
Figures