5341
Subtypes Differentiation of Renal Cell Carcinoma (<4cm) Using Whole-volume Histogram Analysis of Apparent Diffusion Coefficient Maps1Radiology, Tongji Hospital, Tongji Medical College, Huazhong University of Science and Technology, Wu Han, People's Republic of China
Synopsis
Because of different subtypes of RCC have different prognoses and respond differently to targeted therapies, accurate identification of the specific diagnosis prior to treatment is important. In this study, our results demonstrate that the combination of r-FOV DWI and the whole-lesion histogram analysis method may help in the interpretation of DWI of small renal masses and determine the optimal ADC parameter for quantitative assessment. The 75th percentile ADC value was more reliable than other histogram parameter values in distinguishing clear cell from non-clear cell RCCs with high sensitivity and specificity, potentially improving the accuracy of pretreatment diagnosis and selection of clinical therapy.
Purpose:
To determine the utility of ADC histogram analysis derived from high-resolution r-FOV DWI for differentiation of clear cell renal cell carcinoma (ccRCC) and non-clear cell renal cell carcinoma (non-ccRCC).Introduction:
Because of different subtypes of RCC have different prognoses and respond differently to targeted therapies, accurate identification of the specific diagnosis prior to treatment is important. Previously studies have demonstrated the whole-lesion histogram analysis could enable elimination of sample bias and enhanced assessment of the intromission heterogeneity.1 The reduced field-of-view (r-FOV) DWI, a novel developed DWI sequences, which has been recognized valuable in providing high resolution and high-quality DWI in small structures by reducing the number of required k-space lines.2 Therefore, the purpose of this study was to explore the diagnostic performance of whole-lesion ADC histogram parameters derived from high-resolution r-FOV DWI in the differentiation of subtypes of RCC (clear cell versus non-clear cell RCC).Materials and Methods:
This Institutional Review Board-approved, retrospective study included 64 patients with either pathologic analysis-confirmed ccRCC (n=46) or non-ccRCC (n=18). All patients underwent preoperative r-FOV DWI (b=600s/mm2) at 3T MRI. The whole-lesion ADC assessments were performed for each patient. All Histogram-derived ADC parameters between ccRCC and non-ccRCC were compared by using the Student’s t test or Mann–Whitney U test. Receiver operating characteristic analysis was used for statistical evaluations.Results:
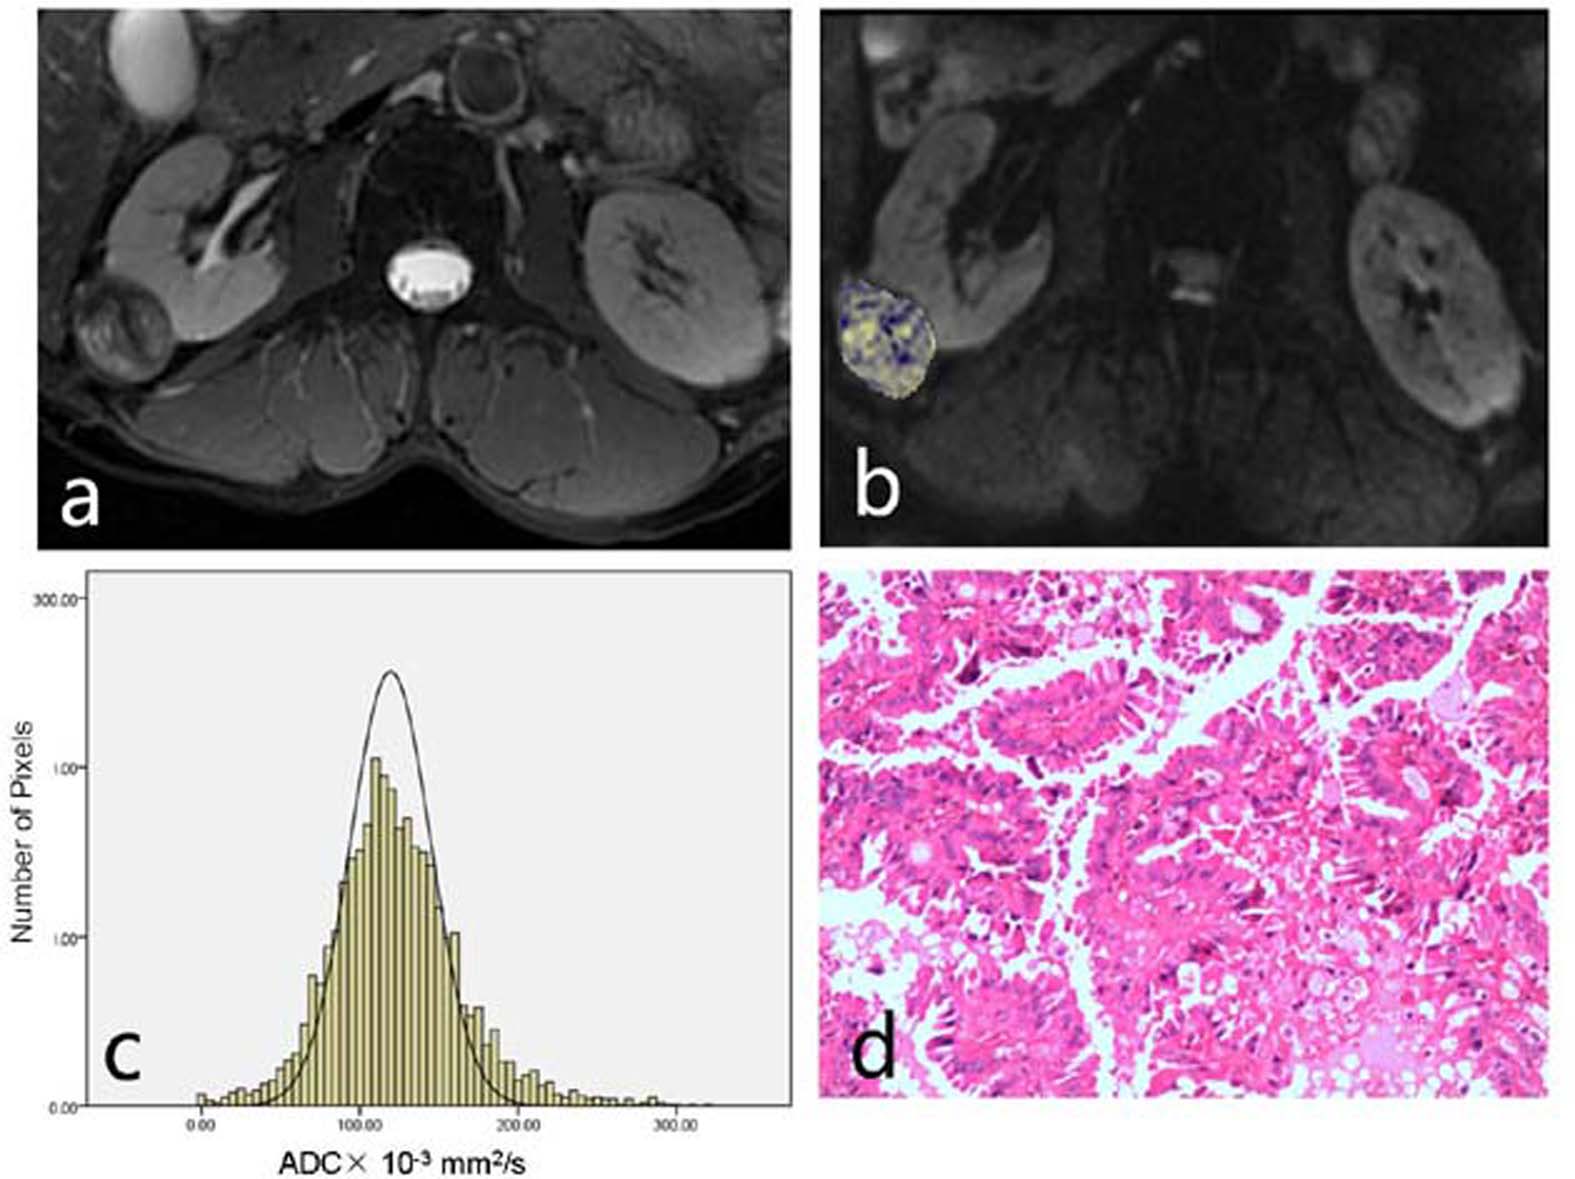
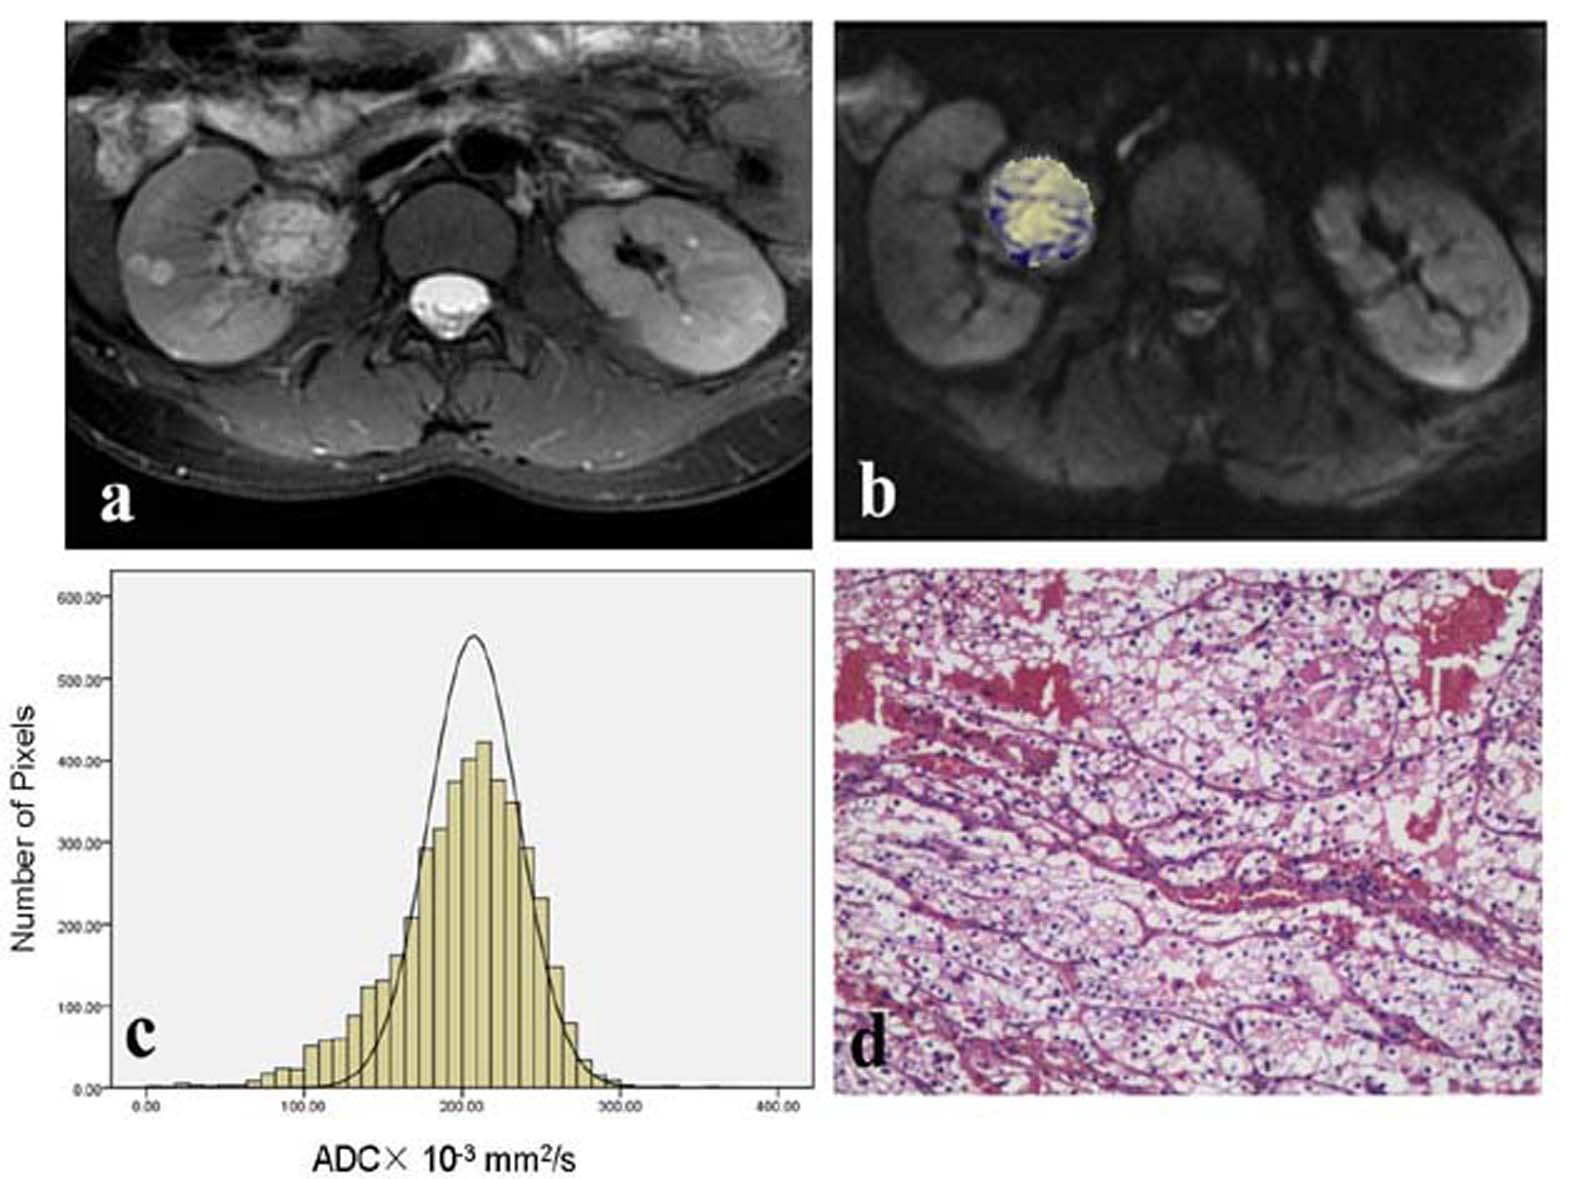
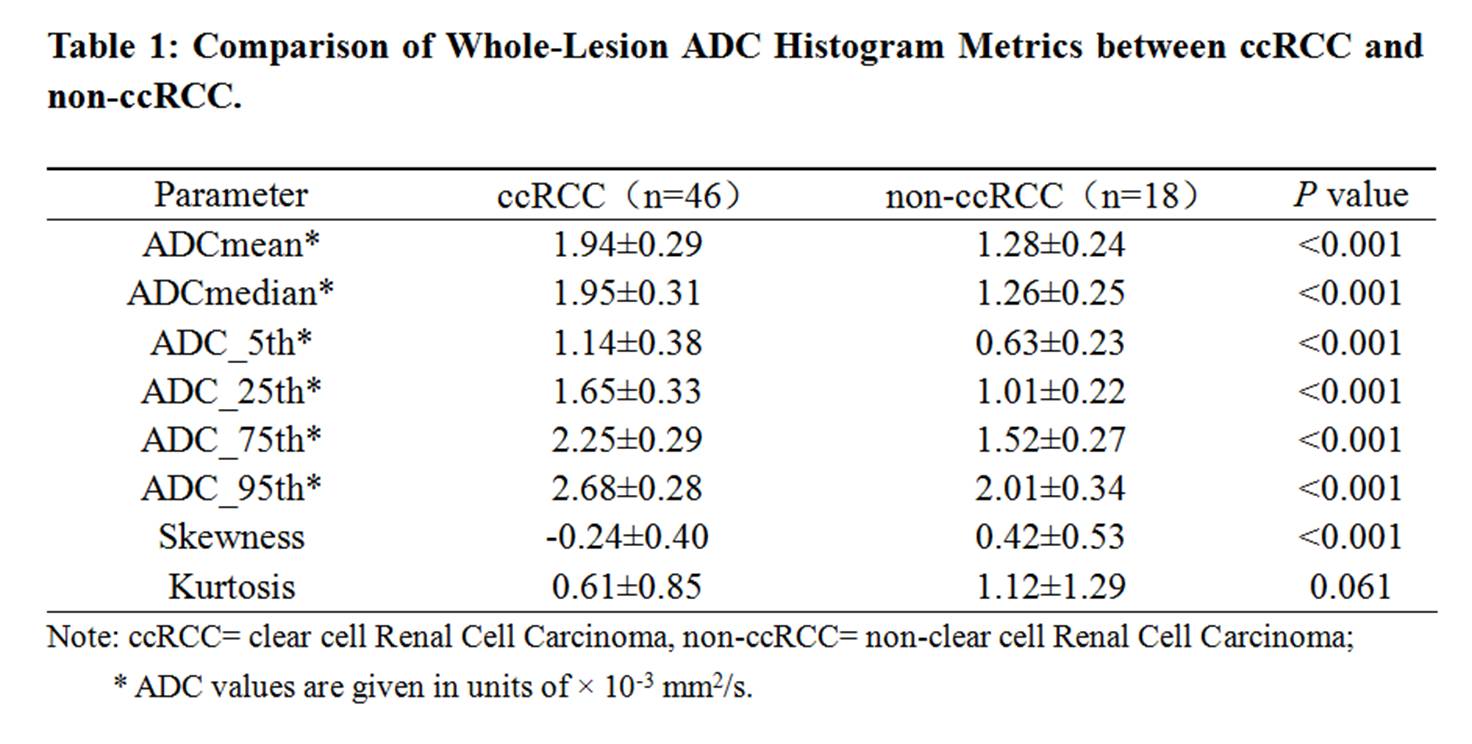
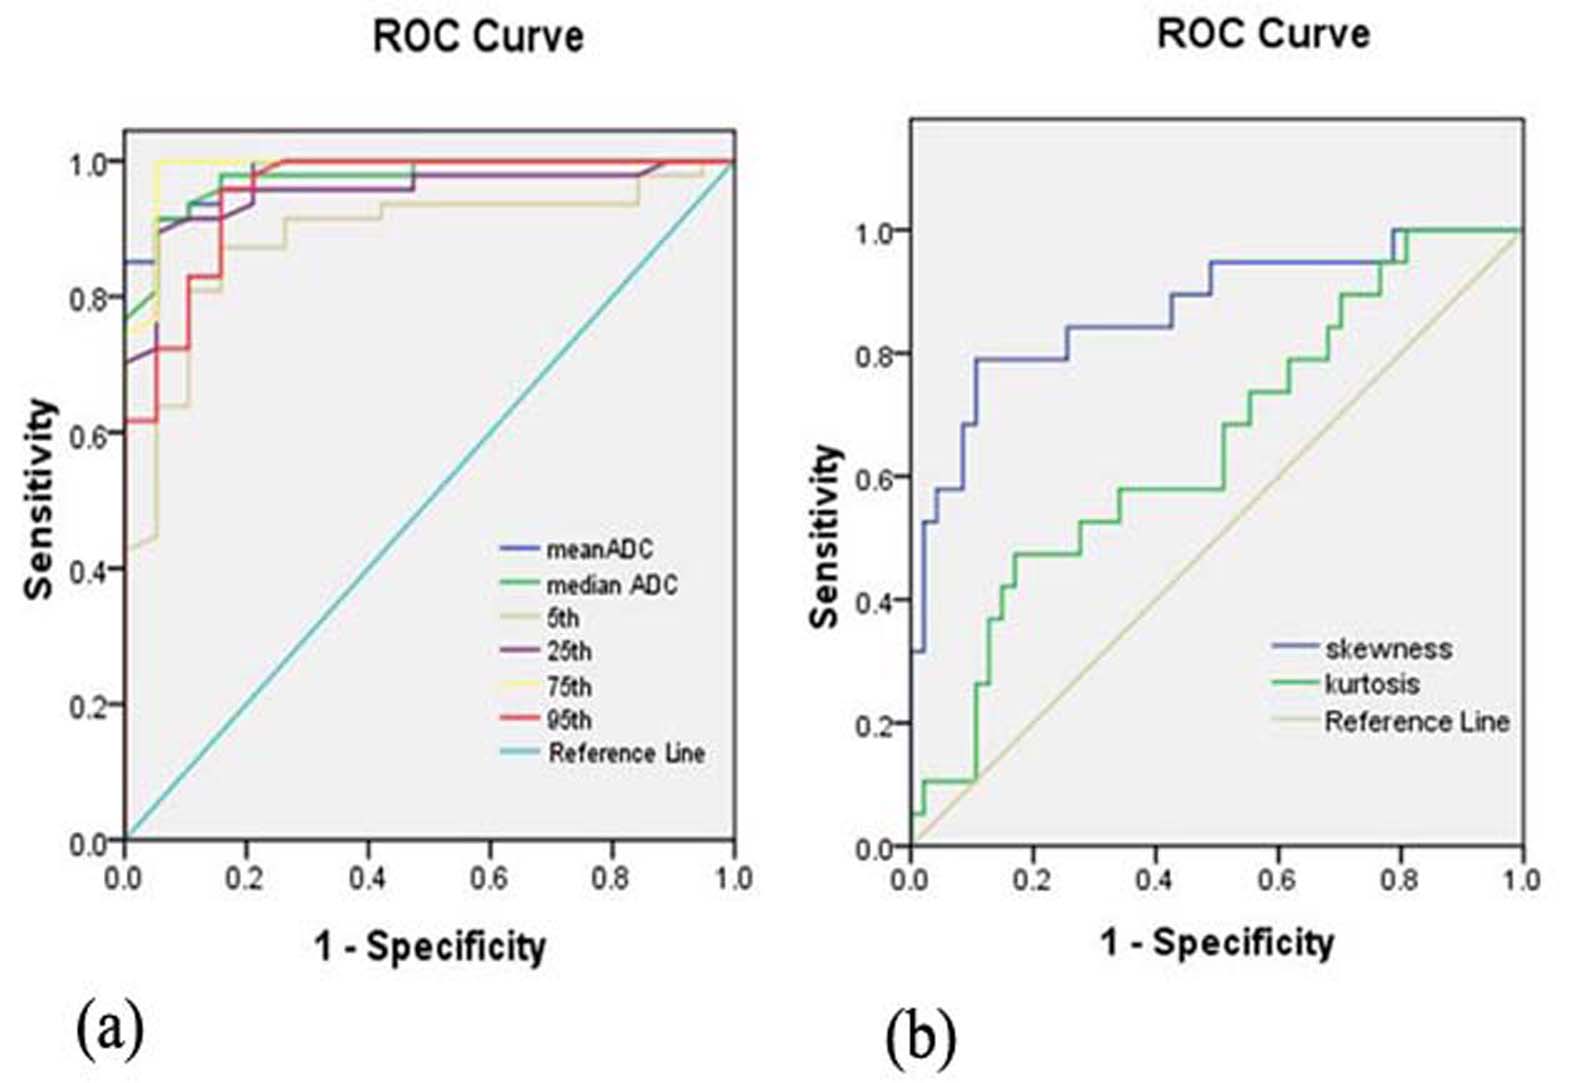
ADC histograms of the non-ccRCC group (Fig. 1) were mostly skewed positively, while the curves of ccRCC (Fig. 2) were largely skewed negatively. Mean ADC, median ADC, 5th percentile ADC, 25th percentile ADC, 75th percentile ADC, 95th percentile ADC were significantly lower in non-ccRCC (all P < 0.001), while skewness was significantly higher in non-ccRCC (P<0.001) (Fig. 3). 75th percentile ADC achieved the highest AUC (0.987) in differentiating ccRCC and non-ccRCC, with a cutoff value of 1.81× 10⁻³ mm2/s, and a sensitivity of 100.0% and a specificity of 94.7% (Fig. 4).Discussion and conclusion:
In this study, the preliminary date from our study demonstrate that the combination of r-FOV DWI and the whole-lesion histogram analysis method may help in the interpretation of DWI of small renal masses and determine the optimal ADC parameter for quantitative assessment. The 75th percentile ADC value was more reliable than other histogram metrics in distinguishing clear cell from non-clear cell RCCs with high sensitivity and specificity, potentially improving the accuracy of pretreatment diagnosis and selection of clinical therapy.Acknowledgements
No acknowledgement found.References
1.Rosenkrantz AB. Histogram-based apparent diffusion coefficient analysis:an emerging tool for cervical cancer characterization? AJR Am JRoentgenol 2013;200:311–313.
2. Riffel P, Michaely HJ, Morelli JN, et al. Zoomed EPI-DWI of the head and neck with two-dimensional, spatially-selective radiofrequencyexcitation pulses. Eur Radiol 2014;24:2507–2512.
Figures