5340
Power law exponent analysis of the resting state BOLD signal as a potential measure of excitatory-inhibitory balance in Alzheimer’s disease1Stevens Neuroimaging and Informatics Institute, University of Southern California, Los Angeles, CA, Los Angeles, CA, United States, 2Biomedical Engineering, University of Southern California, Los Angeles, CA, 3Department of Computational Cognitive Science and Neuroscience, University of California, San Diego, CA, 4Zilkha Neurogenetic Institute, University of Southern California, Los Angeles, CA, 5Knight Alzheimer Disease Research Center, Washington University, St. Louis, MO, 6Department of Radiology and Neurological Surgery, Washington University, St. Louis, MO
Synopsis
The power spectrum of the functional MRI (fMRI) signal is 1/f-distributed: the power (P) is proportional to inverse frequency (1/f) with scaling factor (B), the power law exponent (PLE). The PLE, in electrophysiology, may reflect the relative balance of excitation and inhibition. Here, we examine the PLE of fMRI power spectrums in the default mode network in older adults with a clinical dementia rating score of 0, 0.5, or 1. PLE analysis may help us understand the potential regional inhibitory/excitatory balance of underlying architecture, given that the BOLD signal is a surrogate marker of local field potentials and post-synaptic processes.
Purpose
The power spectrum of the functional MRI (fMRI) signal is 1/f-distributed: the power (P) is proportional to inverse frequency (1/f) with scaling factor (B), the power law exponent (PLE). The PLE, in electrophysiology, may reflect the relative balance of excitation and inhibition. Here, we examine the PLE of fMRI power spectrums in the default mode network in older adults with a clinical dementia rating score of 0, 0.5, or 1. PLE analysis may help us understand the potential regional inhibitory/excitatory balance of underlying architecture, given that the BOLD signal is a surrogate marker of local field potentials and post-synaptic processes.Methods
Resting state fMRI data (4x4x4mm voxels, TR=2.2s) and T1-weighted high resolution MP-RAGE data (1x1x1mm) of 57 participants, acquired on SIEMENS 3T at Washington University, St. Louis were used for analysis. FMRI preprocessing utilized the afni_proc.py script in the AFNI software (afni.nih.org). Preprocessing involved slice timing correction, rigid motion correction, alignment of functional and T1 data, registration to the talairach template, spatial smoothing using a Gaussian filter with a full-width at half-maximum of 6 mm, and regression of motion parameters, white matter and CSF signals. Regions of interest were the bilateral hippocampi and right posterior cingulate cortex (PCC). The hippocampus was anatomically defined using the WFU PickAtlas5–7, and the PCC ROI was defined as a 6mm radius sphere with center at MNI-coordinates (0 -52 26)8 taken from published work. Both ROIs were resampled to 4x4x4mm resolution. The mean power spectral density (PSD) was then calculated for each ROI resulting in 3 different power spectra for each participant, before computing the PLE. The mean and standard deviation were computed and statistical analysis comparing cognitively normal and MCI adults was performed in SPSS. The frequency bands chosen satisfy the Nyquist sampling theorem. The higher frequency band was selected to reflect the range of the hemodynamic response function when convolved with the BOLD signal, whereas the lower frequency band was selected to reflect low-level, physiological signals. Additionally, these frequency bands have been associated with impairment in neurodegenerative diseases, such as Parkinson’s disease9.Results
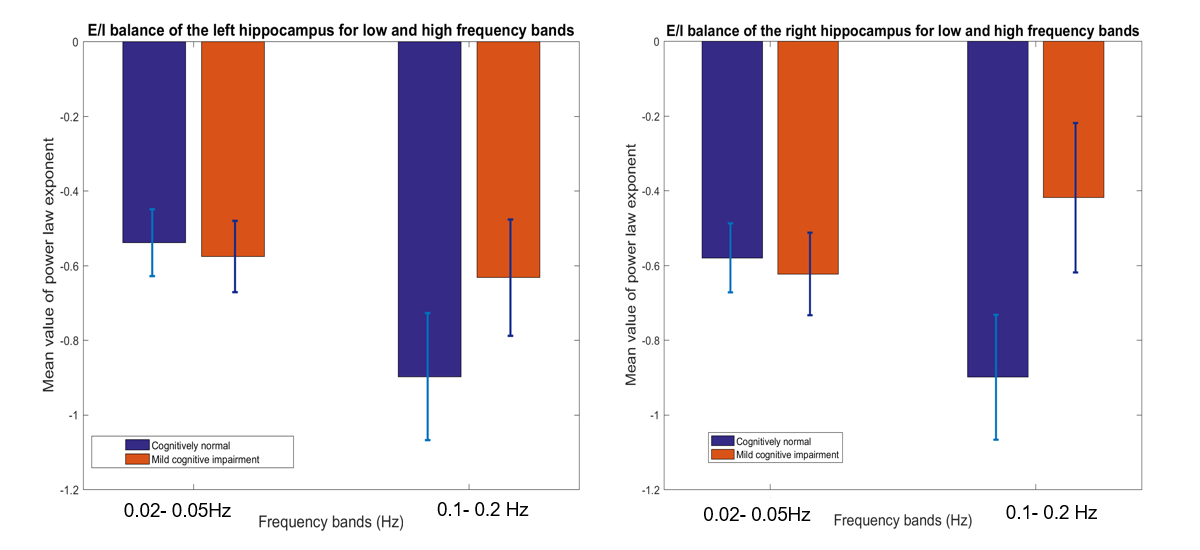
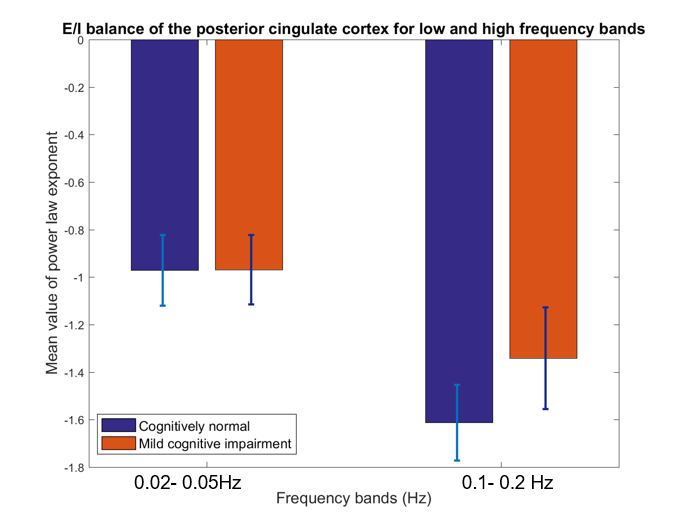
Below we show mean PLE coefficients and standard error in the low and high frequency bands for the right and left hippocampi, and for the right PCC for cognitively normal (CN) adults and adults with mild cognitive impairment (MCI), as defined by their CDR score. Overall, we found that MCI participants had a slope closer to 0 whereas the CN participants had a more negative slope across the 3 brain regions. The largest group difference in excitatory-inhibitory balance was in the right hippocampus (t(55) =-2.06, p=0.04). This suggests that those with MCI have a greater excitatory activity as indicated by the flatter slope than those with normal cognition.Discussion
The results highlight two main findings. First, consistent with previous literature,3,4 the mean PLE for the PCC is greater than the hippocampus. Prefrontal and parietal lobes, containing the DMN have been shown to contain the most power in the 0.01-0.05Hz frequency range, while subcortical structures, such as the hippocampus and amygdala, temporal cortex contains most power in the 0.15-0.2Hz frequency range10,11. Neurophysiological observation studies12 suggest that the hippocampus has a smaller low-frequency activity compared to the neocortex. Second, MCI participants have a smaller PLE than in the CN participants in the hippocampus. A higher PSD curve in the MCI adults, results in a flatter slope when fitted in a log-frequency power spectrum graph. Here, we used the PLE, as it has been shown to fit better to the fMRI power spectrum in the <0.1Hz frequency compared to the exponential or log-normal functions3. In aging, there is loss of cognition in several domains along with increase in spontaneous baseline noisy activity, according to the neural noise hypothesis13. EEG and ECoG studies have shown a flatter 1/f PSD even at rest14. PLE changes have also been linked to age-related working memory decline13. Changes in the local excitation/inhibition ratio drives the neuronal spiking activity and computational models have shown flattening in the slope of the PSD, when spiking activity is decoupled from an oscillatory regimen13. Therefore, the lower mean value of the PLE in the hippocampus in MCI adults may signify the excitatory response of neurons in the hippocampus.Conclusion
Older adults with MCI have an increased risk for developing Alzheimer’s disease. This may be linked to an imbalance of excitatory-inhibitory synaptic activity in the hippocampus and posterior cingulate cortex, two key regions associated with Alzheimer’s disease. The power spectrum of the BOLD, which may be tied to regional synaptic dysfunction, is a meaningful measure of disease progression.Acknowledgements
No acknowledgement found.References
1. Logothetis NK. What we can and what we cannot do with fMRI. Nature. 2008;453(7197):869-878. doi:10.1038/nature06976.
2. Arthurs OJ, Boniface S. How well do we understand the neural original of the fMRI BOLD signal? Trends Neurosci. 2002;25(1):27-31. doi:10.1016/S0166-2236(00)01995-0.
3. He BJ. Scale-free properties of the functional magnetic resonance imaging signal during rest and task. J Neurosci. 2011;31(39):13786-13795. doi:10.1523/JNEUROSCI.2111-11.2011.
4. Fransson P, Metsäranta M, Blennow M, Åden U, Lagercrantz H, Vanhatalo S. Early development of spatial patterns of power-law frequency scaling in fMRI resting-state and EEG data in the newborn brain. Cereb Cortex. 2013;23(3):638-646. doi:10.1093/cercor/bhs047.
5. Lancaster JL, Woldorff MG, Parsons LM, et al. Automated Talairach Atlas labels for functional brain mapping. Hum Brain Mapp. 2000;10(3):120-131. doi:10.1002/1097-0193(200007)10:3<120::AID-HBM30>3.0.CO;2-8.
6. Maldjian JA, Laurienti PJ, Kraft RA, Burdette JH. An automated method for neuroanatomic and cytoarchitectonic atlas-based interrogation of fMRI data sets. Neuroimage. 2003;19(3):1233-1239. http://www.ncbi.nlm.nih.gov/pubmed/12880848. Accessed November 5, 2016.
7. Lancaster JL, Summerlin JL, Rainey L, Freitas CS, Fox PT. The Talairach Daemon a database server for talairach atlas labels. Neuroimage. 1997;5(4 PART II).
8. Van Dijk KRA, Hedden T, Venkataraman A, Evans KC, Lazar SW, Buckner RL. Intrinsic Functional Connectivity As a Tool For Human Connectomics: Theory, Properties, and Optimization. J Neurophysiol. 2010;103(1):297-321. doi:10.1152/jn.00783.2009.
9. Song X, Hu X, Zhou S, et al. Association of specific frequency bands of functional MRI signal oscillations with motor symptoms and depression in Parkinson’s disease. Sci Rep. 2015;5:16376. doi:10.1038/srep16376.
10. Baria AT, Baliki MN, Parrish T, Apkarian AV. Anatomical and Functional Assemblies of Brain BOLD Oscillations. J Neurosci. 2011;31(21).
11. Wu CW, Gu H, Lu H, Stein EA, Chen J-H, Yang Y. Frequency specificity of functional connectivity in brain networks. Neuroimage. 2008;42(3):1047-1055. doi:10.1016/j.neuroimage.2008.05.035.
12. He BJ, Raichle ME. The fMRI signal, slow cortical potential and consciousness. Trends Cogn Sci. 2009;13(7):302-309. doi:10.1016/j.tics.2009.04.004.
13. Voytek B, Kramer MA, Case J, et al. Behavioral/Cognitive Age-Related Changes in 1/f Neural Electrophysiological Noise. doi:10.1523/JNEUROSCI.2332-14.2015.
14. Gao RD, Peterson EJ, Voytek B. Inferring Synaptic Excitation/Inhibition Balance from Field Potentials. doi:10.1101/081125.
Figures