5339
Prior Knowledge Oriented Independent Component Analysis (pICA) for Component Identification in Functional MRI1Medical Physics, University of Wisconsin - Madison, Madison, WI, United States, 2Radiology, University of Wisconsin - Madison, WI, United States, 3Biomedical Engineering, University of Wisconsin - Madison, WI, United States, 4Psychiatry, University of Wisconsin - Madison, WI, United States
Synopsis
Independent component analysis (ICA), as a data-driven signal decomposition method, has been widely used in fMRI. Sources of the measurement can be separated according to the rule of maximum independency, but it usually cannot naturally generate a source which is highly correlated with the signal we are interested in. To solve this problem, we propose a new method, prior knowledge oriented ICA (pICA), to drive ICA to a set of sources with the SOI among them. Experiments of simulation and fMRI show this new method has higher specificity and accuracy in identifying the SOI and its corresponding spatial map.
Introduction
Independent component Analysis (ICA), as a blind source analysis technique, has been widely used in functional magnetic resonance imaging (fMRI), especially when the full model for regression is not known.1,2 Since it is a data-driven signal decomposition method, sources of a measurement can be separated according to the rule of maximum independency.3,4 To get the relatively dominant regions of the signal of interest (SOI), the source most strongly correlated with the SOI has to be chosen to represent it. However, usually this source is a combination of the SOI and other signals, and will lose the specificity in identifying the dominant region of SOI.1-5 In this paper, we propose a new method, prior knowledge oriented ICA (pICA), to drive ICA to a set of sources with the SOI among them.Theory
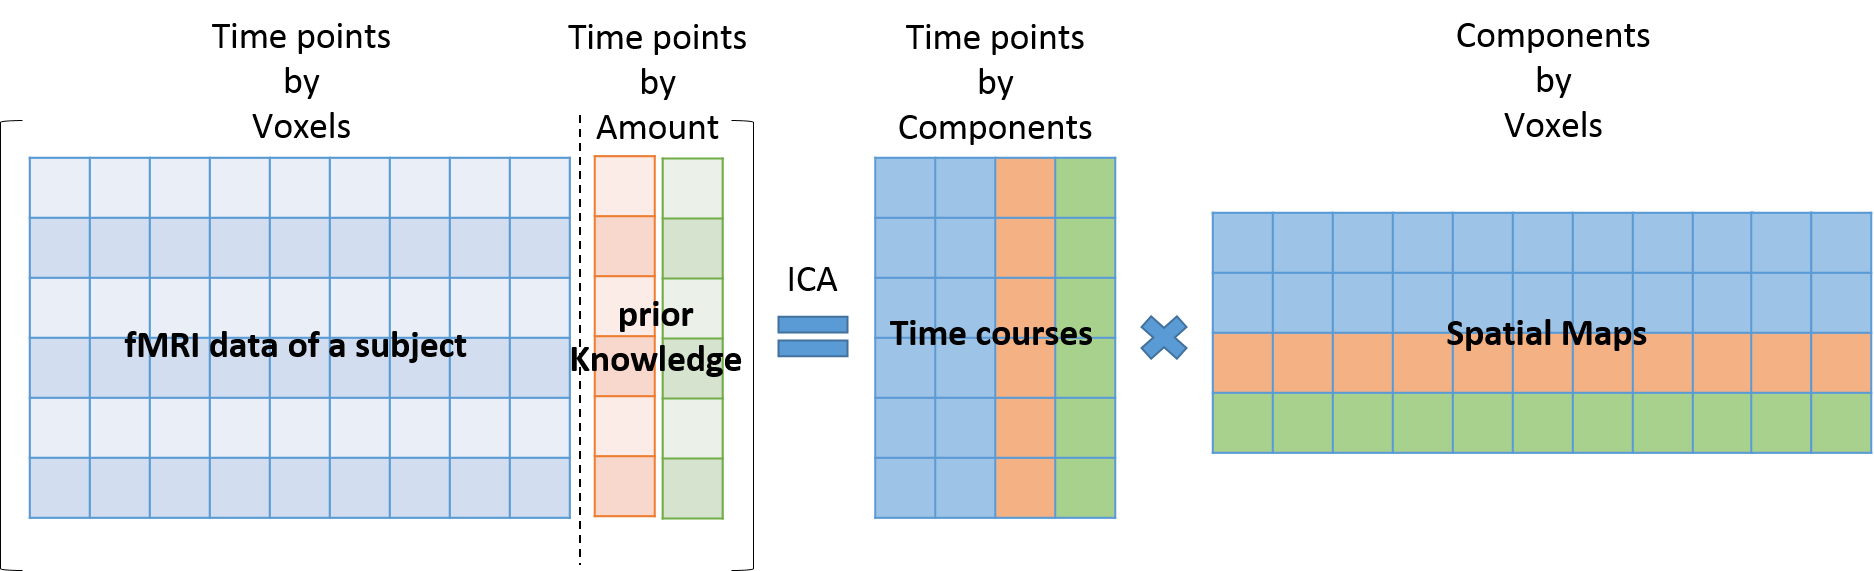
In ICA, the measurement is assumed to be a linear combination of multiple sources. The independency, variation and number of pixels involved (in spatial ICA) or number of time points involved (in temporal ICA) of each source all will affect the result of ICA.3,4 Since spatial ICA is most commonly used in fMRI, here only the spatial pICA will be discussed. Usually, in ICA the component most like the SOI is a combination of the SOI and other signals.2-4 To isolate the SOI as one of the sources, the time course of the SOI is added to the original measurement matrix as a prior knowledge. As the amount of prior knowledge increases, pICA can finally drive the result to involve the SOI as one of the sources as shown in Figure 1, because the total weight of the SOI is increased in the whole data set. In this way, regions where the SOI is relatively dominant can be identified more accurately and specifically. Moreover, due to this nature of pICA, it can also identify sources with small temporal variation or occupying small regions in the brain which cannot be achieved by ICA, and identify multiple SOIs simultaneously with multiple prior knowledges added.Methods
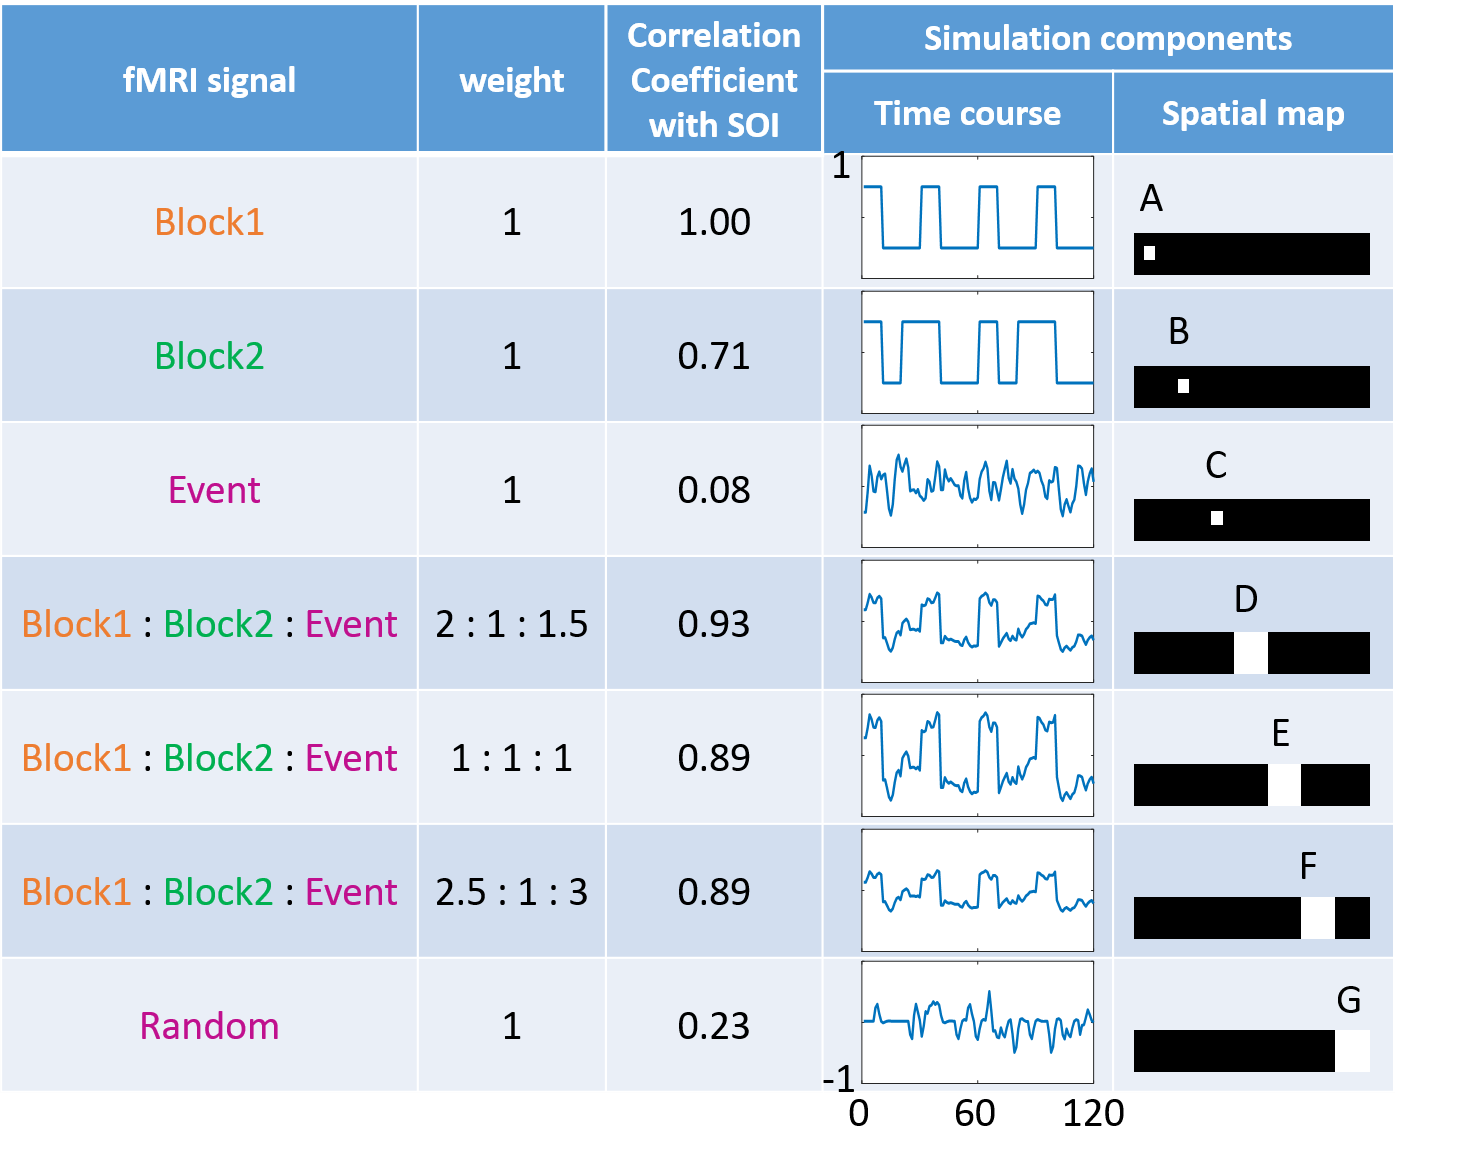
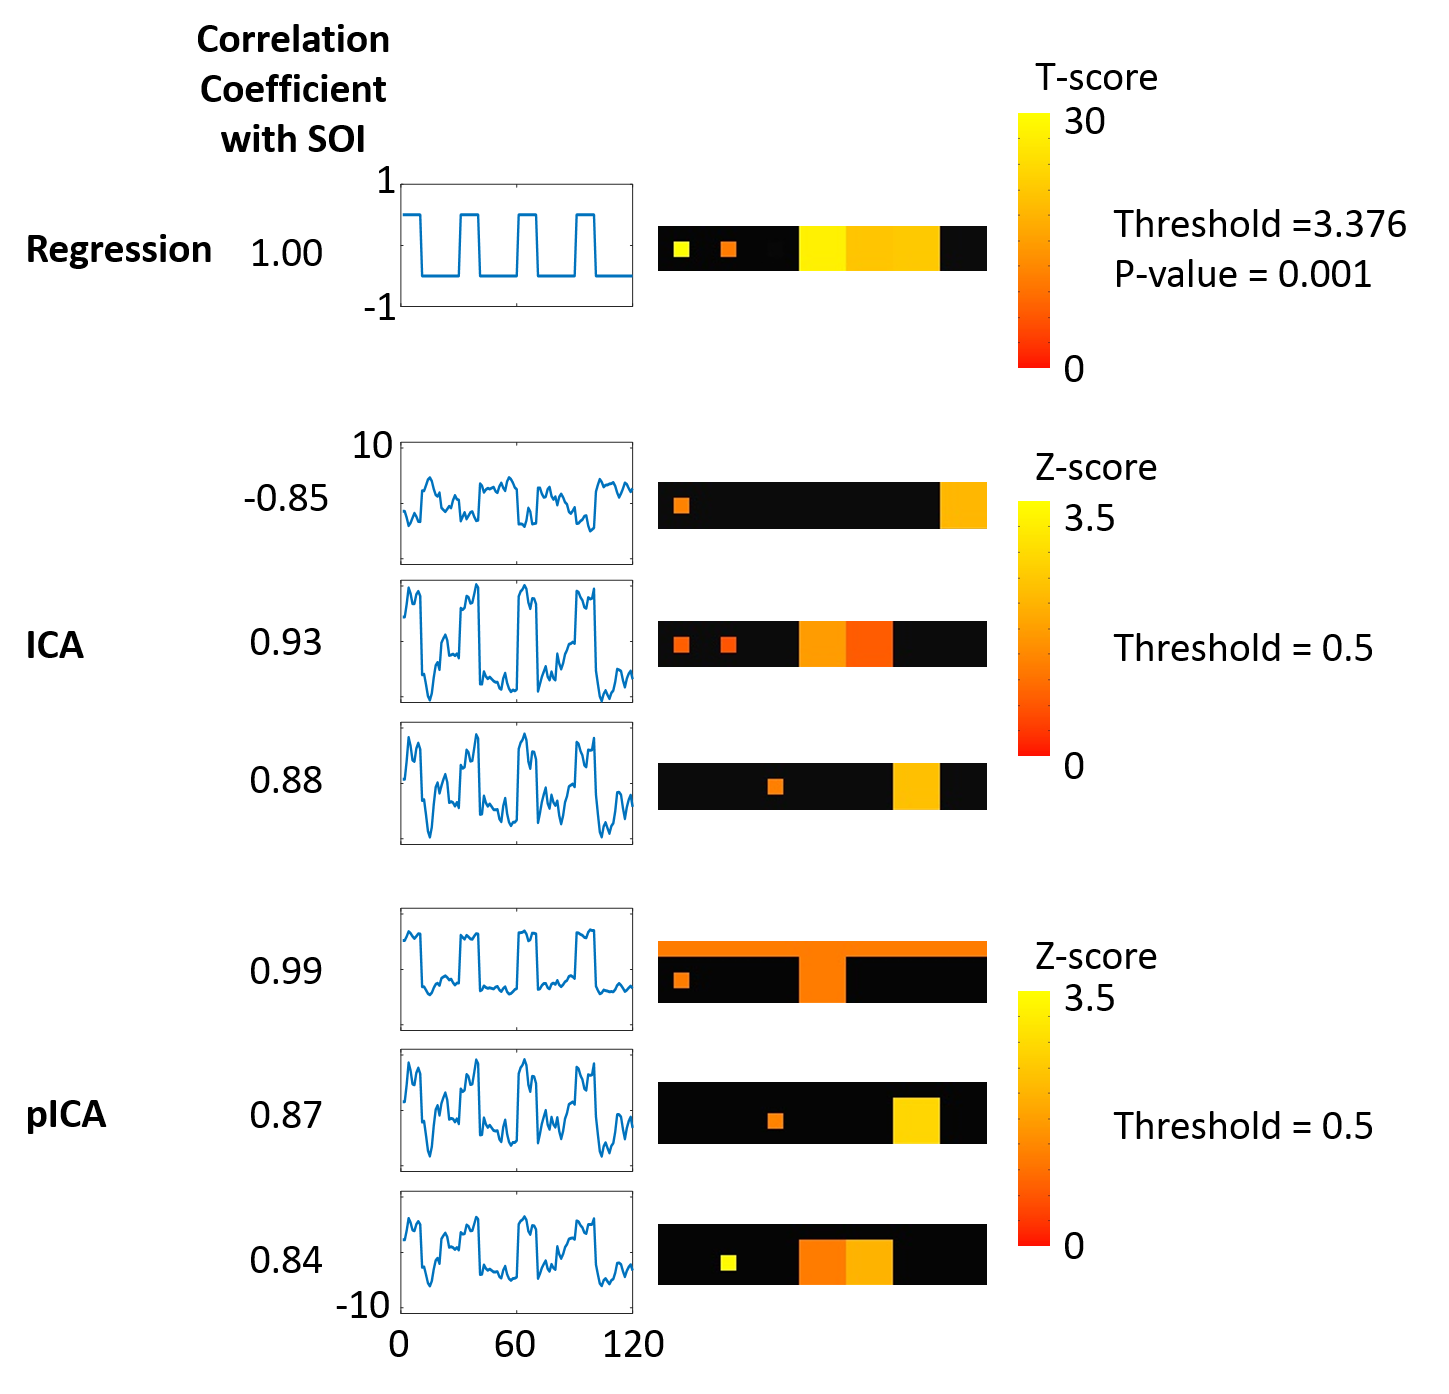
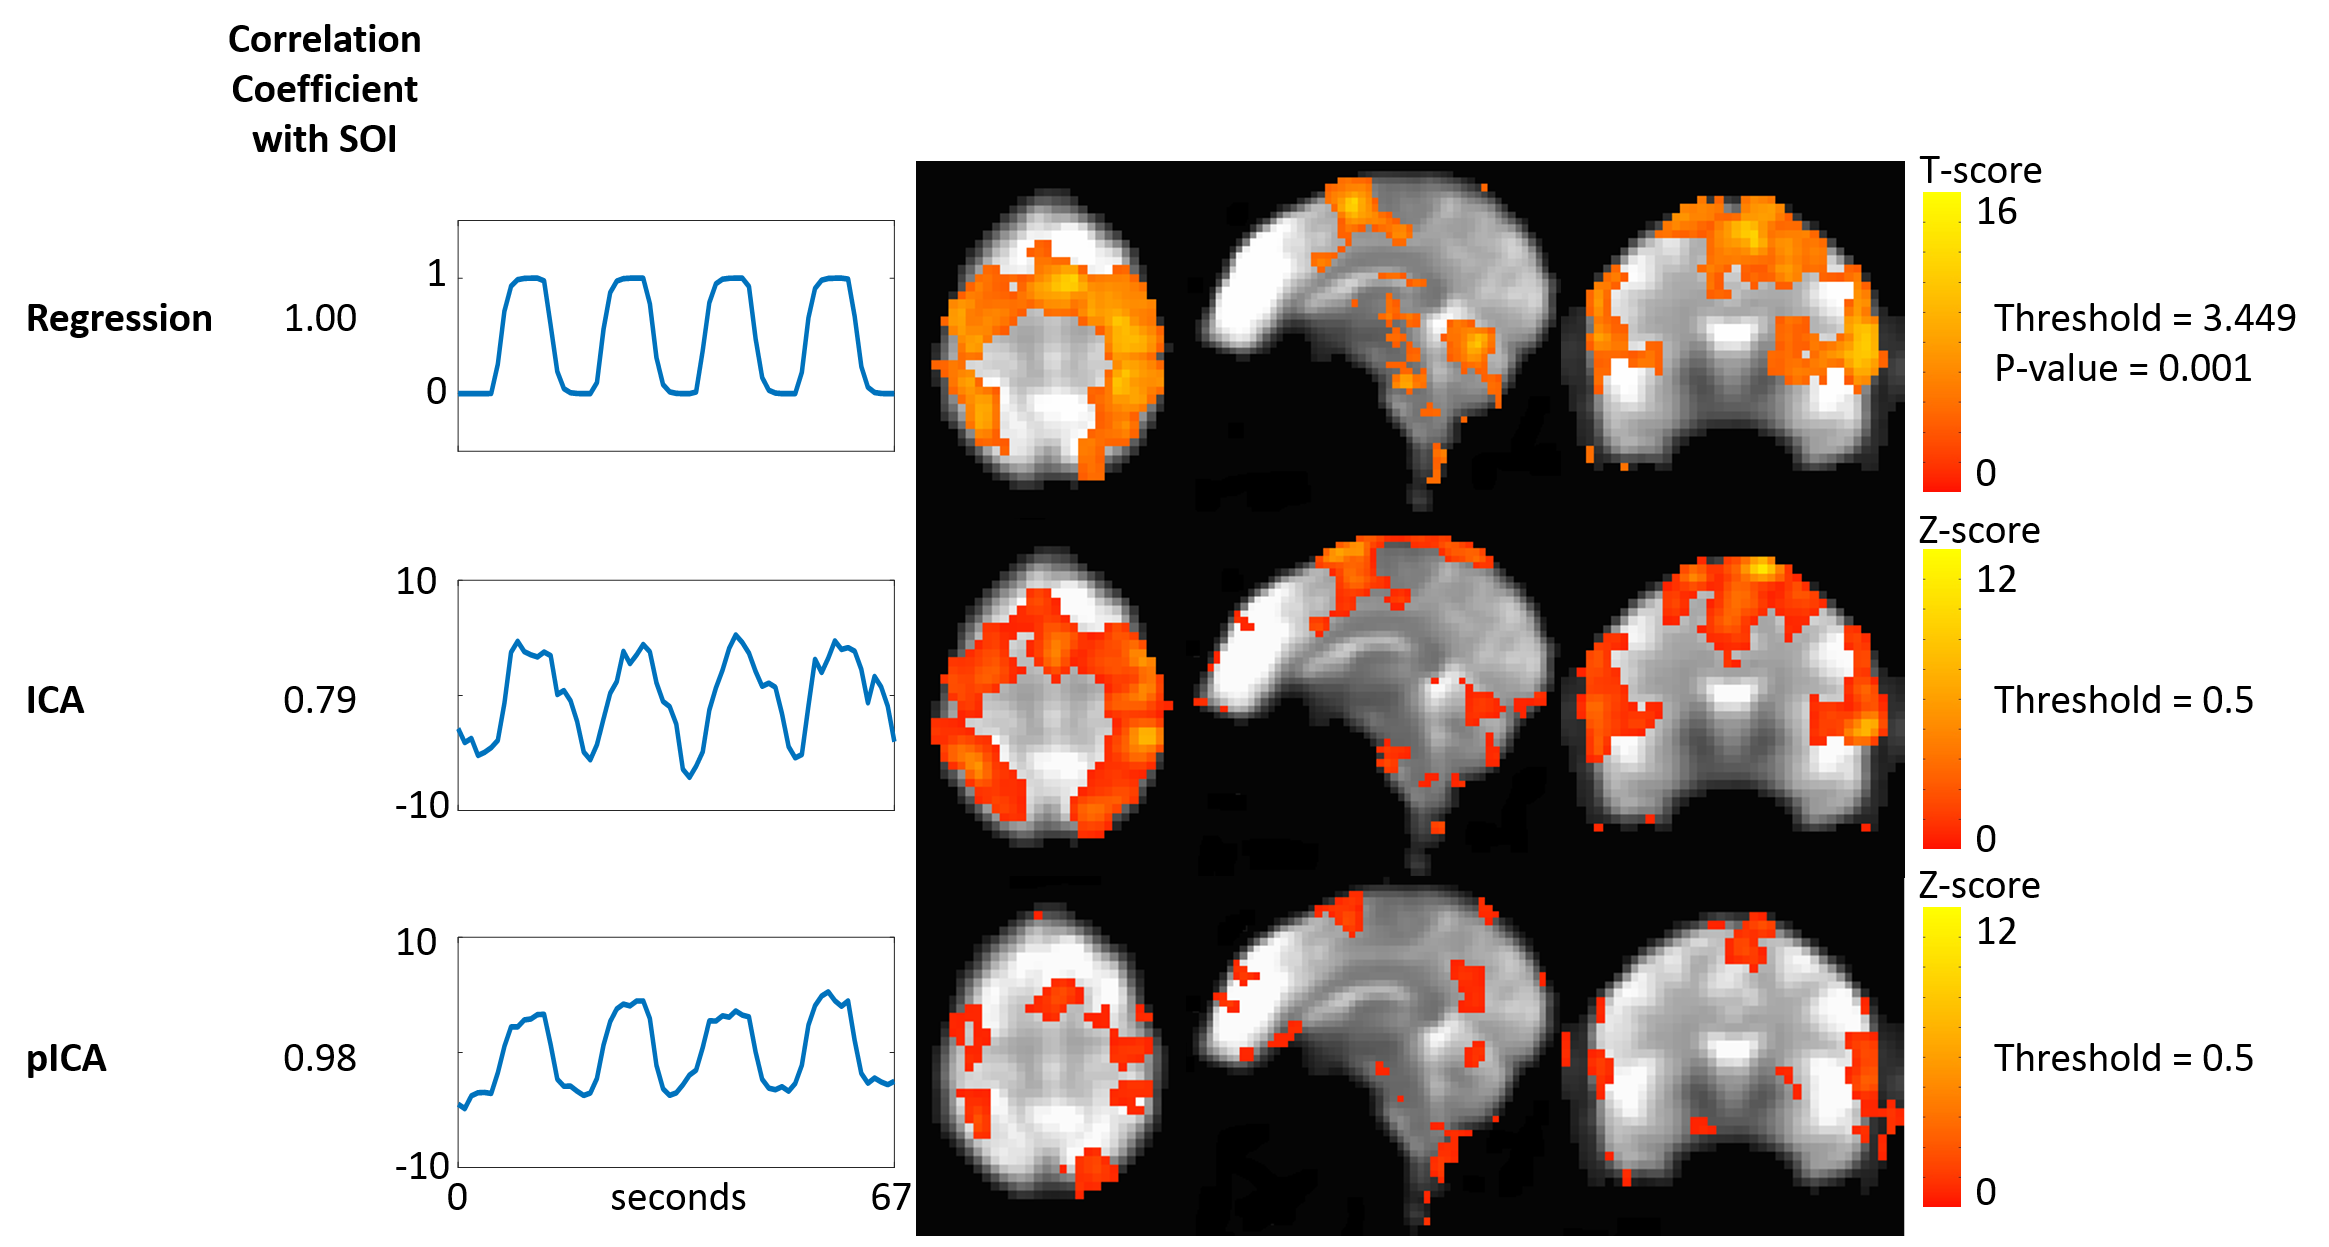
The performance of pICA is demonstrated with both simulation and fMRI data. In the simulation, two block signals, one event-related signal and one random signal were generated as sources. They and their linear combinations are assigned to seven regions as shown in Figure 2. The signal of Block1 is assumed known as prior knowledge. The results of multiple linear regression, ICA and pICA are compared. Finally, a block design finger tapping fMRI data set is also analyzed by these 3 methods with the block design as the prior knowledge.Results & Discussion
In Figure 3, the simulation result demonstrates that with the prior knowledge added pICA is able to drive the result to a set of components including one highly correlated with the SOI. This increases the specificity and accuracy in identifying regions where the SOI is relatively dominant. In the pICA result, the first component is highly correlated with the SOI, and region A and D are picked up as the SOI dominant regions. However, for ICA, since the number of voxels involved by the signal Block1 in region A is relatively small, the ICA results in components highly correlated with the signal in larger regions, and none of them can stand for the SOI. Although the second component is most correlated with the SOI, in the spatial map it identifies all the regions A, B, D and E as the SOI dominant regions, but this is not true for region B and E from Figure 2. In this case, the method of ICA loses specificity. In the result of regression, many regions (A, B, D, E and F) are identified as the dominant regions of SOI. This is because the signal Block2 has a relative high correlation with the SOI, and the full model of the regression is unknown. In this situation, the regression loses accuracy. The comparison of these methods in the finger tapping experiments shows a similar result in Figure 4. The pICA gets the component most correlated with the SOI, and specifies the its dominant regions. ICA gets a component which is a combination of the SOI and some other signals, and loses the specificity in identifying the SOI’s dominant regions. The regression analysis specifies more and larger regions due to the incompleteness of the model.Acknowledgements
This work is supported by NIH grants RC1MH090912 and U01NS093650.References
1. Mckeown MJ, Jung TP, Makeig S, et al. Spatially independent activity patterns in functional MRI data during the stroop color-naming task. Proc Natl Acad Sci USA. 1998;95(3):803-10.
2. Calhoun VD, Adali T, Pearlson GD, Pekar JJ. Spatial and temporal independent component analysis of functional MRI data containing a pair of task-related waveforms. Hum Brain Mapp. 2001;13(1):43-53.
3. Mckeown MJ, Sejnowski TJ. Independent component analysis of fMRI data: examining the assumptions. Hum Brain Mapp. 1998;6(5-6):368-72.
4. Hyvärinen A, Oja E. Independent component analysis: algorithms and applications. Neural Netw. 2000;13(4-5):411-30.
5. Calhoun VD, Adali T, Stevens MC, Kiehl KA, Pekar JJ. Semi-blind ICA of fMRI: A method for utilizing hypothesis-derived time courses in a spatial ICA analysis. Neuroimage. 2005;25(2):527-38.
6. Mckeown MJ, Makeig S, Brown GG, et al. Analysis of fMRI data by blind separation into independent spatial components. Hum Brain Mapp. 1998;6(3):160-88.
Figures