5338
Non-linear Realignment Using Minimum Deformation Averaging for Single-subject fMRI at Ultra-high Field1Centre for Advanced Imaging, The University of Queensland, Brisbane, Australia, 2Queensland Brain Institute, The University of Queensland, Brisbane, Australia
Synopsis
Motion dominates the contribution to variance in fMRI time series and it is therefore important to account for this variability correctly. Currently, most correction schemes use a rigid body realignment procedure, but interactions with magnetic field inhomogeneities and physiological fluctuations lead to non-linear deformations. Non-linear realignment increased spatial resolution by harvesting sub-voxel shift information with little impact on tSNR. Activated regions showed a better delineation with a clear match to anatomical features. Importantly, our proposed method can be applied to already acquired fMRI data sets to improve spatial conspicuity.
Purpose
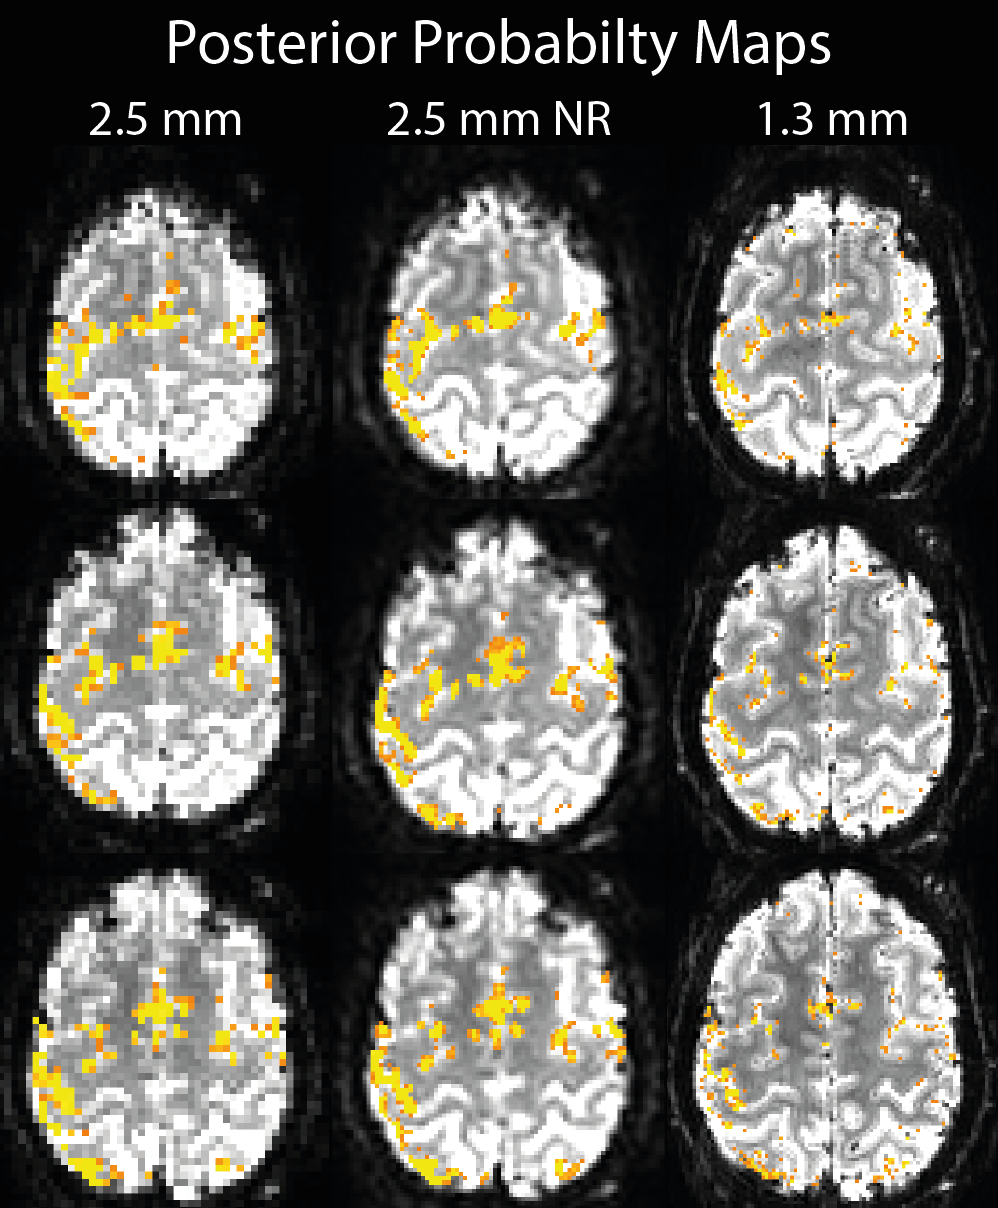
Realignment in fMRI using rigid body transformations increases the temporal SNR and can mitigate the effects of subject motion1. However, interactions with inhomogeneities in the main magnetic field can cause non-linear deformations of the images over time2. Furthermore, cardiac pulsation can induce tissue displacement at brain/CSF and brain/vessel boundaries of up to 2 mm3. Here, we investigate non-linear realignment based on a probabilistic atlassing approach4 for single-subject fMRI at ultra-high field. We apply non-linear realignment to the individual fMRI volumes of a single subject to correct for non-linear deformations. Additionally, sub-voxel shifts between volumes can be used to average sub-voxel boundaries and reduce partial-volume effects and, thereby, harness sub-voxel information4. We compare segmentation results and posterior probability maps of a low resolution acquisition to (i) the same time series non-linearly realigned and (ii) to a native high-resolution acquisition.Methods
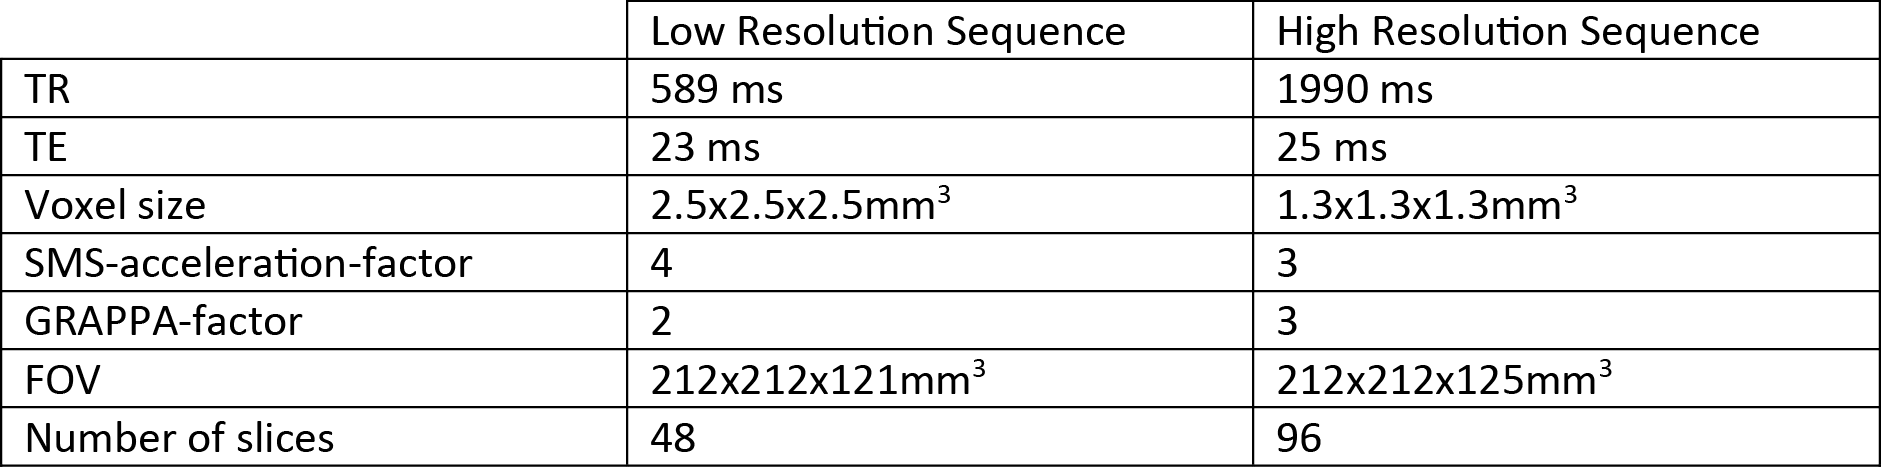
We acquired MRI data on a 7T whole-body Magnetom research scanner (Siemens Healthcare, Erlangen, Germany) with a gradient strength of 70 mT/m, slew rate of 200 T/m/s and a 32-channel head coil (Nova Medical, Wilmington, USA) using the CMRR SMS sequence implementation (release 11a)5,6 with a low resolution of 2.53 mm3 and a high resolution of 1.33 mm3 (Table 1). After approval by the local human ethics committee and written informed consent, 1 participant (male, 24 years of age) performed a 6-minute rhythmic finger-tapping task. After linear realignment using SPM 127 as implemented in Matlab8, all 581 single volumes of the low resolution acquisition were used to create a probabilistic model4,9,10. The fitting strategy consisted of one linear fit to the evolving internal model followed by a hierarchical series of non-linear grid transforms. These transforms started with a step size of 32mm followed by 16mm, 12mm, and finished with 8mm. These fitting steps use progressively de-blurred data with a 3D kernel FWHM of half the current step size. Twenty iterations per stage were performed using the ANIMAL algorithm11. As the step size decreased the resolution of the evolving model to which data was being fit was increased, starting with a step size of 3.0mm and finishing with a resolution of 1.5mm. It is possible to increase the resolution to this point as there is overlapping information due to the subject’s motion which allows the extraction of sub-voxel boundary information. A robust averaging process was used to create the average model. We segmented the mean images of each time series in 6 different tissues classes12 to assess the delineation of the cortical sheet. To perform statistical inference on the un-smoothed data, we used the variational Bayesian model estimation13 including RETROICOR14 regressors. Posterior probability maps for the effect of finger tapping were thresholded at an effect size threshold of 1% with a log odds threshold of 10.Results&Discussion
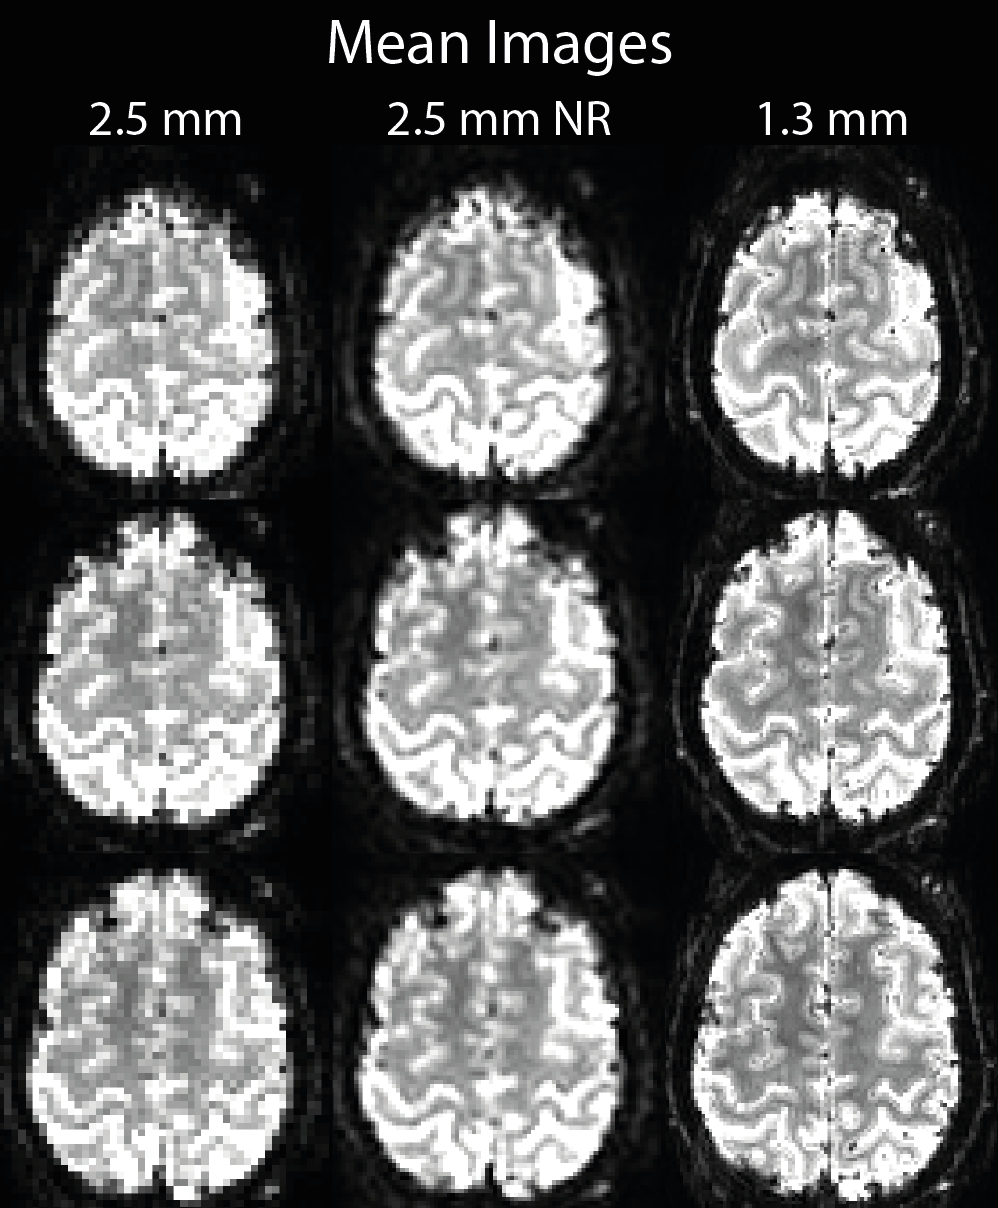
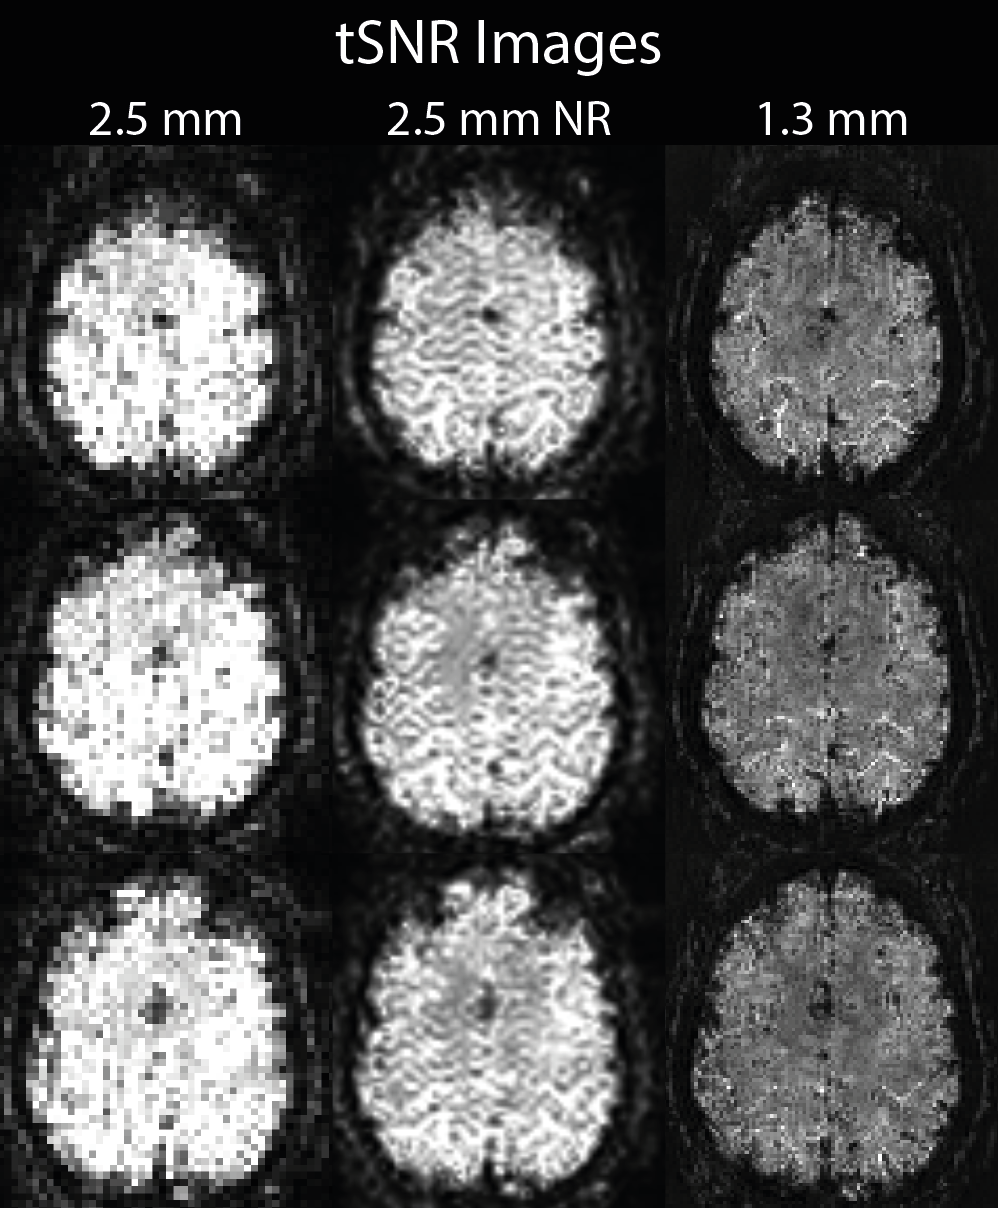
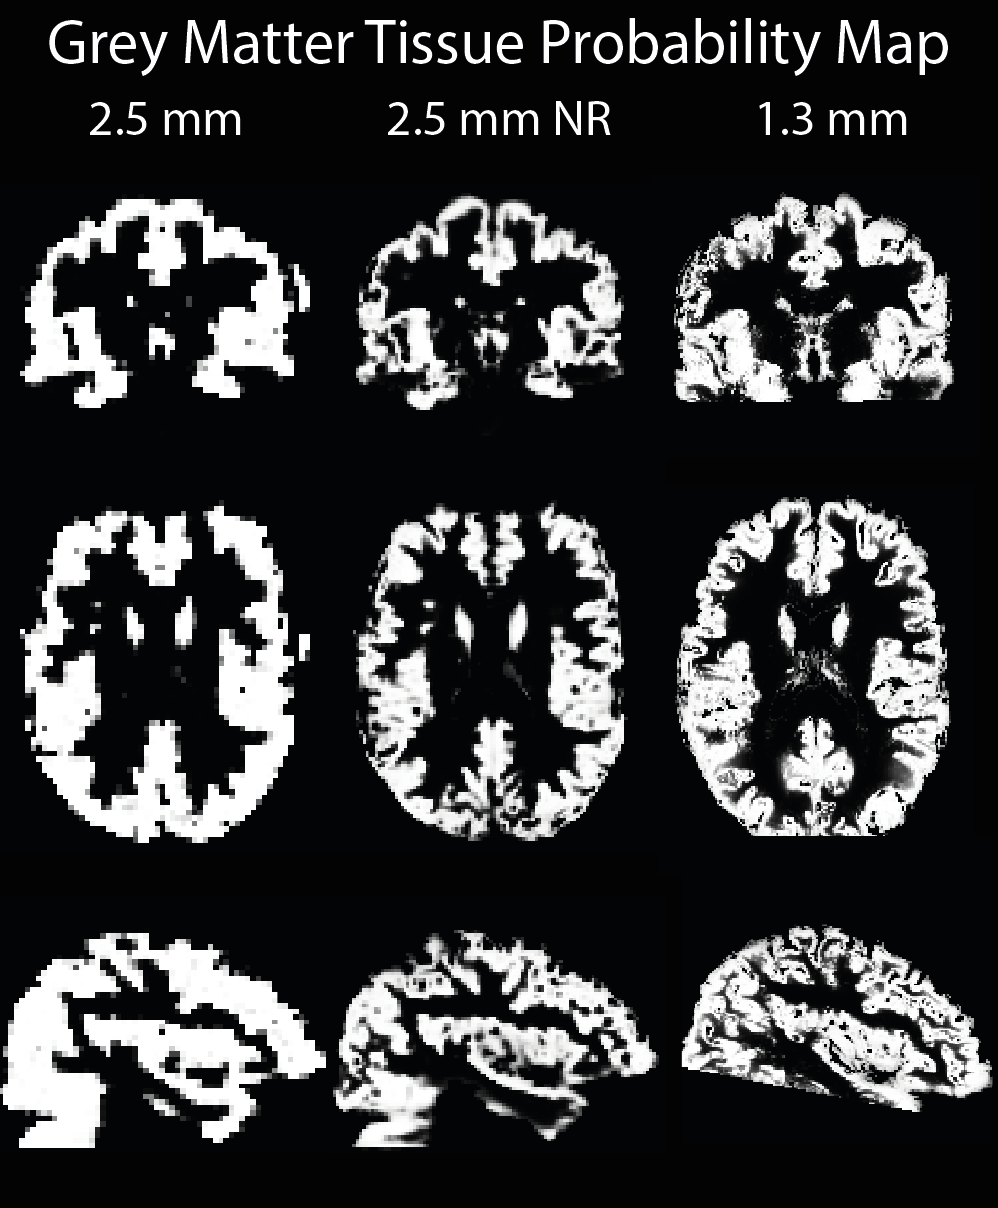
Mean images show a reduction in partial volumes effects in the non-linearly realigned acquisition (Figure 1). Highest voxel-wise tSNR was found in the low resolution acquisition (Figure 2); with only a small reduction in the non-linearly realigned acquisition. For the high-resolution acquisition, voxel-wise tSNR was approximately halved. The segmentation results show a better delineation of the cortical sheet in the non-linearly realigned acquisition, with similar anatomical features as the high resolution acquisition (Figure 3). Activated regions follow the cortical folding, and individual gyri can be more easily identified in the non-linearly realigned acquisition, similar to the high resolution acquisition (Figure 4). These results need to be compared to other correction methods for non-linear deformation based on dynamic field maps2, which showed superior performance in the presence of large head movement. Finally, the performance of surface-based analysis needs to be evaluated15.Conclusions
Using non-linear realignment4 for individual fMRI images of a single subject we could realign sub-voxel boundaries and reduce partial-volume effects. This allowed an improved segmentation of the cortical sheet and better delineation of the activation pattern. This might facilitate the use of advanced segmentation and coregistration methods by providing higher resolution to differentiate tissue boundaries. Surface-based analysis of fMRI data15, even when acquired with low resolution, could now be performed without the acquisition of additional anatomical templates16.Acknowledgements
SB acknowledges funding from UQ Postdoctoral Research Fellowship grant and support via an NVIDIA hardware grant. MB acknowledges funding from ARC Future Fellowship grant FT140100865. The authors acknowledge the facilities of the National Imaging Facility at the Centre for Advanced Imaging, University of Queensland and the scientific support of Kieran O’Brien, Siemens Ltd, Bowen Hills, Australia.References
1 Friston, K.J., Williams, S., Howard, R., Frackowiak, R.S., Turner, R., 1996. Movement-related effects in fMRI time-series. Magn. Reson. Med. 35, 346–355.
2 Dymerska, B., Poser, B.A., Barth, M., Trattnig, S., Robinson, S.D., 2016. A method for the dynamic correction of B0-related distortions in single-echo EPI at 7T. NeuroImage. doi:10.1016/j.neuroimage.2016.07.009
3 Soellinger, M., 2008. Assessment of intracranial dynamics using MRI. Zurich.
4 Janke, A.L., Ullmann, J.F.P., 2015. Robust methods to create ex vivo minimum deformation atlases for brain mapping. Methods, Spatial mapping of multi-modal data in neuroscience 73, 18–26. doi:10.1016/j.ymeth.2015.01.005
5 Feinberg, D.A., Moeller, S., Smith, S.M., Auerbach, E., Ramanna, S., Glasser, M.F., Miller, K.L., Ugurbil, K., Yacoub, E., 2010. Multiplexed Echo Planar Imaging for Sub-Second Whole Brain FMRI and Fast Diffusion Imaging. PLoS ONE 5, e15710. doi:10.1371/journal.pone.0015710
6 Moeller, S., Yacoub, E., Olman, C.A., Auerbach, E., Strupp, J., Harel, N., Ugurbil, K., 2010. Multiband multislice GE-EPI at 7 tesla, with 16-fold acceleration using partial parallel imaging with application to high spatial and temporal whole-brain fMRI. Magn. Reson. Med. 63, 1144–1153. doi:10.1002/mrm.22361
7 SPM 12, Wellcome Trust Centre for Neuroimaging, London, UK
8 Matlab 2014b, The MathWorks, Inc., Natick, Massachusetts, United States
9 Grabner, G., Janke, A.L., Budge, M.M., Smith, D., Pruessner, J., Collins, D.L., 2006. Symmetric atlasing and model based segmentation: an application to the hippocampus in older adults, in: Medical Image Computing and Computer-Assisted Intervention–MICCAI 2006. Springer, pp. 58–66.
10 Janke, A.L., O’Brien, K., Bollmann, S., Kober, T., Barth, M., 2016. A 7T Human Brain Microstructure Atlas by Minimum Deformation Averaging at 300μm, in: ISMRM. Presented at the ISMRM, Singapore.
11 Collins, D.L., Neelin, P., Peters, T.M., Evans, A.C., 1994. Automatic 3D intersubject registration of MR volumetric data in standardized Talairach space. J. Comput. Assist. Tomogr. 18, 192–205.
12 Ashburner, J., Friston, K.J., 2005. Unified segmentation. NeuroImage 26, 839–851. doi:10.1016/j.neuroimage.2005.02.018
13 Penny, W., Kiebel, S., Friston, K., 2003. Variational Bayesian inference for fMRI time series. NeuroImage 19, 727–741. doi:10.1016/S1053-8119(03)00071-5
14 G. H. Glover, T. Q. Li, and D. Ress, “Image-based method for retrospective correction of physiological motion effects in fMRI: RETROICOR,” Magn. Reson. Med., vol. 44, no. 1, pp. 162–167, Jul. 2000.
15 Khan, R., Zhang, Q., Darayan, S., Dhandapani, S., Katyal, S., Greene, C., Bajaj, C., Ress, D., 2011. Surface-based analysis methods for high-resolution functional magnetic resonance imaging. Graph. Models 73, 313–322. doi:10.1016/j.gmod.2010.11.002
16 Glasser, M.F., Sotiropoulos, S.N., Wilson, J.A., Coalson, T.S., Fischl, B., Andersson, J.L., Xu, J., Jbabdi, S., Webster, M., Polimeni, J.R., Van Essen, D.C., Jenkinson, M., 2013. The minimal preprocessing pipelines for the Human Connectome Project. NeuroImage 80, 105–124. doi:10.1016/j.neuroimage.2013.04.127
Figures