5337
Solution for Cluster Failure: Simple Method to Obtain Spatially Smooth Residuals with nearly Gaussian Auto-Correlation Functions1Department of Radiology & Imaging Sciences, Emory University, Atlanta, GA, United States, 2Department of Neurology, Emory University
Synopsis
Recent studies have shown that cluster-wise family-wise error rate (FWE) corrected inferences made in parametric statistical methods based fMRI studies over the past couple of decades were invalid due to incorrect these methods incorrectly specifying that spatial auto-correlation functions (sACF) of fMRI data had a gaussian shape. In this study we proposed a method to obtain fMRI inferential statistic residuals with gaussian sACF. Results show that this method substantially increases the detection power of group-level inference tests while not significantly changing the voxelwise statistic maps. Additionally it makes inferences based on assumption of gaussian sACF valid again.
Purpose
Purpose
Recent studies 1 have shown that cluster-wise family-wise error rate (FWE) corrected inferences made in parametric statistical methods based fMRI studies over the past couple of decades were invalid; principally because the spatial auto-correlation functions (sACF) of fMRI data had been incorrectly presumed to have a gaussian shape. In fact the residuals from general linear model (GLM) based fMRI activation estimates do not have a gaussian sACF. In this study we propose a method based on the assumption that non-gaussianity of the sACF of the residuals is caused by unmodeled MRI signal from neuronal 2 and physiological 3 processes as well as motion and other artifacts 4. We hypothesized that these unmodeled signal can be approximated with higher dimensional independent components analysis (ICA) based decomposition of the GLM residuals. Subsequent GLM analysis employing these IC approximates as nuisance regressors can then yield spatially smooth residuals that possess the desired gaussian sACF.
Methods
Twenty-one right-handed normal subjects (11 male; median age ~22 yrs) were scanned in a Siemens 3T Tim Trio scanner using a 12-channel array Rx head coil. Informed consent was obtained from all participants. The participants underwent a 7-minute fMRI scan acquired with a sagittal whole-brain gradient echo EPI (TR/TE = 2000/24 ms, FA = 90°, 3x3x3.5mm voxels). The fMRI task paradigm consisted of fifteen 12 sec blocks of body, object, scene, face or scrambled pictures, interspersed with 14 sec periods of fixation. Standard fMRI preprocessing steps were employed including FWHM = 5 mm spatial smoothing. Brain activation was assessed with multiple linear regression (MLR). The 4D residuals time-series dataset (RSDL) was then subsequently decomposed with FSL’s MELODIC program 5 into 100 ICs. We arbitrarily set the dimensionality of the ICA to 100 since this was roughly 5 times the optimal model order estimated by MELODIC; the rationale being such a high order ICA will account for all non-gaussian signal content in the RSDL. Following this the GLM analysis was repeated with simultaneous orthogonalization of the 100 component time-series with MLR.
The sACF of the original RSDL datasets and the IC-orthogonalized residuals datasets (RSDL_ort100IC) was then estimated both at the whole-brain level and within 25-mm radius spherical local neighborhoods across the brain. The sACF was parameterized as sACF(r) = a * exp(-r*r/(2*b*b)) + (1-a)*exp(-r/c), where r is the radius, and a parameterizes the ‘gaussianity’ of the sACF (a varies from 0 to 1); and b and c are other fitted parameters 7. The apparent FWHM (FWHMap) of spatial correlation was also obtained from all sACF calculations. The average sACF across the group was obtained for both the RSDL and RSDL_ort100IC datasets. Cluster-wise FWE corrected p-values were then obtained for a large number of different voxel p-values through Monte Carlo (MC) simulation 6 incorporating these average sACFs through AFNI’s 3dClustSim program 7.
Results and Discussion
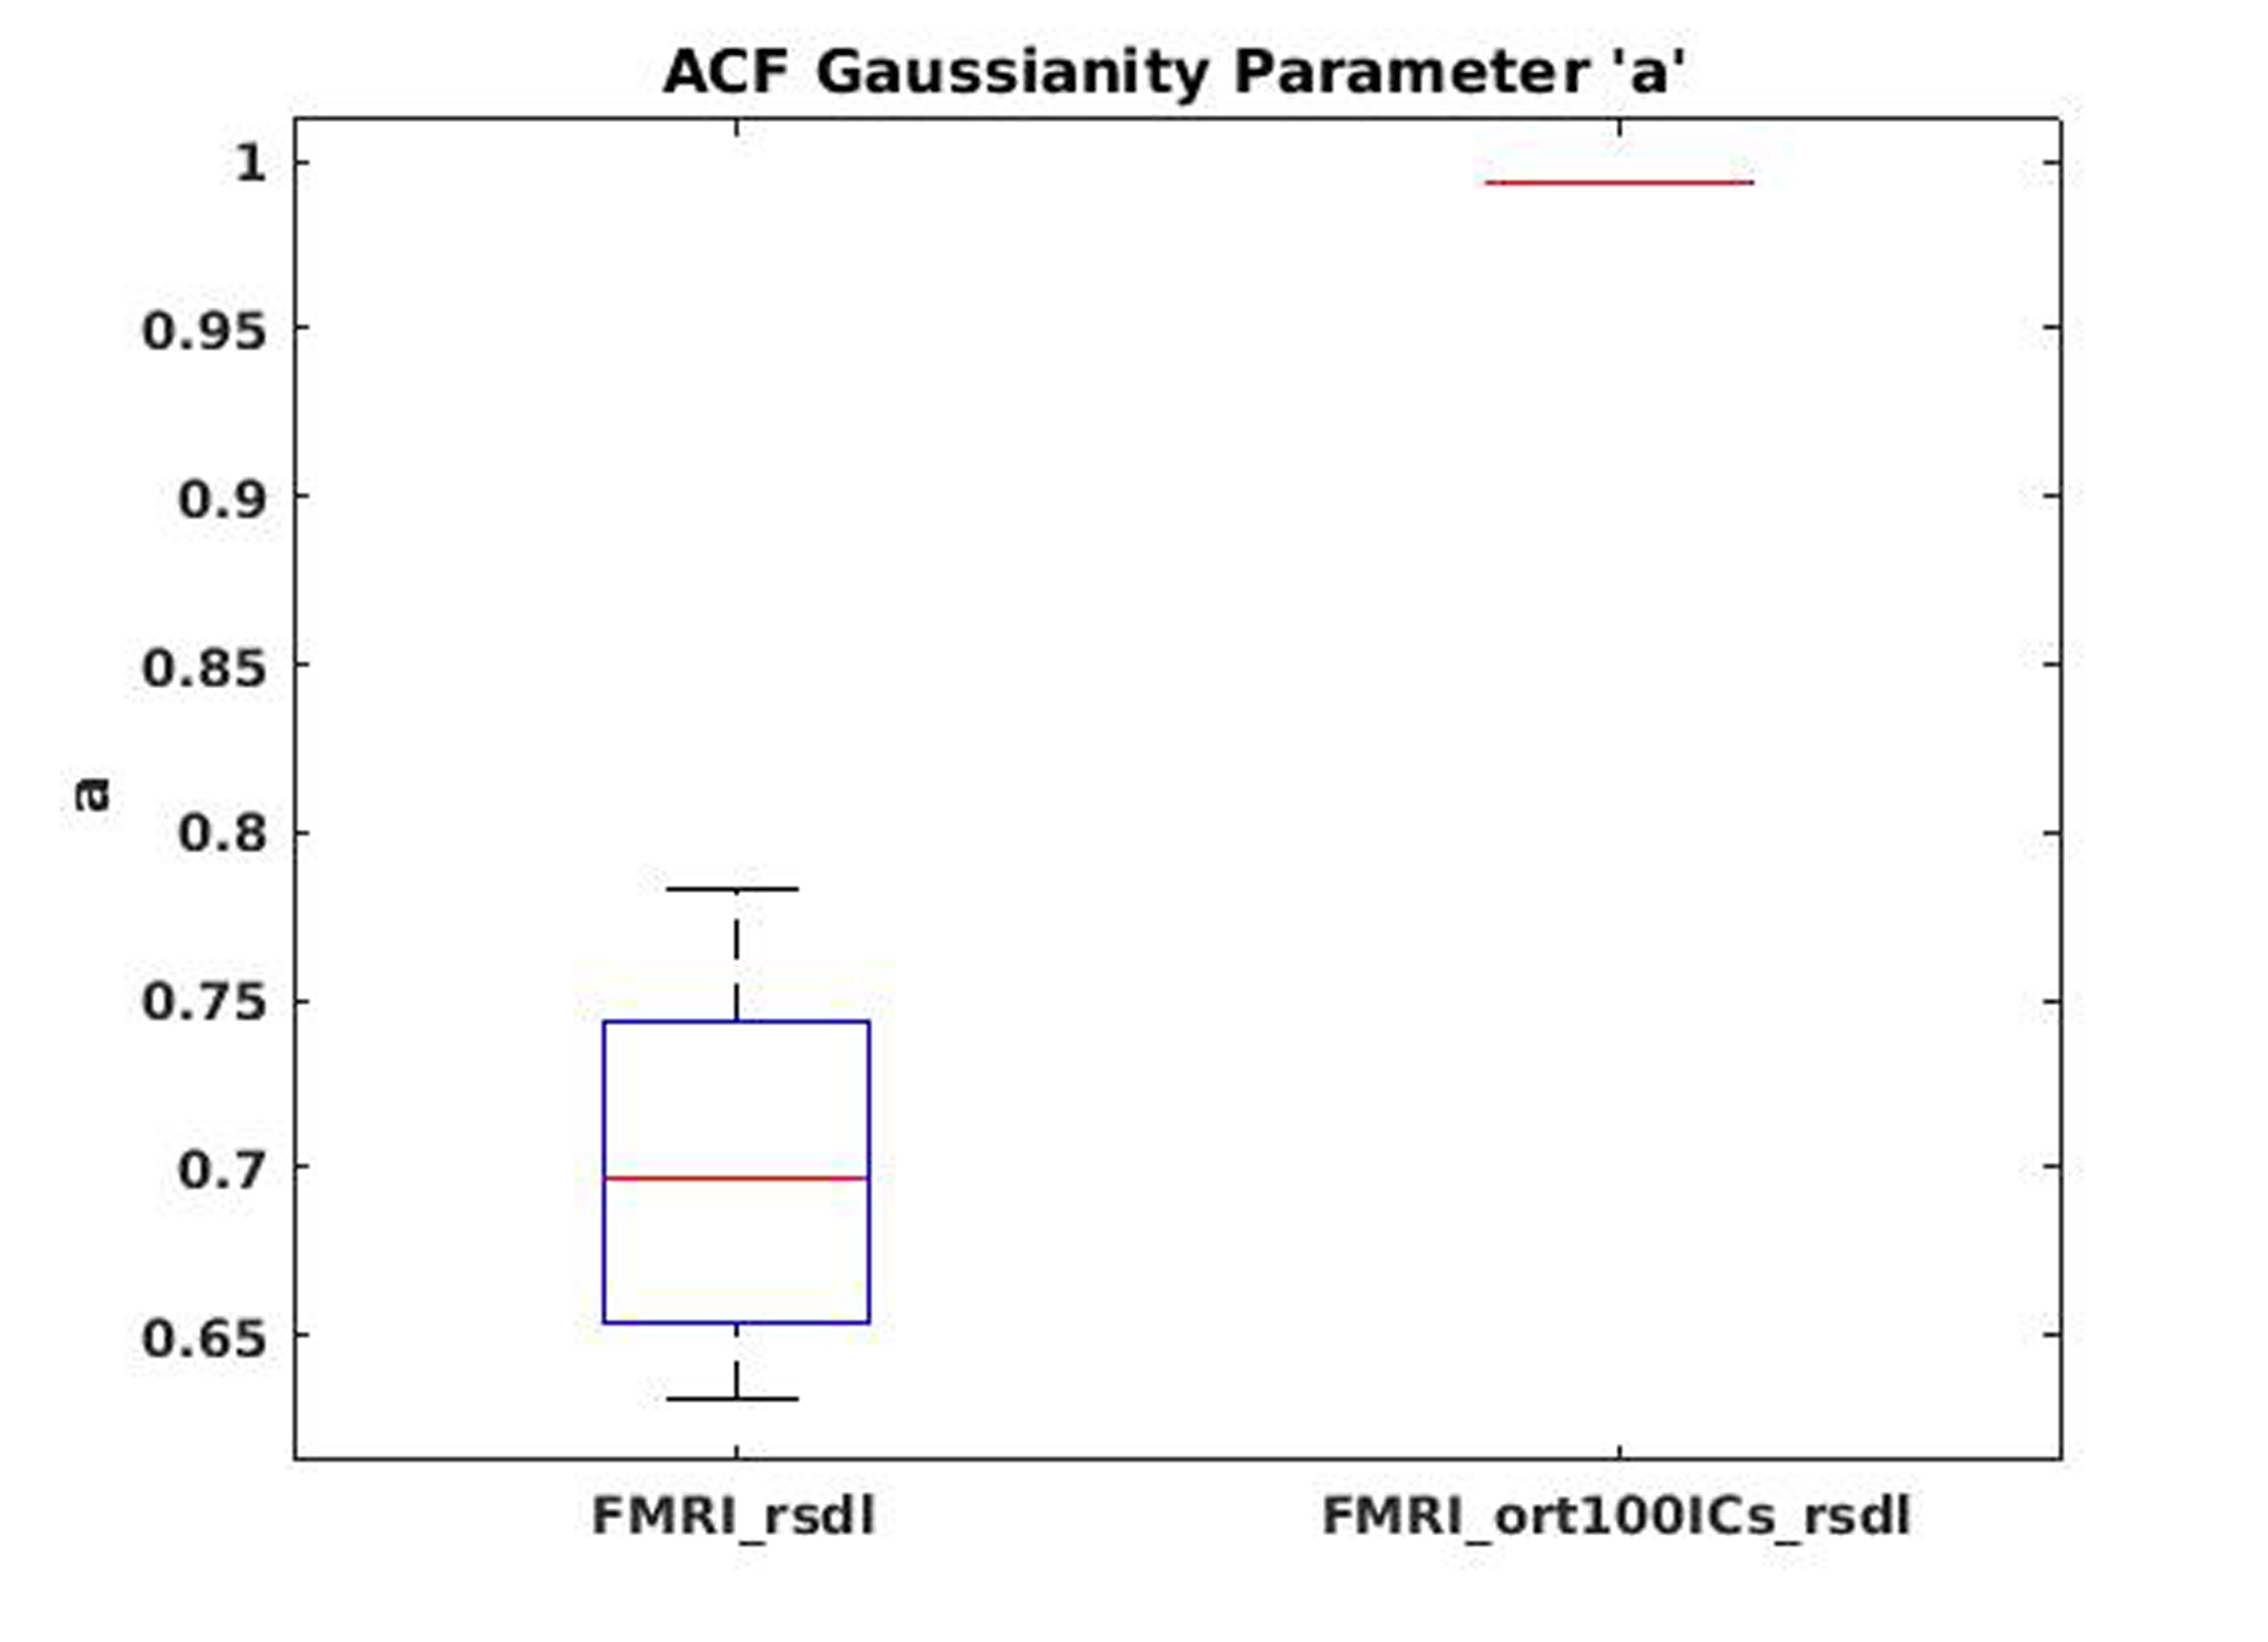
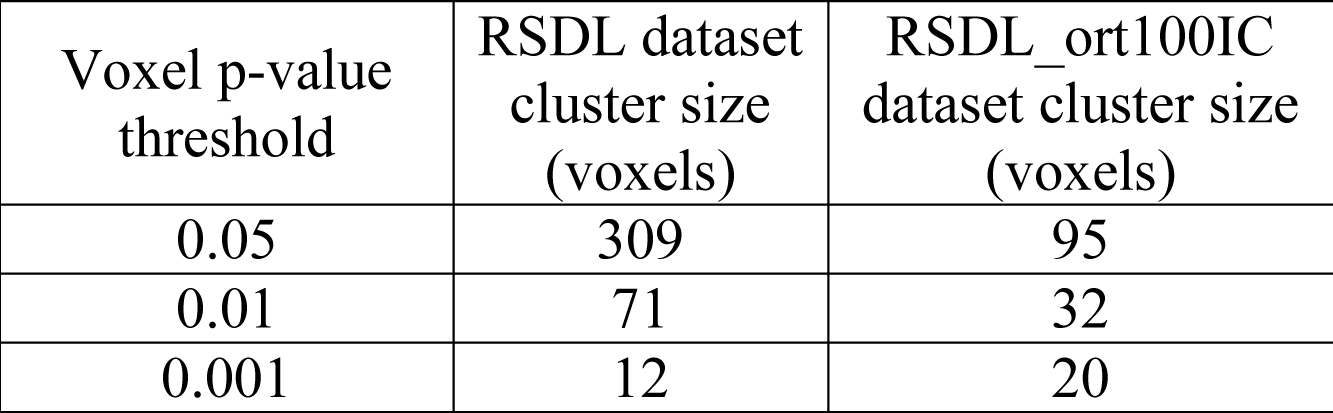
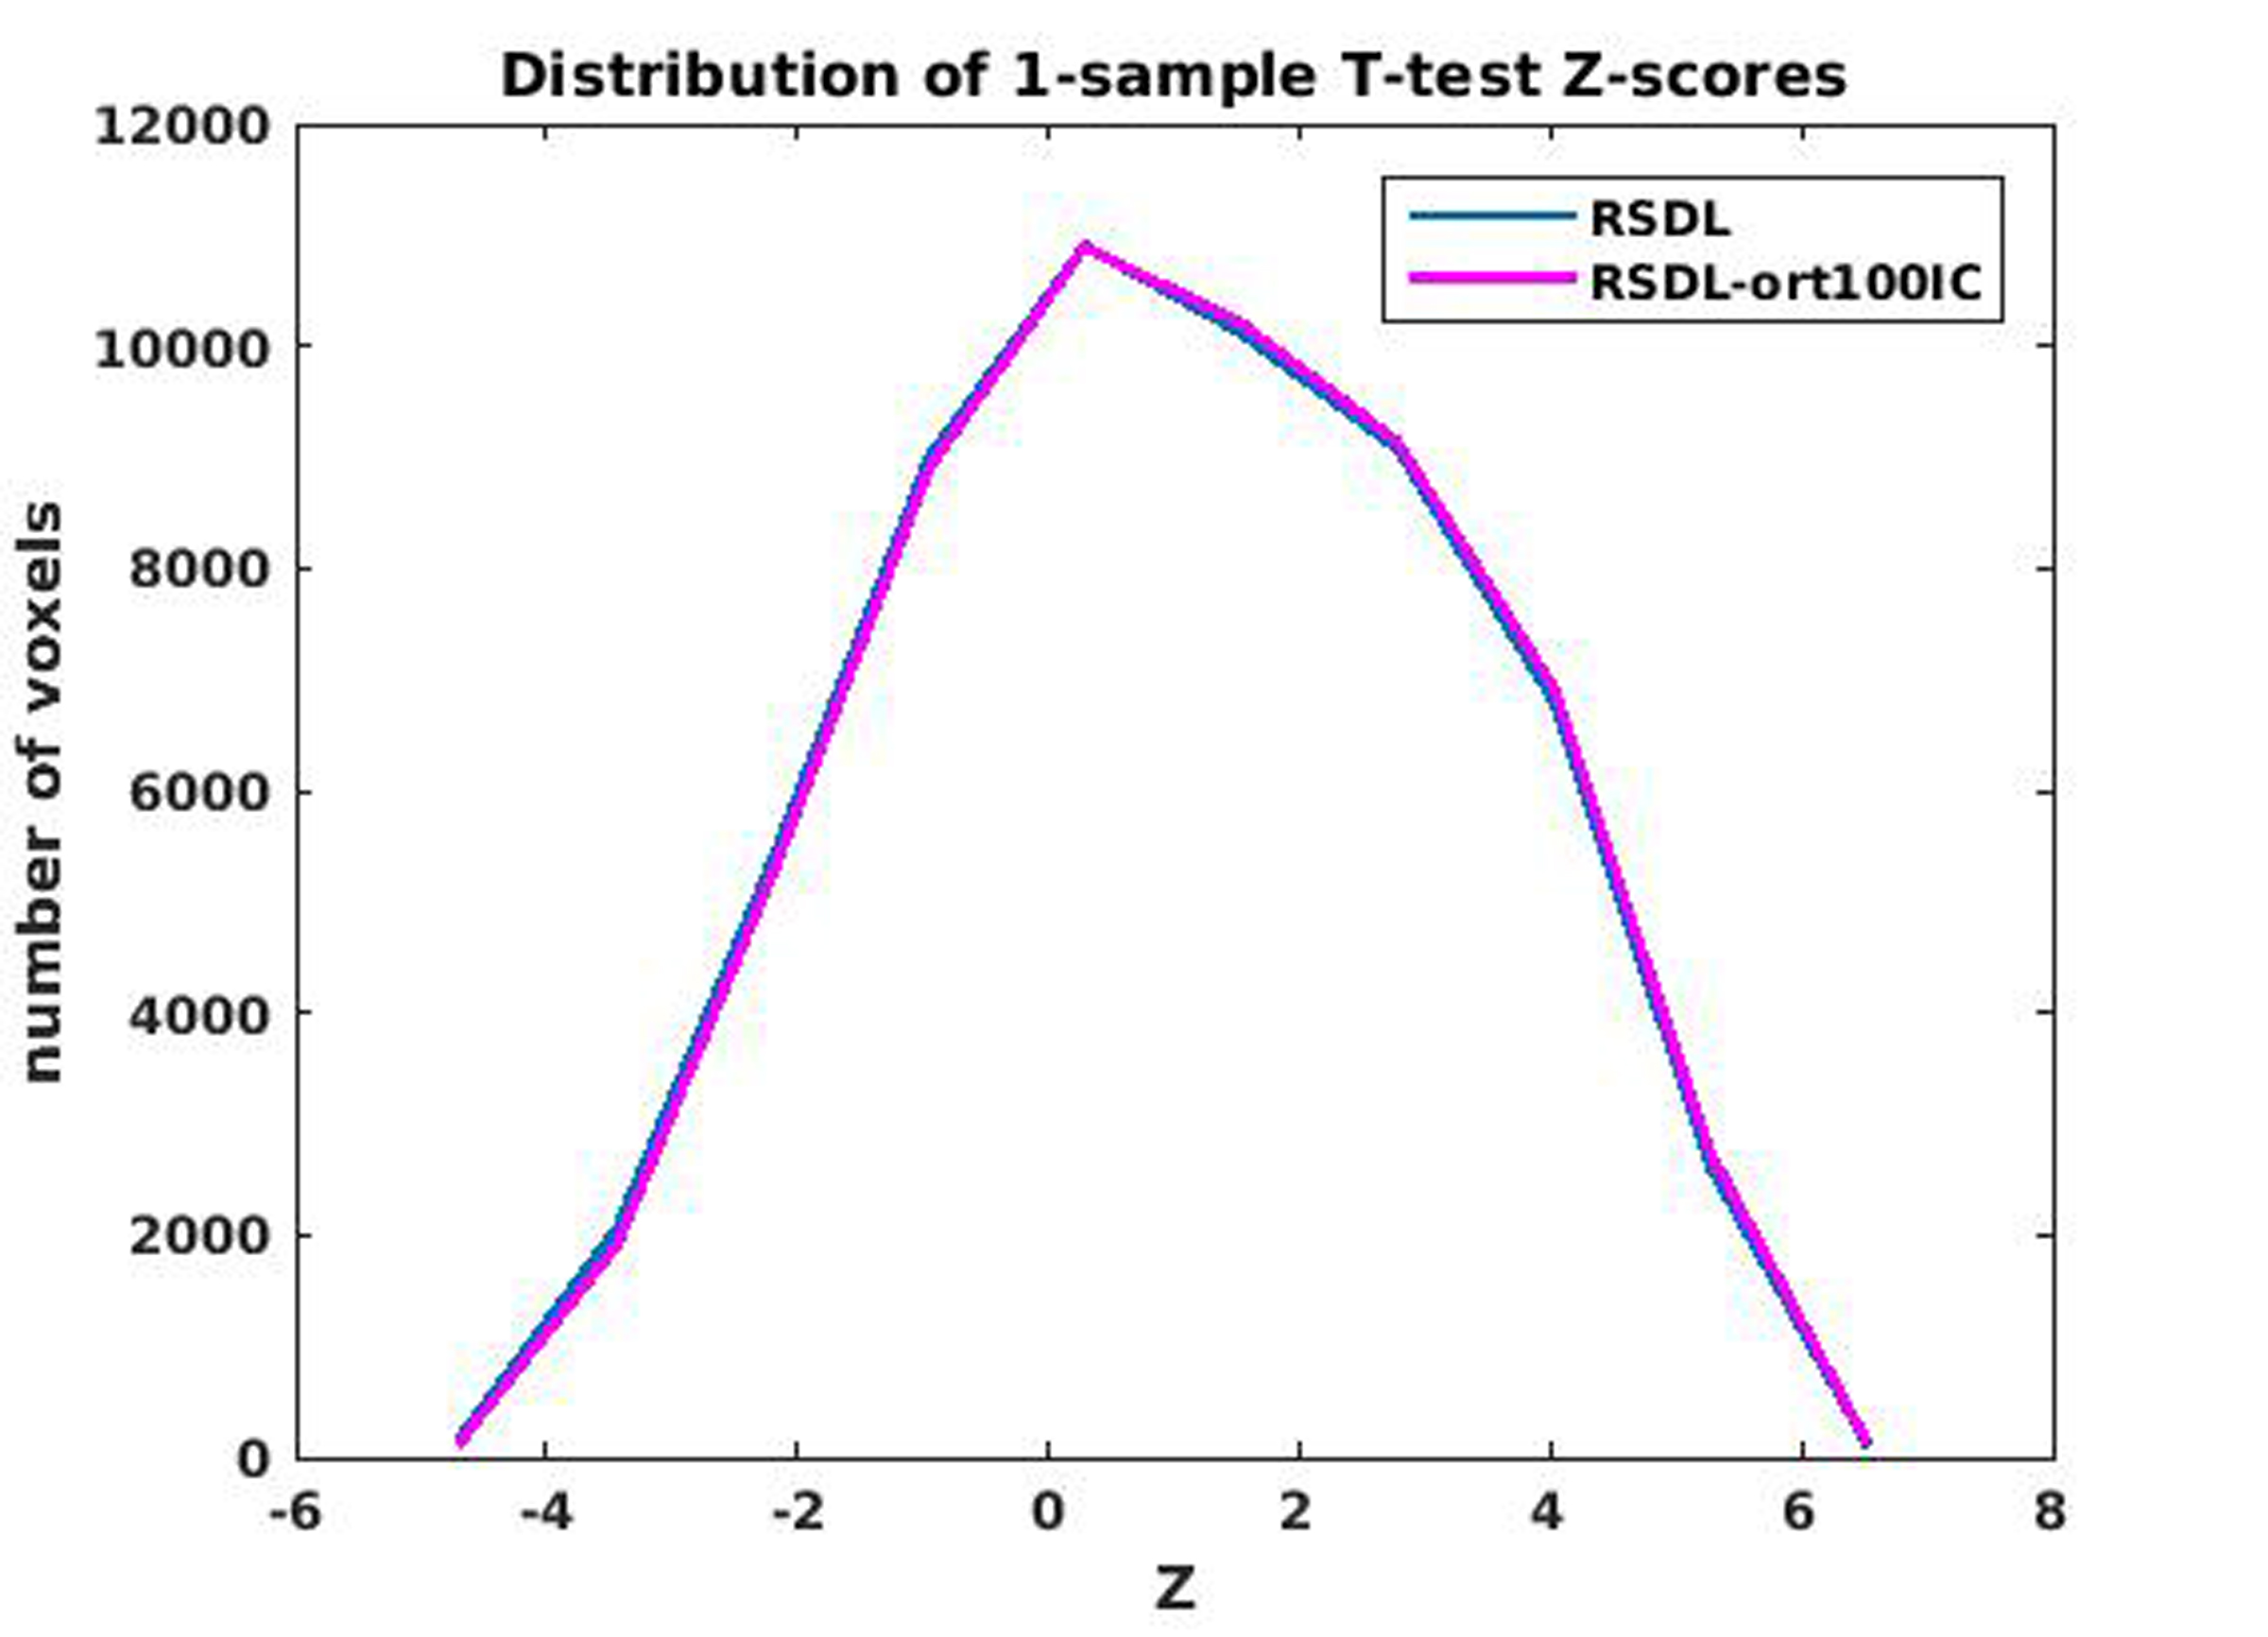
Figure 1 shows the boxplot of sACFs for the individual RSDL and RSDL_ort100IC datasets. As expected the RSDL datasets exhibit significant departure from gaussianity with the sACF a parameter varying from 0.64 to 0.78. On the other hand the RSDL_ort100IC datasets all had the same sACF a-parameter value of 0.994 indicating that IC-orthogonalization procedure rendered the residuals’ sACF gaussian. This is reinforced in Figure 2 which shows the maps of the smoothness (FWHMap) of the residuals datasets. Whereas the RSDL datasets exhibit significant heterogeneity in local FWHMap across the brain, the FWHMap of RSDL_ort100IC datasets is almost uniform. The table in Figure 3 lists the minimum cluster-sizes (calculated through the MC simulation) corresponding to various voxel p-value thresholds at cluster-wise FWE-corrected p < 0.05. The superiority of the IC-orthogonalization procedure is readily apparent. A voxel p-value threshold of 0.05 would require cluster sizes greater than 309 voxels for group-level inference tests made on the original GLM-estimates to be significant at FWE-corrected p < 0.05. Nuisance IC-orthogonalized GLM-estimates would only require a cluster size of 95 voxels for the same threshold. Figure 4 shows that there is no significant difference in the distributions of the 1-sample t-test statistics of the “Body” condition, obtained via the original and IC orthogonalized GLM-estimates. Thus the proposed method of pre-whitening the sACF of residuals does not affect the group-level activation results.Conclusion
In this study we proposed a method to obtain fMRI inferential statistic residuals with gaussian sACF. Results show that this method substantially increases the detection power of group-level inference tests while not significantly changing the voxelwise statistic maps. Additionally it makes inferences based on assumption of gaussian sACF valid again.Acknowledgements
No acknowledgement found.References
1. Eklund A, et al., ’Cluster failure: Why fMRI inferences for spatial extent have inflated false-positive rates.’ Proc Natl Acad Sci U S A. 2016, 12;113(28):7900-5.
2. Fair DA, et al., ’A method for using blocked and event-related fMRI data to study “resting state” functional connectivity.’ Neuroimage 2007, 35(1):396–405.
3. Bianciardi M, et al., ’Sources of functional magnetic resonance imaging signal fluctuations in the human brain at rest: a 7 T study.’ Magn. Reson. Imag. 2009, 27: 1019–1029.
4. Salimi-Khorshidi G, et al., ’Automatic denoising of functional MRI data: Combining independent component analysis and hierarchical fusion of classifiers.’ NeuroImage 2014, 90:449–468.
5. Beckmann C, et al., ’Probabilistic independent component analysis for functional magnetic resonance imaging.’ IEEE Trans Med Imaging. 2004, 23(2):137-52.
6. Forman SD, et al., ’Improved assessment of significant activation in functional magnetic resonance imaging (fMRI): use of a cluster-size threshold.’ Magn Reson Med. 1995;33(5):636-47.
7. https://afni.nimh.nih.gov/pub/dist/doc/program_help/3dClustSim.html
Figures