5335
Quantitative data-driven analysis for resting-state fMRI data reveals functional connectivity differences in epilepsy patients1Medical Radiation and Nuclear Medicine, Karolinska University Hospital, Stockholm, Sweden, 2Department of Clinical Sciences, Intervention and Technology, Karolinska Institute, Stockholm, Sweden, 3Department of Women's and Children's Health, Karolinska University Hospital, Stockholm, Sweden
Synopsis
Quantitative data-driven analysis (QDA) has shown to be robust and intuitive method to extract functional connectivity information from resting-state fMRI data for group-level comparison. In this study, the QDA method is applied to patients suffering from epileptic seizures. Multiple brain regions of significant (p<0.01) differences were detected. The results are consistent with published works in temporal lobe epilepsy and frontal lobe epilepsy in literature using invasive methods. All brain regions experience down-regulation in functional connectivity in epilepsy patients compared to healthy control subjects.
Introduction
Our previously developed quantitative data-driven analysis (QDA)1 for resting-state fMRI data have several advantages: The method is completely data-driven, not requiring any subjective user input parameters; it is also deterministic in calculation and intuitive to comprehend. For group difference studies, it also has the additional strength that the functional connectivity measures QDA outputs can be readily used for group comparison.Aim
The purpose of this study is to characterize differences in functional connectivity between epilepsy patients compared to healthy controls using QDA.Materials and Methods
With ethical permission from the Central Ethical Review Board in Stockholm region, resting-state fMRI measurements were conducted for a total of 22 normal adult subjects (male/female=14/10, age=33.2±13.5), and 36 (male/female=15/20, age=32.8±12.5) patients suffering from epilepsy seizures. All subjects were scanned using a 3T whole-body clinical MRI scanner (TIM Trio, Siemens Healthcare, Erlangen, Germany). A single-shot 2D gradient-recalled echo echo-planar imaging sequence was used with the following acquisition parameters: 32 transverse slices (3.6mm thickness), TR/TE=2500/35ms, FOV=220mm, matrix size=64x64, flip angle=90°, 185 dynamic timeframes, IPAT=2. A 32-channel phased-array head coil was used for the signal reception. Foam padding were used to for every subject reduce the head motions. During the resting-state fMRI scans the participants were instructed to close their eyes but not fall asleep, they were also instructed to not think about anything specific during the resting-state fMRI scans.
For each subject, we compute the Pearson’s cross-correlation coefficients (CC) of the post-processed resting-state fMRI time course of all voxels inside a brain mask with that of every other voxel. For each voxel, we compute the following QDA output maps: (1) Connection Strength Index (CSI) which is defined as the non-zero mean value of CC ≥ 0.3 for all voxel pairs involving the current voxel in question; (2) Connection Count Index (CCI) which is defined as the number of voxel pairs involving the current voxel in question with CC ≥ 0.3.
Two-way, unpaired Welch’s t-tests were performed on the CCI and CSI maps to reveal regions of significant differences in functional connectivity between healthy control and epilepsy patients. For multiple comparison correction, a minimum cluster size of ≥20 contiguous voxels were enforced for all regions of significant difference (p<0.01).
Results
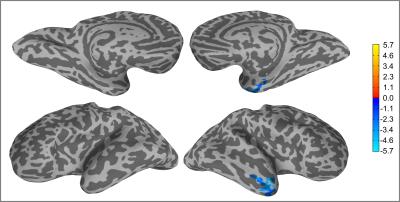
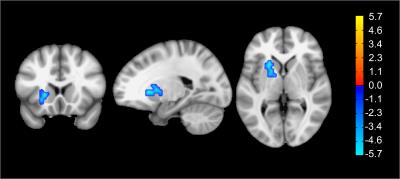
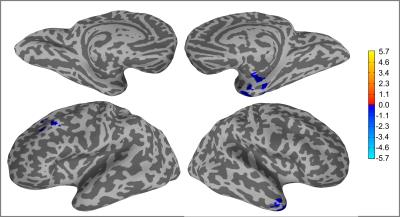
Two-way unpaired Welch’s t-tests for the QDA output maps CCI and CSI between epilepsy patients and healthy controls reveals significant (p<0.01) differences in multiple brain regions between the two groups. All regions showing group-level differences are detailed in figure 1. The Middle Temporal Gyrus (Brodmann Area 21, BA21) only brain region showing differences at group level for in both CCI and CSI. It is also the only brain region for CCI that presents group-level differences (figure 2). For CSI, there are additional brain regions displaying group-level differences in the Left Lentiform Nucleus (figure 3), Left Precentral Gyrus (Left BA9), and Left Superior Frontal Gyrus (figure 4).
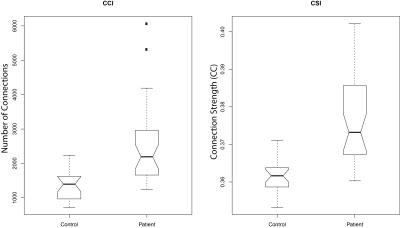
Boxplots of the extracted mean CCI and CSI values of all respective brain regions of significant group-level differences (p<0.01) shows clear down-regulation of functional connectivity in these brain regions for the epilepsy patients compared to healthy controls (figure 5).
Discussion
At the right Temporal Pole, the Anterior Middle Temporal Gyrus shows consistent differences at group-level in both CCI and CSI. This region has been known to be associated with temporal lobe epilepsy and partial epilepsy2, 3, and a common surgical target in treatment of temporal lobe epilepsy4. There is also evidence correlating abnormalities in the Lentiform Nucleus to temporal lobe epilepsy5, which is reflected in our CSI results. Furthermore, the Precentral Gyrus, and Superior Frontal Gyrus are commonly associated with frontal lobe epilepsy6. The diverse brain regions may be attributed to the heterogenous patient group in this study. We are currently working better characterizing the patient group by sub-dividing the patient-group into its finer clinical diagnosis. More homogenous patient groups should hopefully lead to more specific characterization of brain regions associated with different types of epileptic seizures.Conclusion
Our QDA framework can detect group-level differences in functional connectivity between healthy controls and epilepsy patients. The brain regions exhibiting group-level differences are consistent with known regions affected in patients suffering from epileptic seizures published in literature. All relevant regions display down-regulation in functional connectivity for epilepsy patients compared to healthy controls.Acknowledgements
This study was conducted with research funding from ALF medicine, Stockholm, Sweden.References
1. Nordin LE, Moller MC, Julin P, Bartfai A, Hashim F, Li TQ. Post mTBI fatigue is associated with abnormal brain functional connectivity. Scientific reports 2016; 6: 21183.
2. Abel TJ, Woodroffe R, Moritani T, et al. 323 The Role of the Temporal Pole in Temporal Lobe Seizure Networks: An Intracranial Electrode Investigation. Neurosurgery 2016; 63 Suppl 1: 194.
3. Kahane P, Chabardes S, Minotti L, Hoffmann D, Benabid AL, Munari C. The role of the temporal pole in the genesis of temporal lobe seizures. Epileptic disorders : international epilepsy journal with videotape 2002;
4 Suppl 1: S51-8.4. Di Gennaro G, D'Aniello A, De Risi M, et al. Temporal pole abnormalities in temporal lobe epilepsy with hippocampal sclerosis: Clinical significance and seizure outcome after surgery. Seizure 2015; 32: 84-91.
5. Kimiwada T, Juhasz C, Makki M, et al. Hippocampal and thalamic diffusion abnormalities in children with temporal lobe epilepsy. Epilepsia 2006; 47(1): 167-75.
6. Kellinghaus C, Luders HO. Frontal lobe epilepsy. Epileptic disorders : international epilepsy journal with videotape 2004; 6(4): 223-39.
Figures


Figure 2: Brain regions with statistical significant differences in CCI between healthy controls and epilepsy patients (p<0.01).

Figure 3: Brain region in the left Lentiform Nucleus with statistical significant differences in CSI between healthy controls and epilepsy patients (p<0.01). The cross-hair is centered at the voxel with highest t-score in the cluster.

Figure 4: Brain regions with statistical significant differences in CSI between healthy controls and epilepsy patients (p<0.01). The inflated brain surface mapping is unable to show brain regions located in the Left Lentiform Nucleus, which is shown separately as representative slices in figure 2.
