5334
A Novel Multiband Multi-Echo Simultaneous ASL/BOLD Sequence for Task-Based fMRI1Radiology, Medical College of Wisconsin, Milwaukee, WI, United States
Synopsis
A novel multiband multi-echo ASL sequence was employed to collect high-resolution, whole-brain simultaneous ASL/BOLD fMRI data. Four echoes were collected allowing multi-echo independent component analysis (ME-ICA) denoising to be applied to both the BOLD and ASL data. Subjects performed a finger-tapping task, and activation was compared between datasets with and without denoising. The multi-echo denoised BOLD dataset detected the most activation compared to activation calculated using the combined echoes and only the second echo. Additional activation was observed for the denoised perfusion-weighted data compared to the original perfusion-weighted data. There was also less spurious negative activation for the PWDN data.
Purpose
In this study, multiband (MB), multiecho (ME), and pseudocontinuous arterial spin labeling (pCASL) imaging were combined into one novel MBME ASL/BOLD sequence. This sequence allowed for high resolution, whole-brain ASL and BOLD images to be collected simultaneously in one acquisition. In addition, multi-echo data allowed multi-echo independent component analysis (ME-ICA) denoising to be applied to remove non-BOLD signal artifacts from BOLD data1,2. Moreover, the ME-ICA technique was modified to include automated ASL denoising to remove non-ASL signals. Task fMRI data was acquired and compared between datasets with and without ME-ICA denoising.Methods
Seven healthy subjects were imaged on a GE 3T MR750 system. A high-resolution T1-weighted MPRAGE anatomical image was collected for co-registration with the functional images. Subjects underwent one fMRI MBME ASL/BOLD acquisition, which incorporated an unbalanced pCASL labeling scheme with labeling time=1.5s, post-labeling delay (PLD)=1.5s, and an EPI readout. Additional parameters were: TE=9.1,25,39.6,54.3ms, TR=4.0s, in-plane R=2, MB-factor=4, number of excitations=9 (total slices=9x4=36), FOV=240mm, resolution=3x3x3 mm3, FA=90°, Scans lasted approximately 10 minutes. Subjects performed a finger-tapping task with a block-designed paradigm consisting of alternating periods of rest and bilateral finger tapping lasting 10 TRs each. Preprocessing of each echo included volume registration, detrending, and blurring with a 4.5mm FWHM Gaussian kernel. The anatomical MPRAGE and functional images were co-registered and then transformed into the standard MNI space. A perfusion-weighted (PW) timeseries was also generated from the first echo (TE=9.1ms) using the surround subtraction method3.
BOLD denoising was performed using AFNI. First, echoes were combined using the T2*-weighted approach4,5. Following echo combination, the data was denoised using the automated ME-ICA technique (meica.py)1,2, which classifies independent components as BOLD or non-BOLD based on whether or not their amplitudes are linearly dependent on TE1,2. Components deemed non-BOLD were then regressed from the data.
In order to denoise the PW images, the ME-ICA algorithm was modified. First, a lowpass filter with frequency cutoff just below the label/control oscillation frequency (for TR=4s, f=1/2TR=0.125 Hz) was applied to all echoes. Then, a separate ME-ICA analysis was conducted on the filtered data. Components were classifed as BOLD, artifactual non-BOLD and R2*-weighted, and indeterminate. The artifactual and BOLD components were removed from the original, unfiltered first-echo data.
Five datasets for each scan underwent further processing: individual echo (E2, TE=25ms), multi-echo combined (MEC), multi-echo combined, denoised (MECDN), perfusion-weighted (PW), and perfusion-weighted denoised (PWDN). For the SE and ME data, six rigid-body motion parameters and label/control oscillations were regressed from the data.
For the task-based fMRI analysis, a general linear model (GLM) was used. Individual activation maps were thresholded at P<0.01 (minimum cluster size of 52 voxels, α<0.05). For each dataset a group analysis was performed using a one-sample t-test. Group maps were thresholded at P<0.05 (minimum cluster size of 172 voxels, α<0.05). Temporal SNR (tSNR), defined as the mean signal divided by the standard deviation of the noise across the timeseries, was computed. Mean whole-brain tSNR was extracted. In addition, mean t-score was computed for each subject in voxels that were active for all datasets.
Results
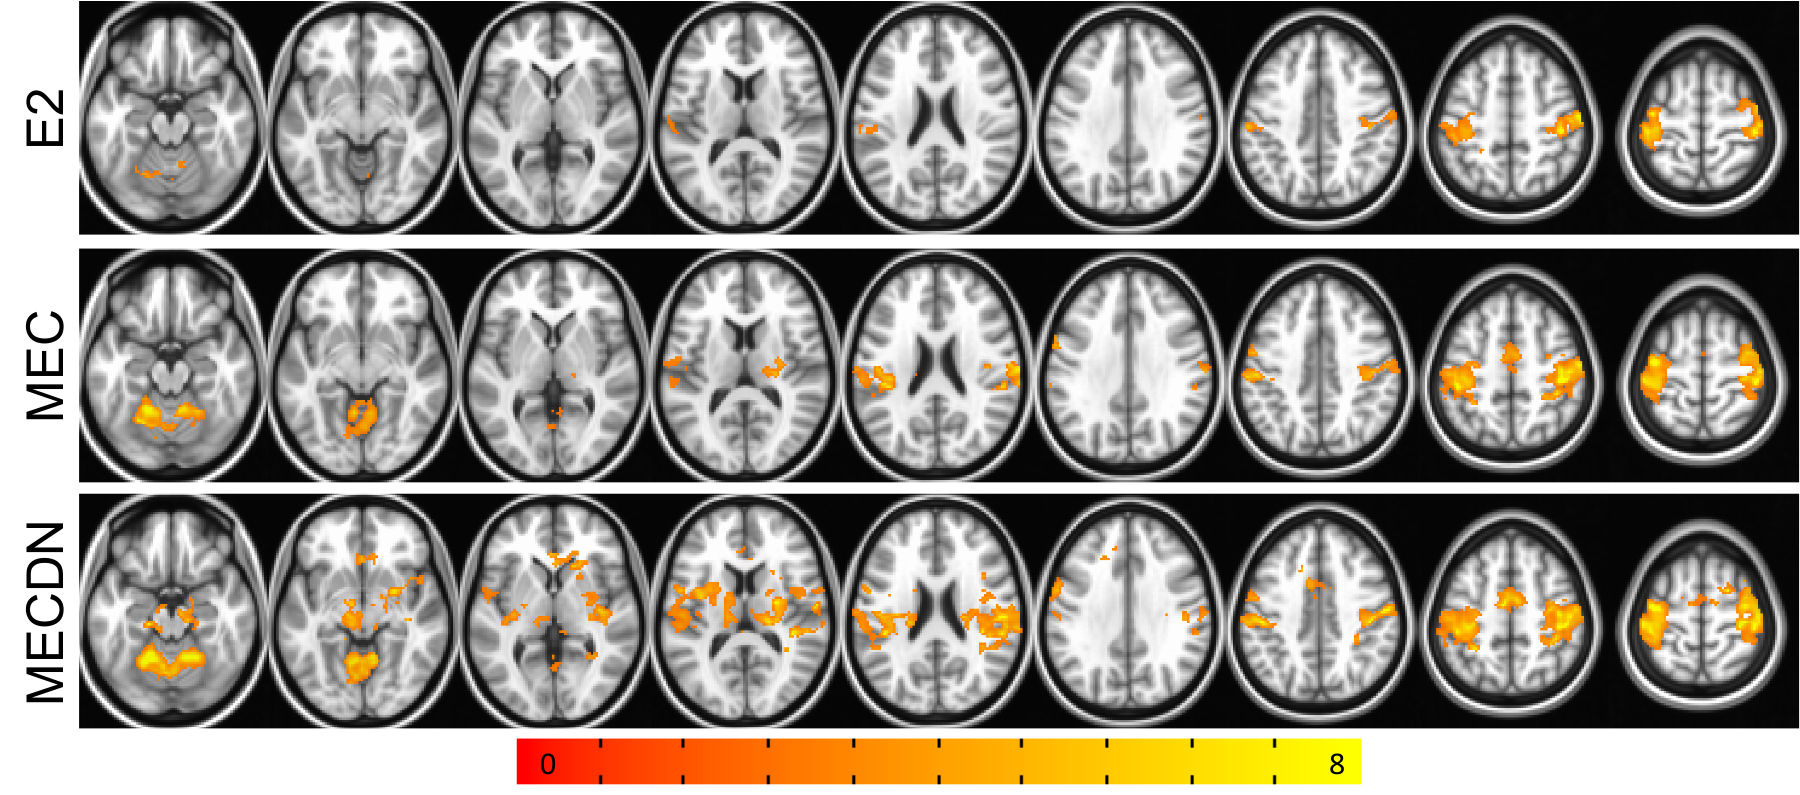
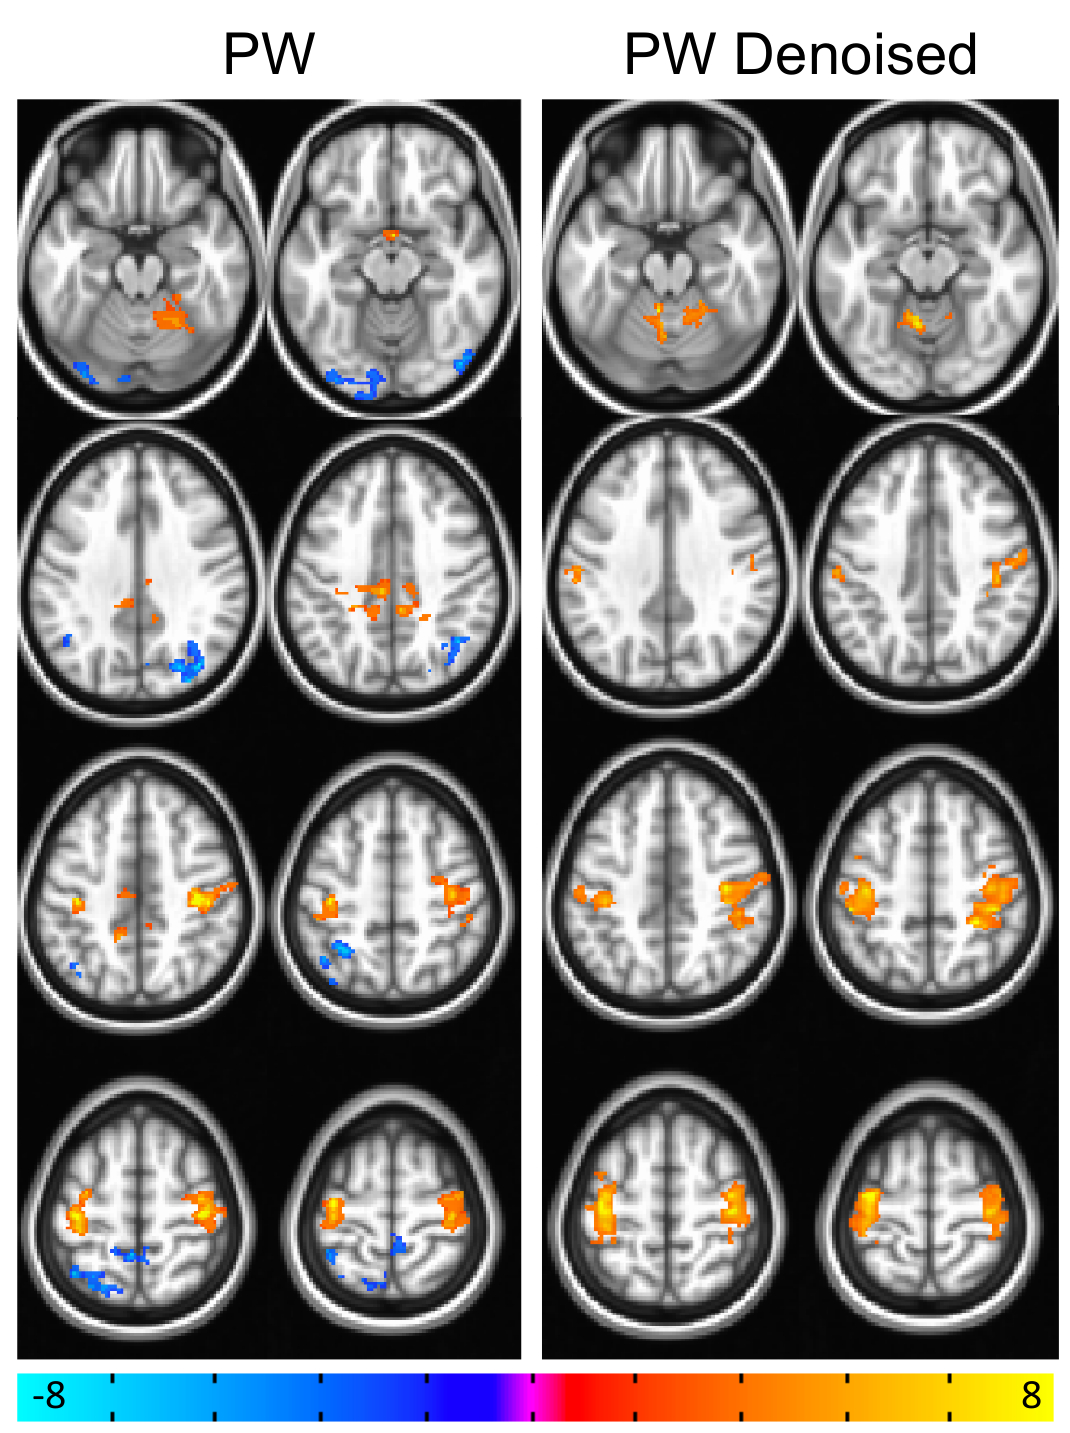
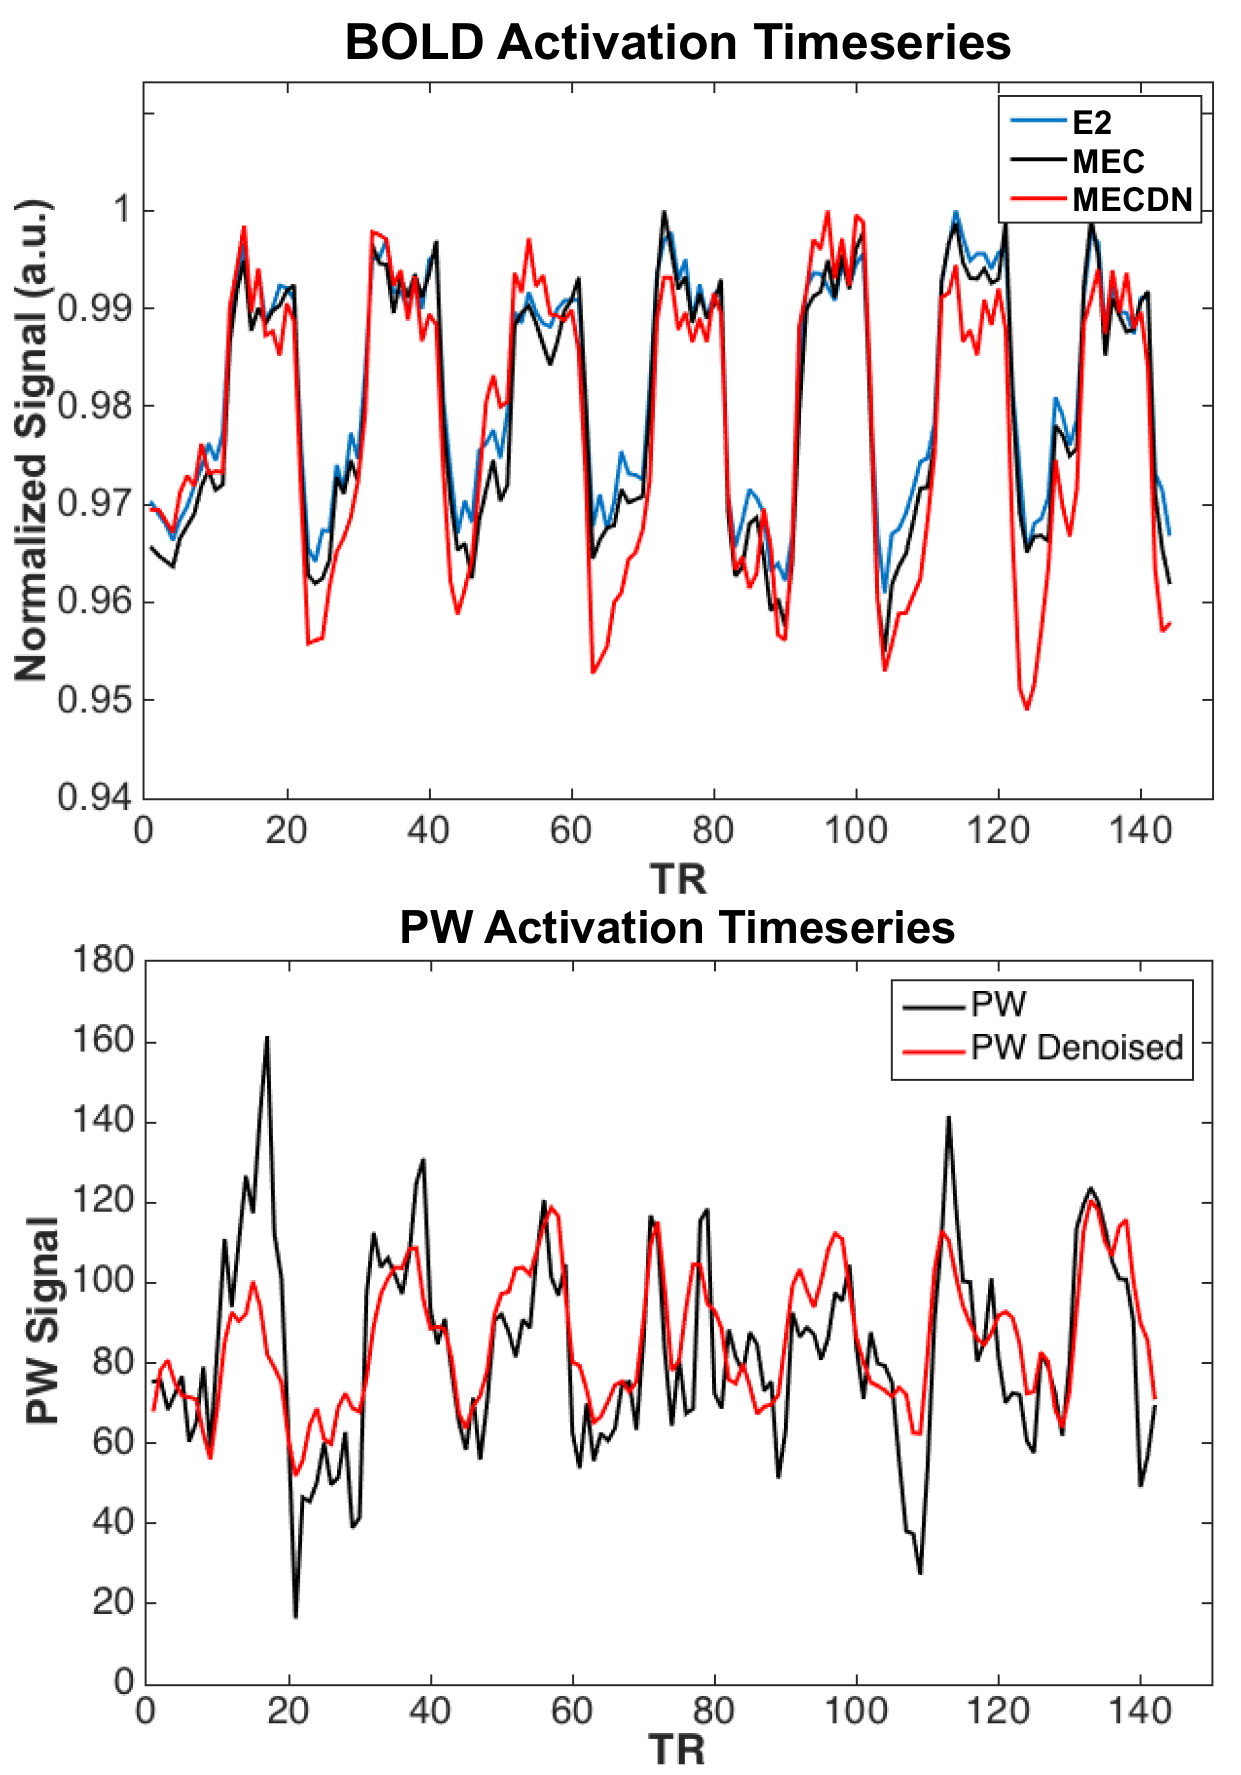
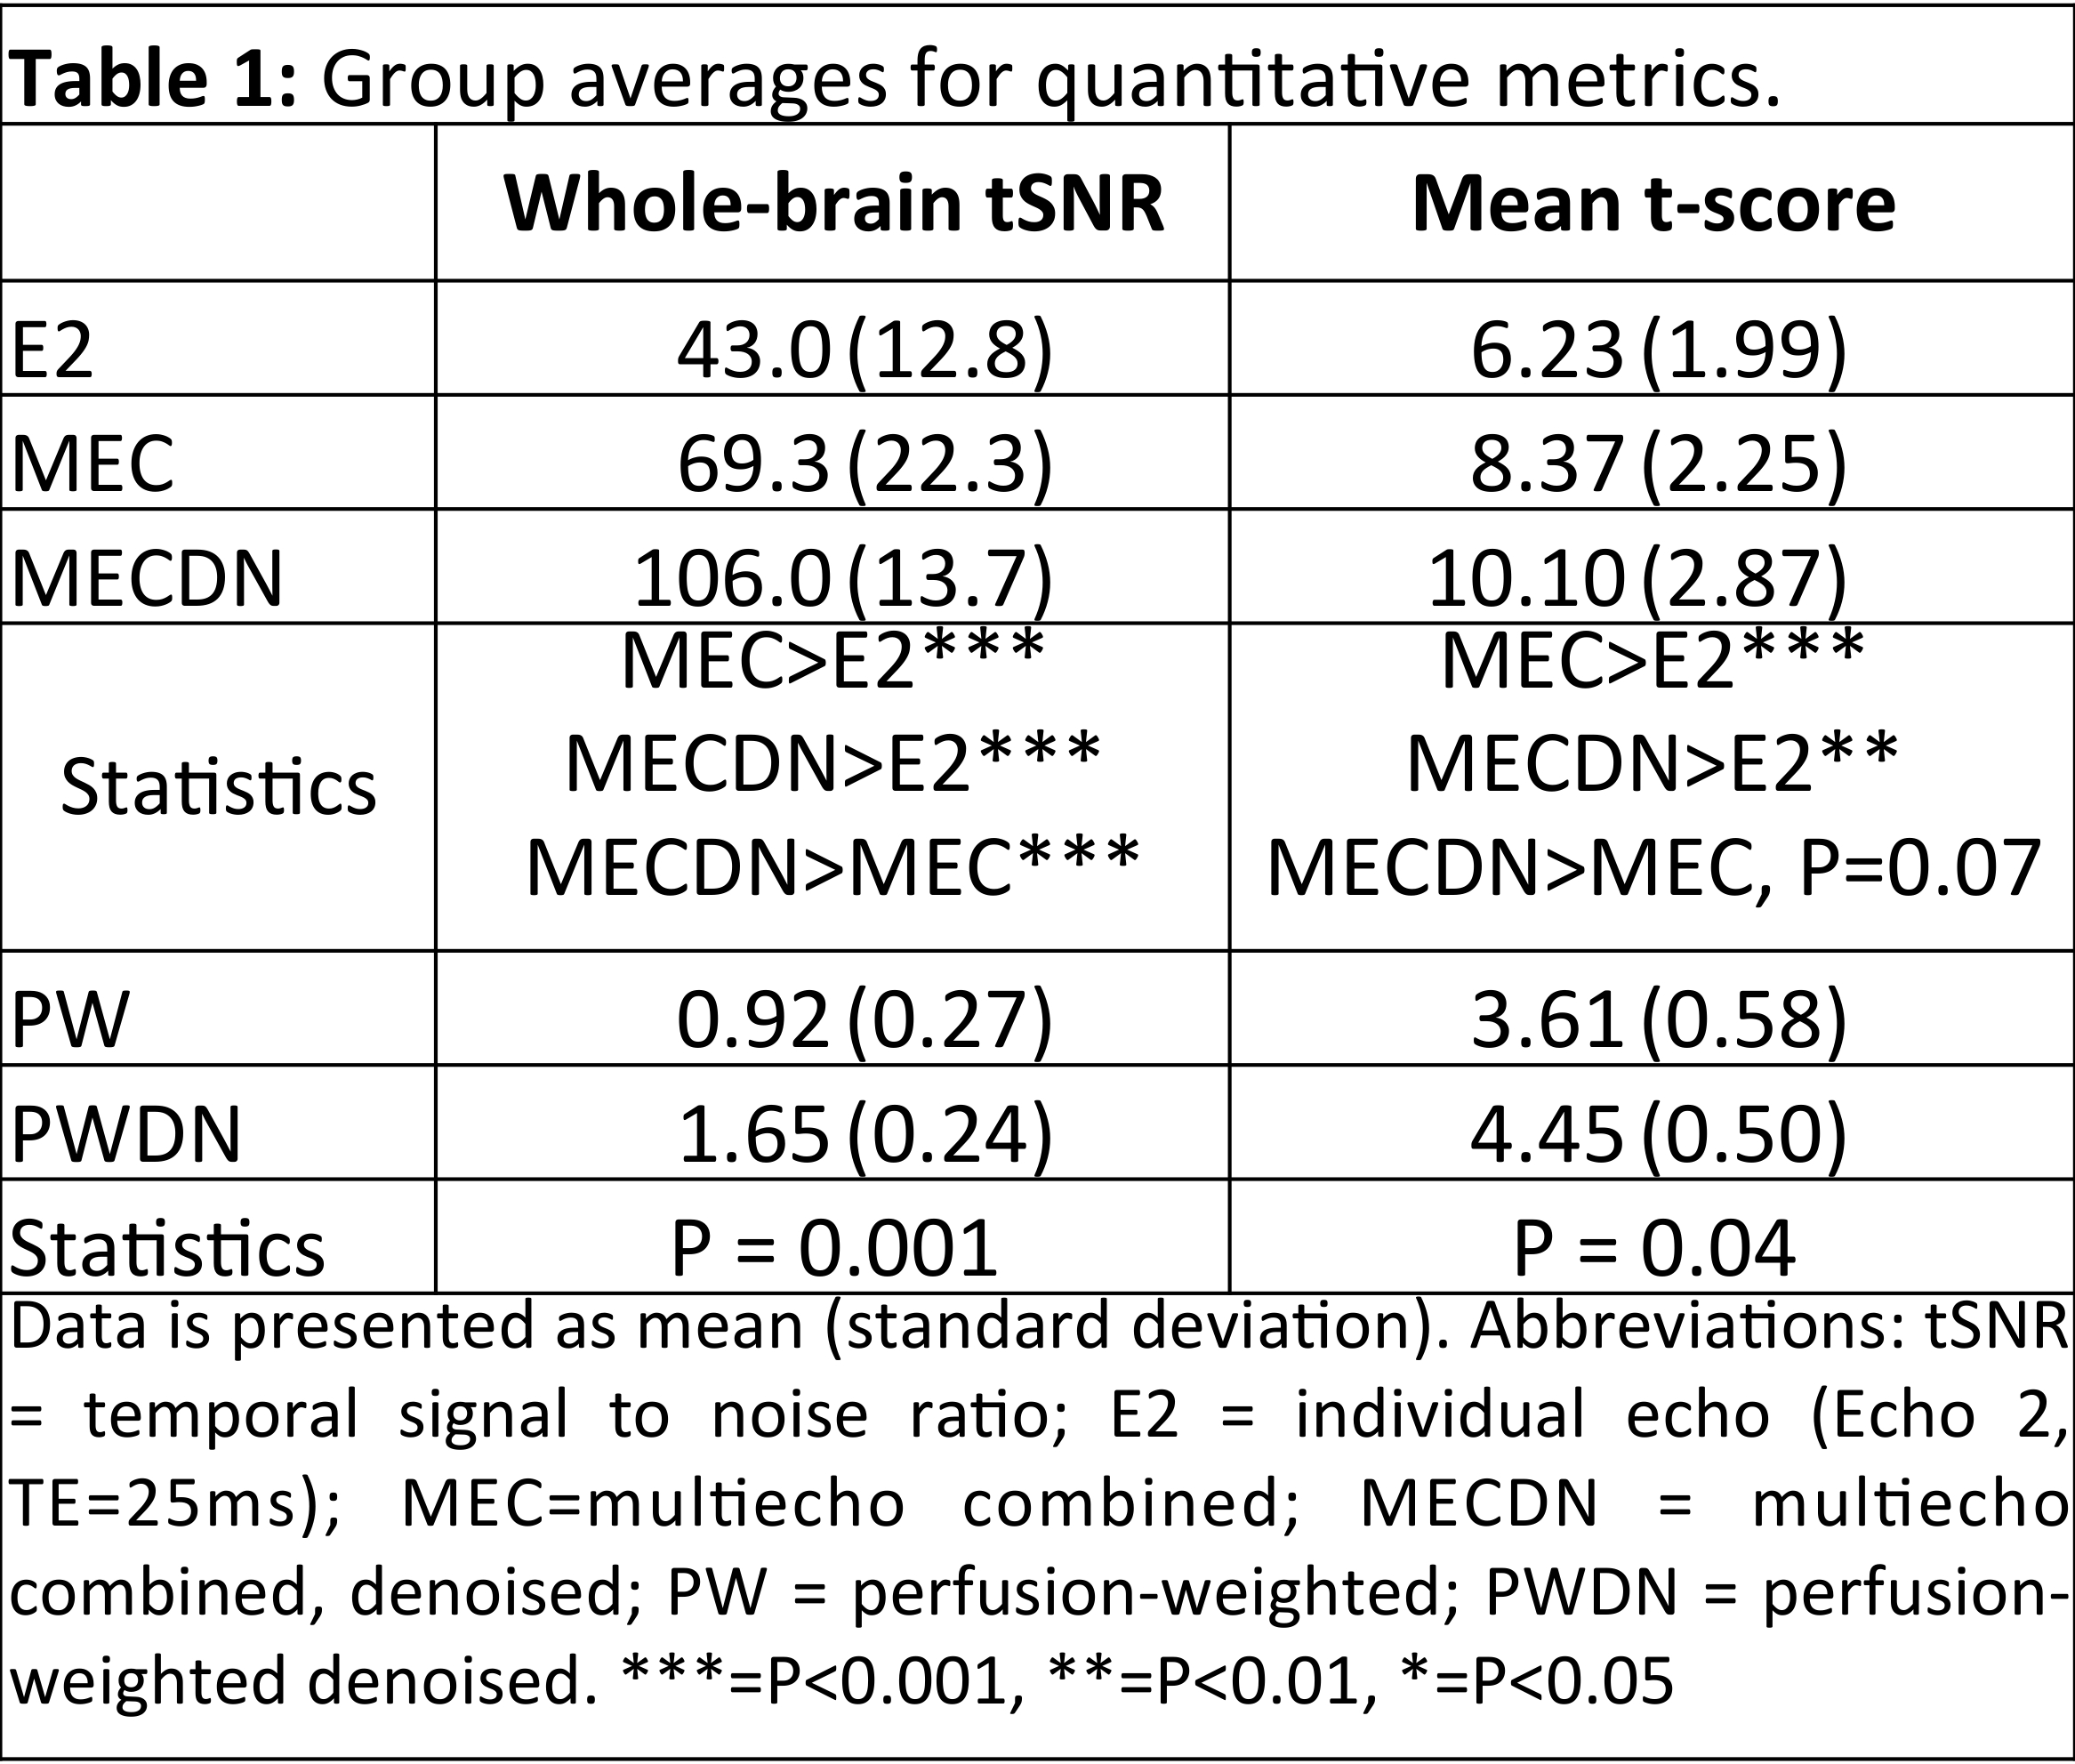
BOLD results from the group finger tapping fMRI analysis are shown in Figure 1. The MECDN dataset detected the most activation. PW results are shown in Figure 2. Additional activation is observed for the PWDN data compared to the PW data. There is also less spurious negative activation for the PWDN data. Figure 3 shows mean activation signal from one representative subject for the BOLD and PW datasets. The PWDN timeseries appears less noisy than the PW timeseries. Whole-brain tSNR was largest for the MECDN data. tSNR significantly increased for the PWDN data compared to the PW data. Mean t-score was highest for the MECDN data, and significantly increased for the PWDN data versus the PW data (Table 1).Discussion/Conclusions
All echoes were used in the echo combination and ME-ICA denoising process. This could lead to possible contamination by the more heavily perfusion-weighted first echo; however, this signal was identified as a non-BOLD component by the ME-ICA algorithm and removed from the data. This became an issue for ASL denoising where the label/control oscillation was the signal of interest. To address this, echoes were lowpass filtered below the label/control oscillation frequency, preventing PW components from being removed. The collection of more than two echoes allowed for ME-ICA denoising to be applied to both the BOLD and PW data, resulting in the detection of more activation and increased tSNR. This also means shorter timeseries are needed to detect activations with similar effect size6, and can compensate for the longer TR inherent in pCASL acquisitions.Acknowledgements
This work was partially supported by a grant from the Daniel M. Soref Charitable Trust. We thank Ajit Shankaranarayanan and Matt Middione from GE Healthcare for providing source code of the GE multiband sequence.References
1. Kundu P, Brenowitz ND, Voon V, Worbe Y, Vertes PE, Inati SJ, Saad ZS, Bandettini PA, Bullmore ET. Integrated strategy for improving functional connectivity mapping using multiecho fMRI. Proc Natl Acad Sci U S A 2013;110(40):16187-16192.
2. Kundu P, Inati SJ, Evans JW, Luh WM, Bandettini PA. Differentiating BOLD and non-BOLD signals in fMRI time series using multi-echo EPI. Neuroimage 2012;60(3):1759-1770.
3. Wong EC, Buxton RB, Frank LR. Implementation of quantitative perfusion imaging techniques for functional brain mapping using pulsed arterial spin labeling. NMR Biomed 1997;10(4-5):237-249.
4. Poser BA, Versluis MJ, Hoogduin JM, Norris DG. BOLD contrast sensitivity enhancement and artifact reduction with multiecho EPI: parallel-acquired inhomogeneity-desensitized fMRI. Magn Reson Med 2006;55(6):1227-1235.
5. Posse S, Wiese S, Gembris D, Mathiak K, Kessler C, Grosse-Ruyken ML, Elghahwagi B, Richards T, Dager SR, Kiselev VG. Enhancement of BOLD-contrast sensitivity by single-shot multi-echo functional MR imaging. Magn Reson Med 1999;42(1):87-97.
6. Murphy K, Bodurka J, Bandettini PA. How long to scan? The relationship between fMRI temporal signal to noise ratio and necessary scan duration. Neuroimage 2007;34(2):565-574.
Figures