5333
Group level property of functional correlation tensor can reveal default mode network1MR Research China, GE Healthcare, Beijing, People's Republic of China, 2Center for Medical Device Evaluation, CFDA, Beijing, People's Republic of China, 3Center for MRI Reserch, Peking University, Beijing, People's Republic of China
Synopsis
Recently, a novel technique was proposed directly integrated resting-state fMRI and DTI to construct a local spatio-temporal correlation tensor from resting state fMRI data. In individual level, the functional correlation tensor can be used to tract white matter fibers. However, there is no knowledge of group level property of functional correlation tensor. In the present study, group averaged tensorial properties (e.g. FA and trace) of functional correlation tensor were investigated. It is shown that the group averaged trace map of functional tensor can reveal default mode network. And our results are consistent across different datasets.
Purpose
Resting state functional MRI (R-fMRI) and diffusion tensor imaging (DTI) can in vivo and non-invasively map functional and structural brain networks, respectively. Generally, combining R-fMRI and DTI data could allow us to characterize structure-function relations of distributed neural networks1. Recently, a novel technique was proposed directly integrated these two approaches to construct a local spatio-temporal correlation tensor from R-fMRI data2. In individual level, the functional correlation tensor can be used to tract white matter fibers2, 3. However, there is no knowledge of group level property of functional correlation tensor. In the present study, group averaged tensorial properties (e.g. FA and trace) of functional correlation tensor were investigated.Methods
R-fMRI images were acquired in Peking University (PKU) using a 3.0 T MR scanner. Thirty four healthy volunteers from PKU were included in this study. The pre-processing steps included slice timing correction, head motion correction and spatial normalization to MNI space. After that, a global time course was removed by intensity normalization and a band-pass filter was applied with a cutoff frequency of 0.1 Hz. Then, the functional correlation tensor was constructed voxel-wise using the method in ref. 2. Tensorial indices such as FA and trace were computed for each subject and then group averaged. To test whether the results were site dependent or not, two more R-fMRI datasets acquired at Beijing Normal University (BNU) and University of Washington at Saint Louis (UWSL) were recruited, which were freely available at the 1000 Connectome Project website.Results
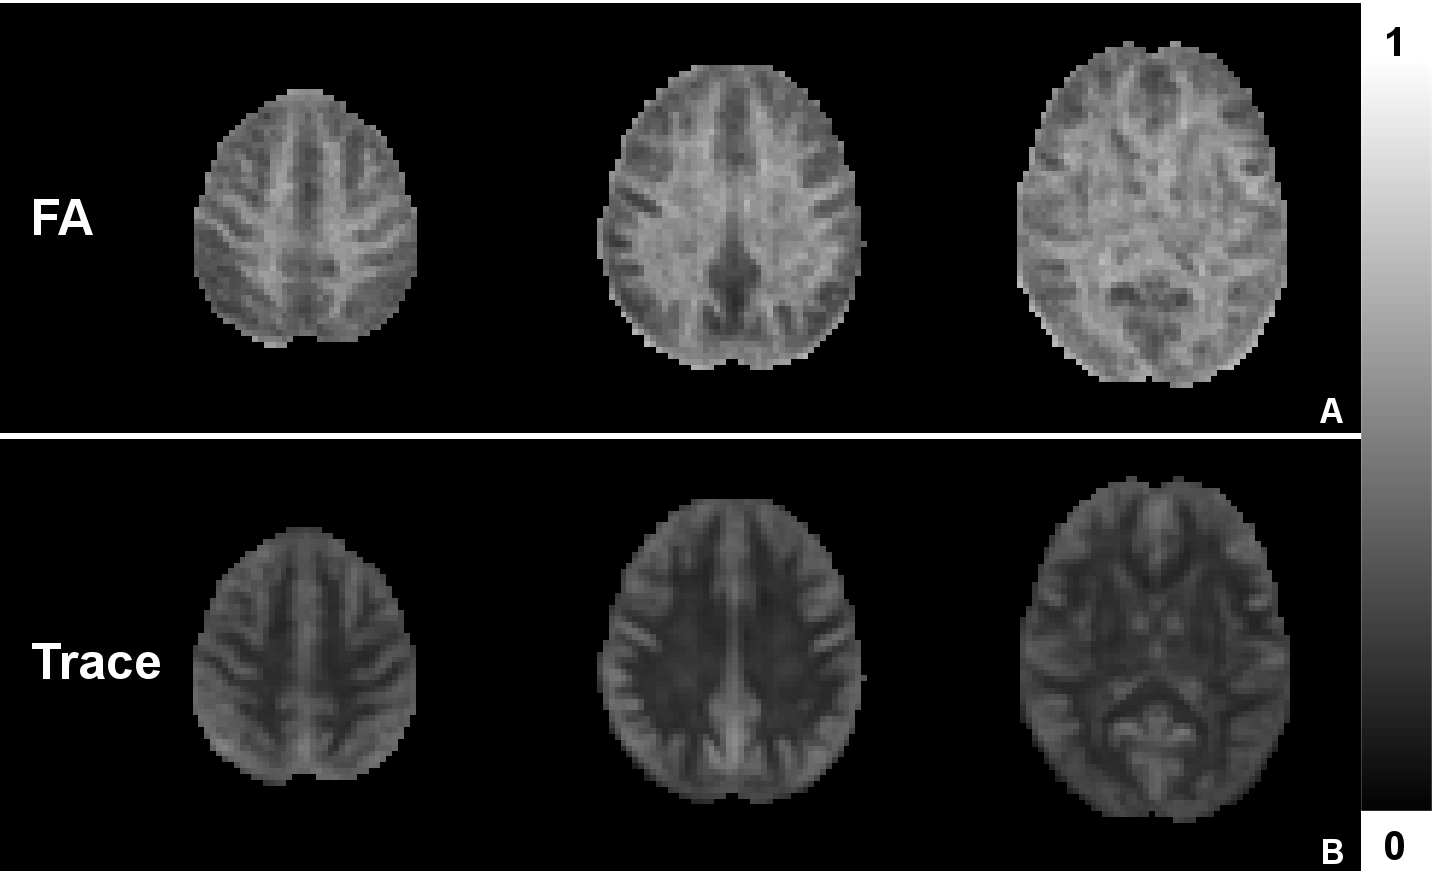
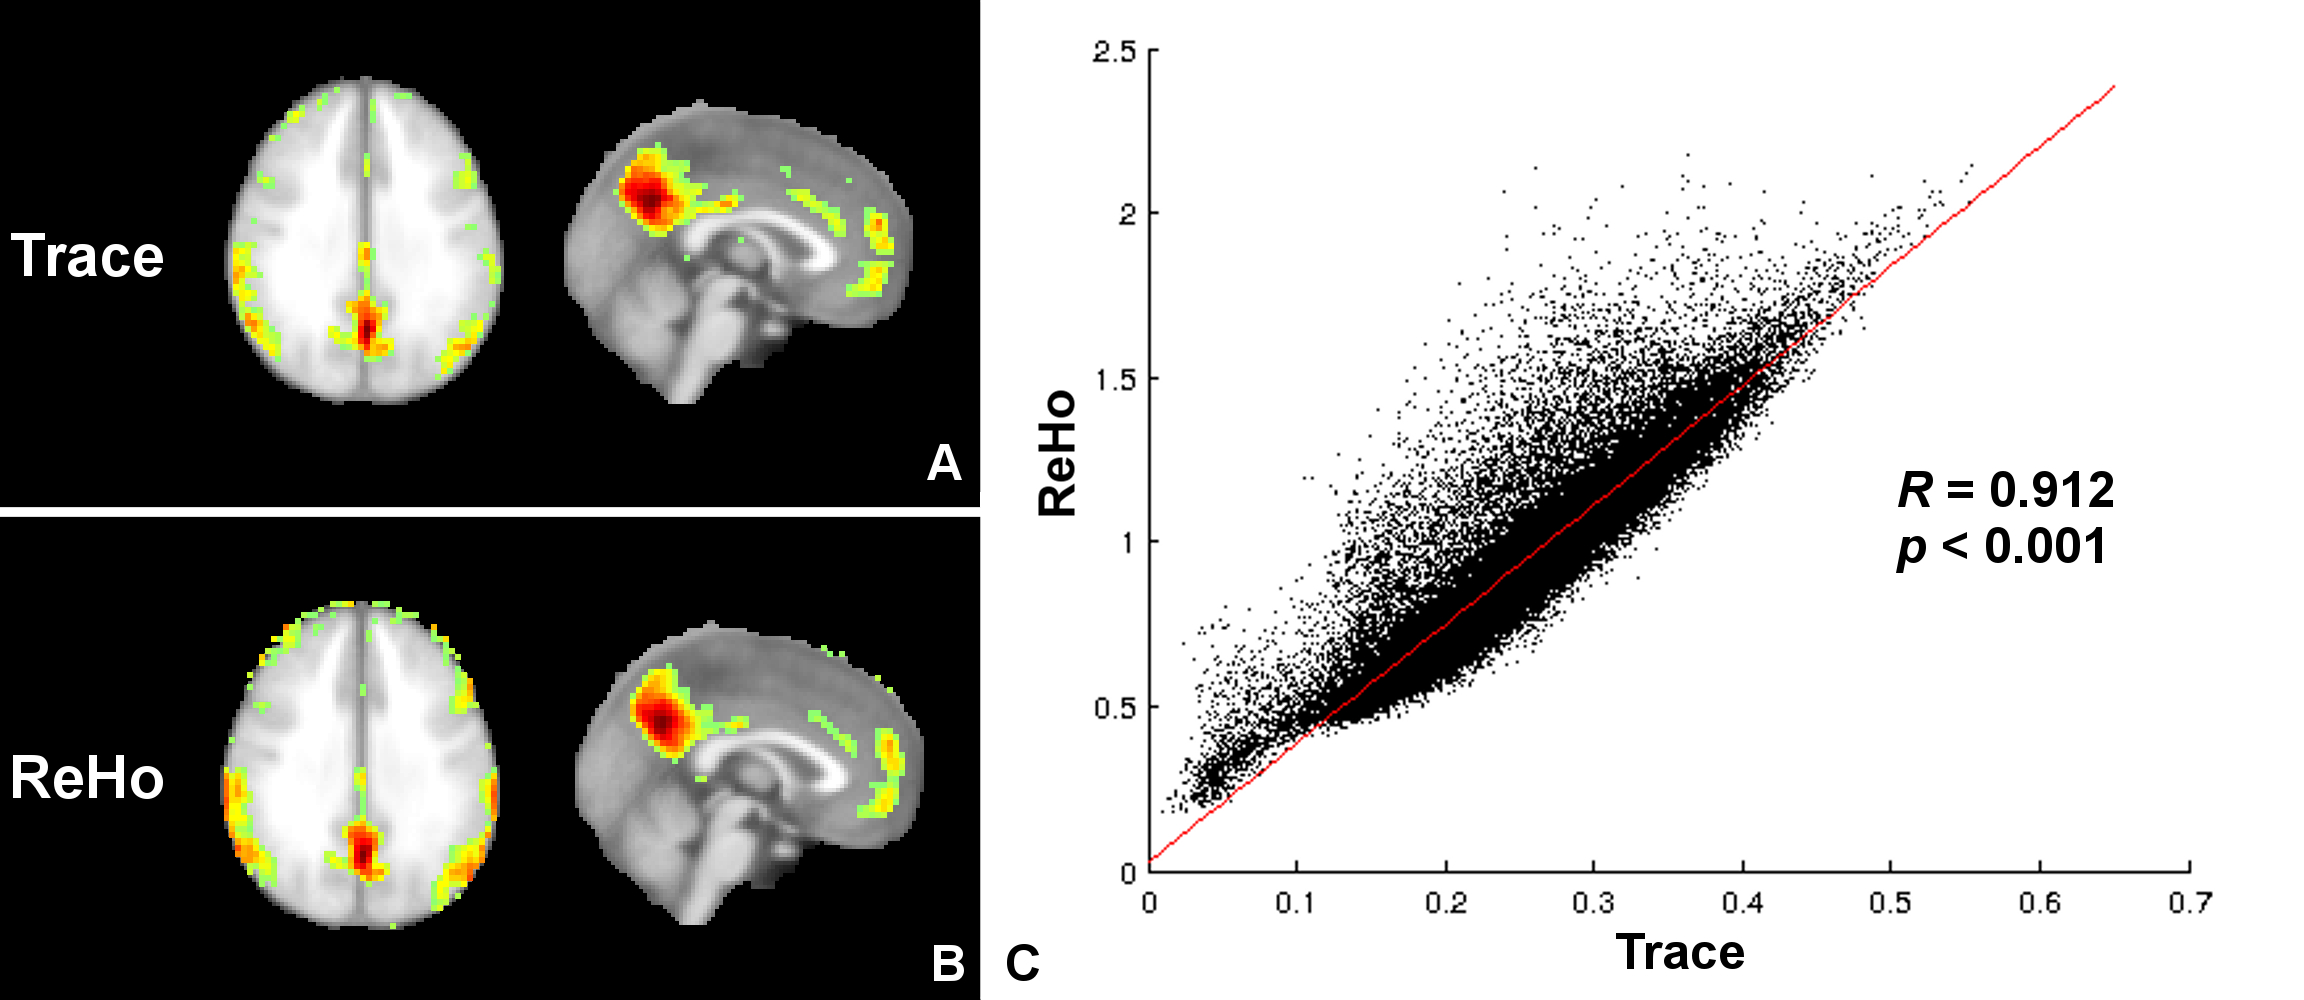
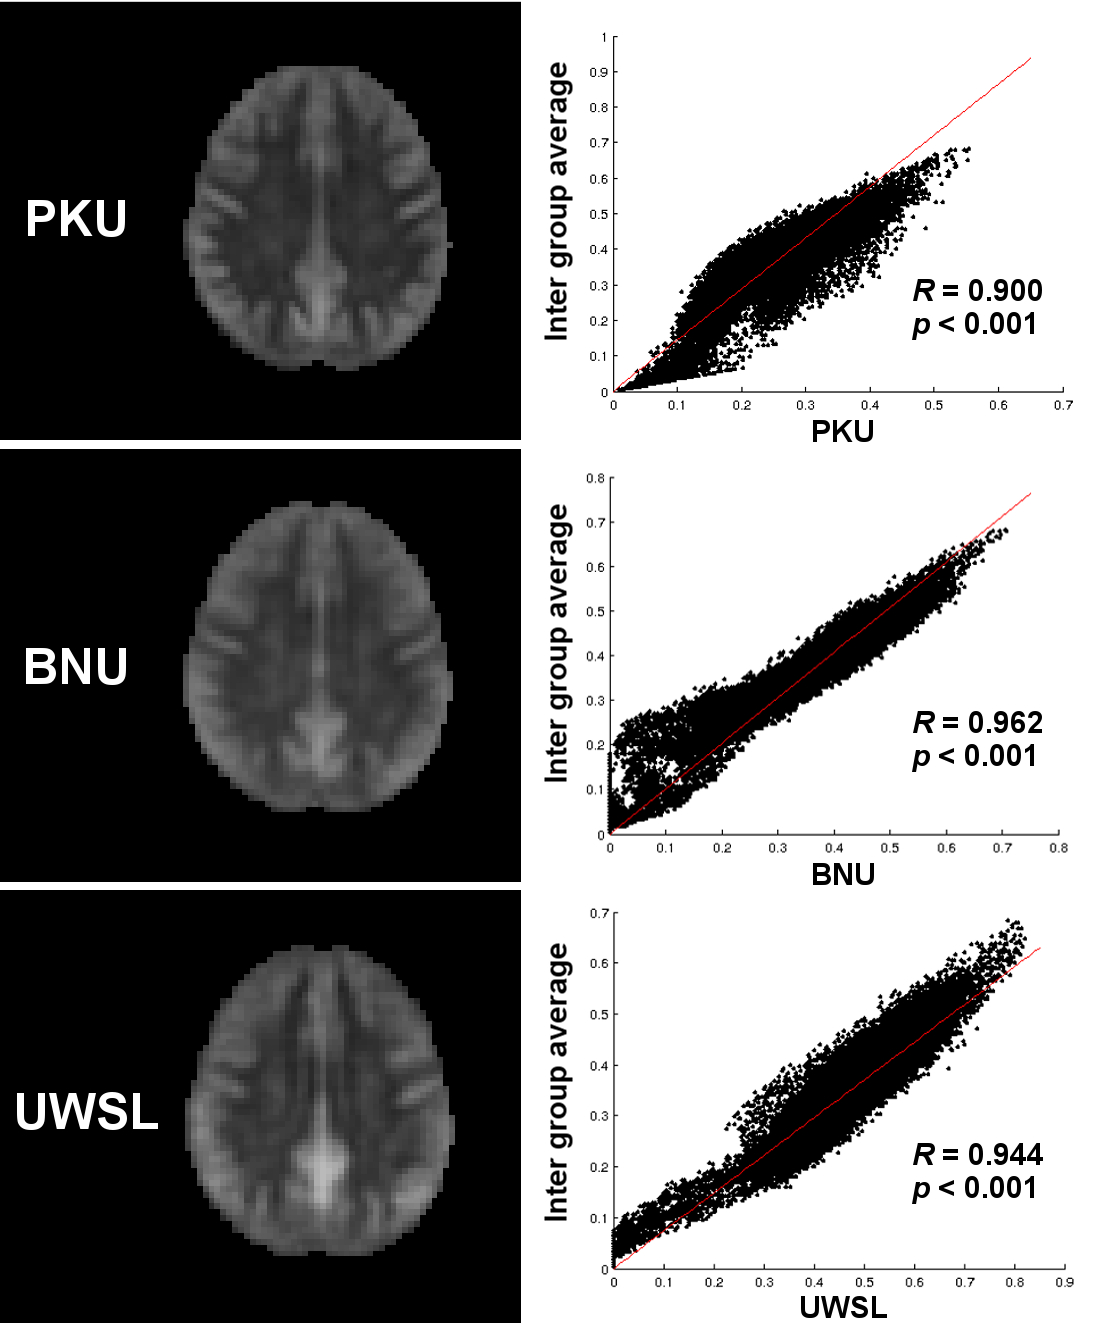
The group averaged FA and trace maps are shown in Figure 1. It can be seen that the both of these two maps reveal great image contrast between different cerebral regions (e.g. white matter, cortical and sub-cortical regions). The contrast of FA map here is very similar to that of DTI, although its value is not as high as FA of DTI. More interestingly, the averaged trace map has relative high values in posterior cingulate cortex (PCC), dorsolateral prefrontal cortex (DLPFC) and medial prefrontal cortex (MPFC), which are crucial cortical regions of default mode network4 (DMN). A color rendered average trace map with threshold of 0.4 is shown in Figure 2. It looks very similar to the DMN. For comparison, the group averaged ReHo5 map is also demonstrated with threshold of 1.5. It is shown that there are significant correlation between group averaged trace and ReHo maps. The averaged trace maps of all three datasets are depicted in Figure 3. Very similar image contrast can be seen. Significant correlation between each group averaged trace and the mean trace value of all subjects from the three datasets demonstrates that our results are consistent among three groups.Discussion and conclusion
In this study, the group level tensorial properties of functional correlation tensor were investigated. It was found that the group averaged FA map has similar contrast with that of DTI. It is similar to the individual level results. More interestingly, the averaged trace map is similar to result of ReHo. With threshold, the default mode network was depicted. Based on the definition of the trace of functional tensor, it may in some degrees reflect the averaged functional connectivity strength with adjacent voxels. Thus, it has the similar appearance with ReHo. Moreover, it was tested that the results of this study were consistent between different datasets. In sum, the directly integrated technique, functional correlation tensor, can reflect both functional and structural features of human brain. It may open a new window to investigate the relationship between function and structure inhuman brain.Acknowledgements
No acknowledgement found.References
1. Honey, C. J., et al. Predicting human resting-state functional connectivity from structural connectivity. Proceedings of the National Academy of Sciences 106.6 (2009): 2035-2040.
2. Ding, Zhaohua, et al. Spatio-temporal correlation tensors reveal functional structure in human brain. PloS one 8.12 (2013): e82107.
3. Ding, Zhaohua, et al. Visualizing functional pathways in the human brain using correlation tensors and magnetic resonance imaging. Magnetic resonance imaging 34.1 (2016): 8-17.
4. Raichle, Marcus E. The brain's default mode network. Annual review of neuroscience 38 (2015): 433-447.
5. Zang, Yufeng, et al. "Regional homogeneity approach to fMRI data analysis." Neuroimage 22.1 (2004): 394-400.
Figures