5332
Relationship of seed-based connectivity and amplitude of low-frequency fluctuations in resting-state functional MRI1GE Global Research, Bangalore, India
Synopsis
Resting-state functional magnetic resonance imaging (rs-fMRI) has been suggested to provide key understanding of large-scale network organization in human brain. Harnessing rs-fMRI, we have examined the relationship of seed-based connectivity (SBC) with amplitude of low-frequency fluctuations (ALFF) and fractional ALFF (fALFF). We recorded rs-fMRI from healthy volunteers and measured regional ALFF, fALFF and SBC. We demonstrate that ALFF and fALFF were weakly correlated to SBC and the correlation was specifically stronger for selected networks. Our results suggest that ALFF/fALFF and SBC may be driven by the same underlying factors and thus co-vary in a similar manner.
Introduction
Resting-state functional magnetic resonance imaging (rs-fMRI) studies have provided an improved understanding of the human brain functional integration and large-scale network organization1,2. Seed-based connectivity (SBC) analysis has been widely used to define various brain networks and the functional connectivity within2,3, and amplitude of low-frequency (0.01–0.1 Hz) fluctuation (ALFF) has been suggested to reflect the intensity of regional spontaneous brain activity1,4. However, ALFF is more sensitive to the physiological and system related noise and thus fractional ALFF (fALFF) (ratio of power spectrum of low- frequency to that of the entire frequency range) approach has been suggested in the field4. Previously, we have shown that in mild traumatic brain injury (mTBI) patients, both fALFF and SBC were correlated to symptom severity within the same regions-of-interest (ROI)5,6. Hence, in this study we have examined the correlation between SBC and ALFF/fALFF in healthy subjects to understand the nature of their relationship. We correlated the resting-state SBC with regional ALFF and fALFF independently in a voxel-wise manner. The correlations were examined across different networks to determine whether these associations spanned across the entire brain or were specific to selective networks.Methods
After obtaining informed consent, rs-fMRI was recorded from 26 healthy controls (2 sessions, 1 week apart). After eliminating missing and noisy data, we analyzed 41 time points in total. Using GE 3T MRI scanner, multi-band (acceleration factor 3) 2D-EPI, TR/TE = 900/30 ms was acquired for 6 minutes (395 volumes), with 1.875 mm2 in-plane resolution and 3 mm slice thickness to cover the whole brain. T1-weighted scan (1 mm resolution) was acquired at each time point and used for spatial normalization process. rs-fMRI data was motion corrected, rigid registered to T1-weighted image, non-rigid registered to MNI atlas, nuisance removed using aCompCor7, spatial smoothed using Gaussian filter (4mm FWHM) using custom-built software. rs-fMRI data was temporally band-pass filtered (0.01-0.1 Hz) and 12 SBC maps were extracted for all subjects. ALFF maps were calculated as power of 0.01-0.1 Hz band. fALFF was calculated by dividing the ALFF maps by the total power of the entire frequency range (0-0.55 Hz). ALFF and fALFF were calculated for 14 functional networks derived from 90 functional ROIs8. Correlation between SBC and ALFF/fALFF at each ROI across subjects was computed.Results
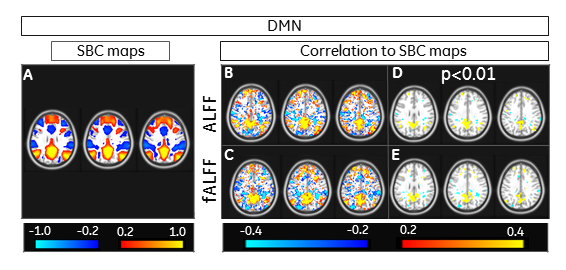
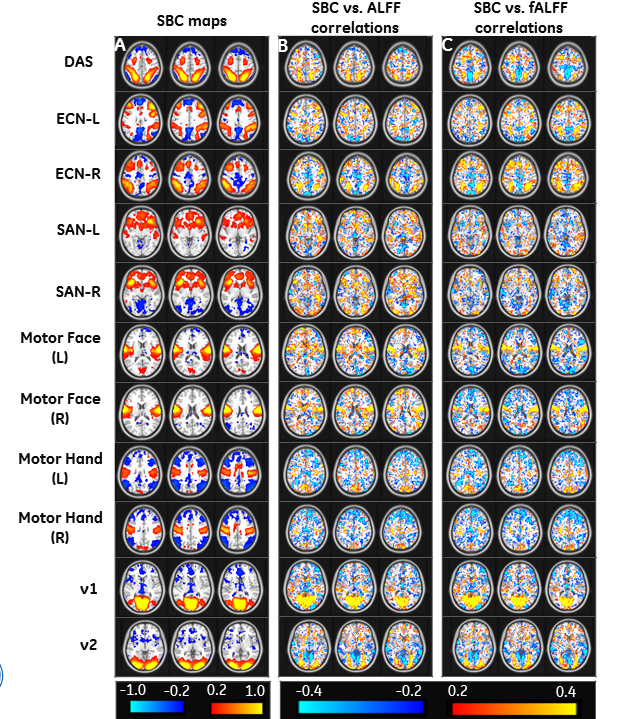
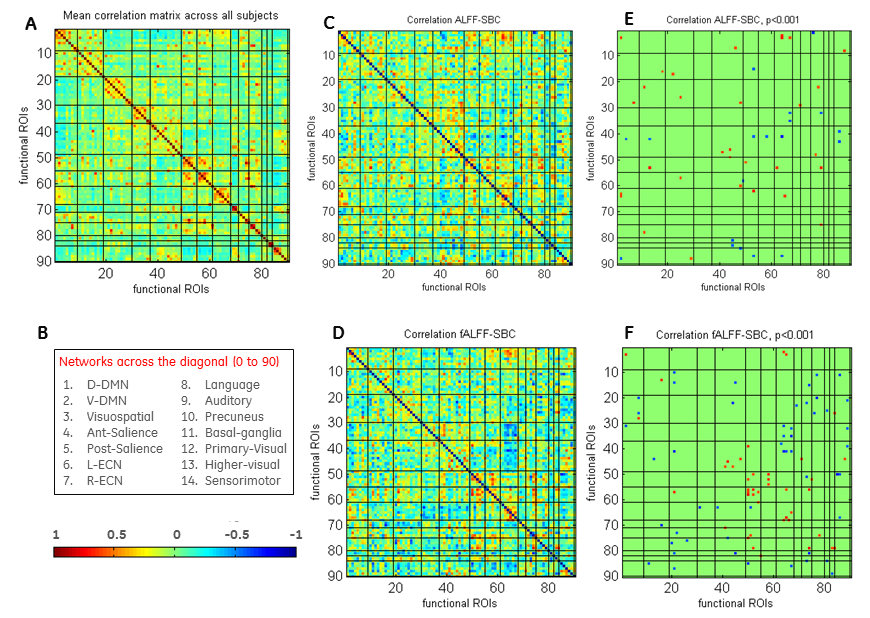
We analyzed voxel-wise correlation between SBC and ALFF/fALFF in 12 resting-state functional connectivity networks. SBC for the default-mode network (DMN) is shown in Figure 1A. We observed correlation between SBC and ALFF/fALFF values in DMN (Figure 1B, C). Correlation maps, thresholded using p<0.001 (Figure 1D, E) also showed overlap of ALFF/fALFF values with SBC. We analyzed SBC for eleven other networks (Figure 2A) and investigated voxel-wise correlations between SBC and ALFF/fALFF (Figure 2B, C). ALFF and fALFF values showed correlation with SBC in certain networks in specific regions. Hot and cold colors encode positive and negative effects, respectively. Next, we computed mean correlation matrix of SBC across 90 ROIs and their relationship to regional ALFF and fALFF. We observed relatively higher connectivity within each network as compared to across networks (Figure 3A). The ROIs were arranged by their 14 network affiliations (Figure 3B). Correlation between SBC and ALFF/fALFF at each ROI across subjects was computed (Figure 3C, D). The thresholded correlations between ALFF/fALFF and SBC have been illustrated (p <0.001) (Figure 3E, F). Hot and cold colors encode positive and negative correlations, respectively. While there was correlation between SBC and ALFF/fALFF, most of this correlation was weak (not significant, Figure 3E, F). The correlation between fALFF and SBC was stronger in most functional ROIs compared to ALFF (Figure 3C, D).Discussion
Our results demonstrate that while network connectivity (measured using SBC) was correlated to low amplitude fluctuations (ALFF/fALFF) in rs-fMRI, this correlation was weak (not significant when considering multiple comparisons) and was specifically stronger for selected networks. Correlation of SBC was stronger with fALFF compared to ALFF. We also observed that negative correlations were far more evident between fALFF and SBC than ALFF and SBC. Non-neuronal physiological noise affects both SBC and fALFF/ALFF computations. Hence, the correlation between ALFF and SBC may result from both neural and noise contributions. Our results show that ALFF/fALFF and SBC co-vary and are possibly driven by the same underlying factors. Hence, for biomarker discovery, using fALFF or SBC might be equally relevant.Acknowledgements
No acknowledgement found.References
[1] Di, Xin, et al. "The influence of the amplitude of low-frequency fluctuations on resting-state functional connectivity." Frontiers in human neuroscience 7 (2013): 118.
[2] Biswal, Bharat, et al. "Functional connectivity in the motor cortex of resting human brain using echo-planar mri." Magnetic resonance in medicine 34.4 (1995): 537-541.
[3] Fox, Michael D., et al. "The human brain is intrinsically organized into dynamic, anticorrelated functional networks." Proceedings of the National Academy of Sciences of the United States of America 102.27 (2005): 9673-9678.
[4] Zou, Qi-Hong, et al. "An improved approach to detection of amplitude of low-frequency fluctuation (ALFF) for resting-state fMRI: fractional ALFF." Journal of neuroscience methods 172.1 (2008): 137-141.
[5] Madhavan, et al. “Reduced low frequency band power in resting state activity predicts symptom severity in mild traumatic brain injury (mTBI).” In Proceedings of the 24th Annual Meeting of ISMRM, Singapore, USA, 2016. 1193
[6] Joel, et al. “mTBI symptom severity is associated with functional connectivity of specific networks.” In Proceedings of the 24th Annual Meeting of ISMRM, Singapore, USA, 2016. 1196.
[7] Behzadi, Y., Restom, K., Liau, J. & Liu, T. T. A component based noise correction method (CompCor) for BOLD and perfusion based fMRI. NeuroImage 37, 90-101, doi:10.1016/j.neuroimage.2007.04.042 (2007).
[8] Shirer, W. R., et al. "Decoding subject-driven cognitive states with whole-brain connectivity patterns." Cerebral cortex 22.1 (2012): 158-165.
Figures