5331
A Group level analysis to compare characteristics of balanced SSFP fMRI with non-balanced techniques1Biomedical Engineering, Amirkabir University of Technology (Tehran Polytechnic), Tehran, Iran, 2School of Cognitive Sciences, Institute for Research in Fundamental Sciences (IPM), Tehran, Iran
Synopsis
Non-balanced SSFP has been recently suggested as a viable approach for T2-weighted SSFP fMRI. Compared to bSSFP, it entirely eliminates the problematic banding artifacts. However, its sensitivity has not yet been systematically investigated. In this study, fixed effects group analysis was performed on balanced and non-balanced SSFP data from seven healthy subjects in 7 T. We found that, group activation maps are generally similar, besides, mean z-values for the two methods are not significantly different. The obtained results suggest that the newly developed nbSSFP method is a viable approach to substitute bSSFP in high resolution fMRI studies.
Introduction
Balanced SSFP methods compared to GRE-EPI, provide images with low susceptibility-induced distortion and relatively high SNR level (Miller, Tijssen, Stikov, & Okell, 2011) . It makes them particularly suitable for high resolution functional MRI studies (Scheffler et al., 2001)(Miller et al., 2003). Nevertheless, an important practical limitation for these methods comes from the existence of dark bands within the imaging plane. Consequently, non-balanced SSFP has been suggested as a possible Steady State based alternative for this method by manifesting generally the same image-contrast, yet without any banding effects. We would like to see the cost (on sensitivity) of removing these problematic dark bands.
In bSSFP, dark bands cause serious problems in comparative single subject studies (Miller, 2012) as we cannot robustly rely on active voxels observed near the dark bands (transition bands). Because of the random distribution of dark-bands for different subjects, the averaging of the first level maps reduces their effects on false active voxels. In order to provide a fair comparison between these two techniques, we implemented a group approach to reduce the effect of dark bands and investigated the sensitivity of these two methods for solely the commonly active voxels in group results.
Data acquisition
A 7T Magnetom (Siemens Healthcare, Erlangen, Germany) scanner with 32 channel head coil (Nova Medical, Wilmington, USA) was used for collecting fMRI data from 7 healthy subjects and using two different sequences. Implemented parameters for each of these acquisitions were as follows: voxel size=1.25x1.25x5 mm, Matrix size=160x148x12, FA=23°, Volume-TR=8s, Partial Fourier = (6/8, 6/8), GRAPPA=3. In all experiments 40 volumes were acquired in 320 s. For nbSSFP method TR/TE=14.1/10.9 ms and for bSSFP technique TR/TE=14.1/7.05 ms.
In all data acquisitions a combined visual and motor task was used by utilizing a reversing checker-board (flashing in 8 Hz) alongside with right hand finger tapping performed simultaneously with this visual task.
The proposed non-balanced SSFP sequence uses an extra 2π dephasing gradient which causes the SSFP profile to shrink into a single voxel and as a result the banding artifact in bSSFP method is eliminated. To make the sequence more robust to motion, a time delay has been added between the pre-phase lobe and the readout gradient to nullify the first moment.
Methods
The functional data were analyzed using FSL v5.0.9 and the motion correction was performed using MCFLIRT. Moreover, spatial smoothing with FWHM of 2.5 mm and high pass filtering with 64 s cutoff was implemented. The map for each subject was further registered to the standard MNI152 atlas for group analysis.
In first level analysis, activation maps were acquired using a general linear model (GLM) as implemented in FEAT v6.00. An uncorrected p-value of 0.005 was used for thresholding the maps. A fixed effects group average was implemented on the first level data and the threshold for group level was also set to an uncorrected p-value of 0.005.
Results
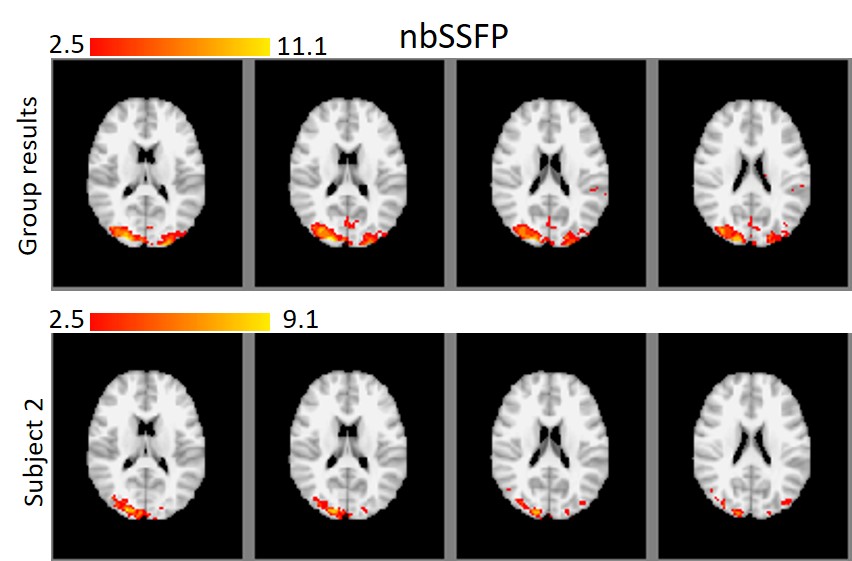
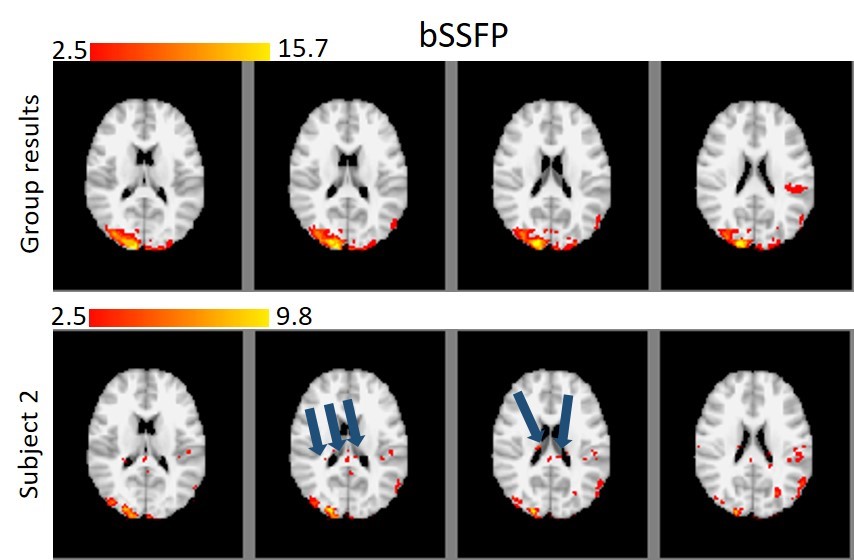
Figures 1 and 2 show the results for nbSSFP and bSSFP respectively. In each figure, the activation map for group average and one subject (2nd subject) are shown with standard MNI background and minimum z-value of 2.5 which matches the uncorrected p-value of 0.005. The differences between the group result and single subject can be clearly seen in these figures. For bSSFP the blue arrows illustrate the false positives caused by dark bands, nevertheless, those voxels are removed in group results.
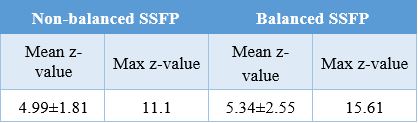
The mean z-value is related to functional sensitivity, thus for comparing the sensitivity of these two techniques in group level, the maximum and mean of the z-values were calculated for all common voxels (812 voxels). These results are summarized in table 1.
Conclusion
The group results show that both visual and motor areas in the brain are activated roughly similarly, in both methods. As a results, the two maps almost match each other for these activated areas.
Furthermore, it is evident from table 1 that the mean z-value for nbSSFP is slightly lower than bSSFP (4.99 and 5.34). Besides, the maximum z-value for bSSFP is higher than nbSSFP (11.1 and 15.6), while the maximum for both maps occurred in the visual area of the brain. Our group results suggest that the nbSSFP results are comparable to the bSSFP approach in terms of functional sensitivity and general pattern of activation. Nevertheless, nbSSFP does not suffer from the signal loss due to banding artifact, that is seriously problematic for single subject analysis. Consequently, our results suggest that the developed nbSSFP is a viable solution to avoid bSSFP banding artifact for high resolution fMRI studies.
Acknowledgements
The authors would like to thank Dr. David G. Norris from Donders Centre for Cognitive Neuroimaging for his help on collecting the data. This study is partially supported by Cognitive Sciences and Technologies Council, Tehran, Iran (No. 2874 and No. 3198).References
Miller, K. L. (2012). FMRI using balanced steady-state free precession (SSFP). NeuroImage, 62(2), 713–719. http://doi.org/10.1016/j.neuroimage.2011.10.040
Miller, K. L., Hargreaves, B. A., Lee, J., Ress, D., Christopher deCharms, R., & Pauly, J. M. (2003). Functional brain imaging using a blood oxygenation sensitive steady state. Magnetic Resonance in Medicine, 50(4), 675–683. http://doi.org/10.1002/mrm.10602
Miller, K. L., Tijssen, R. H., Stikov, N., & Okell, T. W. (2011). Steady-state MRI: methods for neuroimaging. Imaging in Medicine, 3(1), 93–105. http://doi.org/10.2217/iim.10.66
Scheffler, K., Seifritz, E., Bilecen, D., Venkatesan, R., Hennig, J., Deimling, M., & Haacke, E. M. (2001). Detection of BOLD changes by means of a frequency-sensitive trueFISP technique: preliminary results. NMR in Biomedicine, 14(7–8), 490–496. http://doi.org/10.1002/nbm.726
Figures