5330
Region-specific modeling of heart rate and respiratory volume signal contributions in whole-brain high-spatial resolution resting-state fMRI at 7 Tesla1Institute for Systems and Robotics - Lisbon and Department of Bioengineering, Instituto Superior Tecnico, Universidade de Lisboa, Lisbon, Portugal, 2Department of Radiology, A.A. Martinos Center for Biomedical Imaging, MGH and Harvard Medical School, Boston, MA, United States, 3INESC-ID and Department of Electrical and Computer Engineering, Instituto Superior Tecnico, Universidade de Lisboa, Lisbon, Portugal
Synopsis
Several strategies have been proposed for correcting physiological noise in rs-fMRI, including different models of respiratory volume (RV) and heart rate (HR) effects. Although group-level model optimization has often been employed, it has been reported that these effects are highly variable across subjects and brain regions. Here, we investigated the impact of optimizing the time-lags of RV and HR physiological noise contributions at different levels of specificity in 7 Tesla rs-fMRI. We found that a regional optimization based on a clustering approach taking into account the time-lags’ individual spatial variability explained more fMRI signal variance than group or subject-based optimizations.
Purpose
Several strategies have been proposed for correcting physiological noise in resting-state fMRI (rs-fMRI), including different models of the respiratory volume per time (RV) and heart rate (HR) effects. Although group-level model optimization has often been employed, it has been recently reported that these effects are highly variable across subjects and brain regions1,2,3,4. In this work, we aim to investigate systematically the impact of the degree of specificity in the optimization of RV and HR physiological noise model contributions (group, subject, and newly proposed cluster) on the fMRI signal variance explained (VE) by each model.Methods
Data acquisition
12 healthy subjects were studied on a 7 Tesla whole-body MRI scanner with a 32-channel receive RF coil. 5 min of rs-fMRI data were collected using 2D EPI with TE=32ms, TR=2.5s, FA=75º, SMS factor=3, GRAPPA factor=3, nominal echo spacing=0.82ms, and whole-brain coverage by 123 sagittal slices with 1.1mm isotropic resolution. Cardiac and respiratory data were simultaneously recorded using a pulse transducer (ADInstruments) and a pneumatic belt (UFI). A T1-weighted structural image was also acquired using multi-echo MPRAGE, with 1mm isotropic resolution5.
Data analysis
Pre-processing of rs-fMRI data consisted of 2nd order RETROICOR, slice timing correction, motion correction, slow drifts removal by regressing out a set of polynomials (up to the 3rd order); and spatial smoothing (3mm Gaussian kernel). Tissue segmentation was performed on the MPRAGE images and gray matter (GM) masks were extracted. The rs-fMRI images were co-registered with the MPRAGE image and the MNI brain.
- RV and HR models
Cardiac and respiratory data were low-pass filtered and HR and RV fluctuations were extracted1,6,7. Variability in the BOLD response to HR and RV fluctuations was taken into account through a time-lagging optimization procedure (-20s to 20s in 1s steps). For each lagged time-course, a general linear model (GLM) was generated and fitted to the data, and the corresponding fMRI signal VE was computed in each voxel. The three following types of models were generated:
1. Single-lag: lagged time-course yielding the maximum VE;
2. Dual-lag: two lagged time-courses yieldeding the maximum VE values corresponding to positive and negative signal changes;
3. Convolution (with impulse response function RRF and CRF for RV and HR, respectively1,8): lagged time-course yielding the maximum VE.
Lag optimization was carried out at the following specificity levels:
1. Group: group-averaged VE-vs-lag curves were used to obtain the optimal lags for RV and HR for all voxels of all subjects;
2. Subject: GM-averaged VE-vs-lag curves were used to obtain the optimal lags for RV and HR for all voxels of each subject;
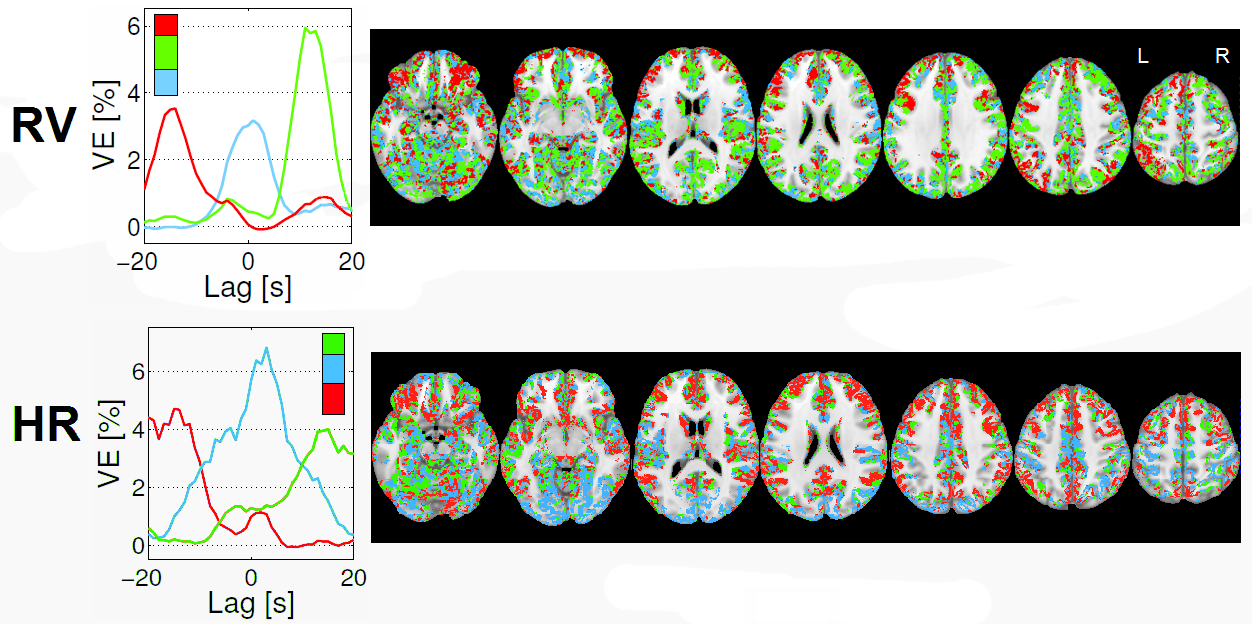
3. Cluster: the VE-vs-lag curves were clustered across GM voxels, using k-means with k=2, 3, 4, 5, 6, and the cluster-averaged VE-vs-lag curves were used to obtain the optimal lags for RV and HR for the voxels in the respective cluster of each subject.
Results
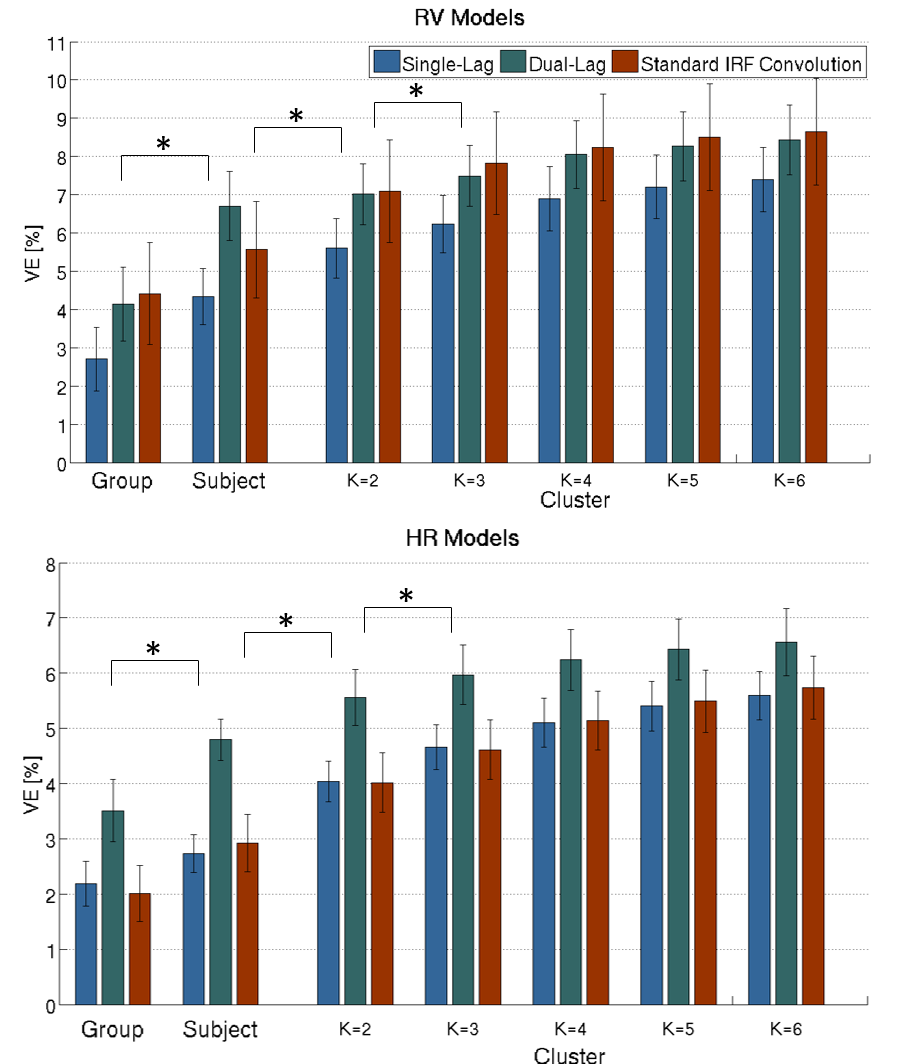
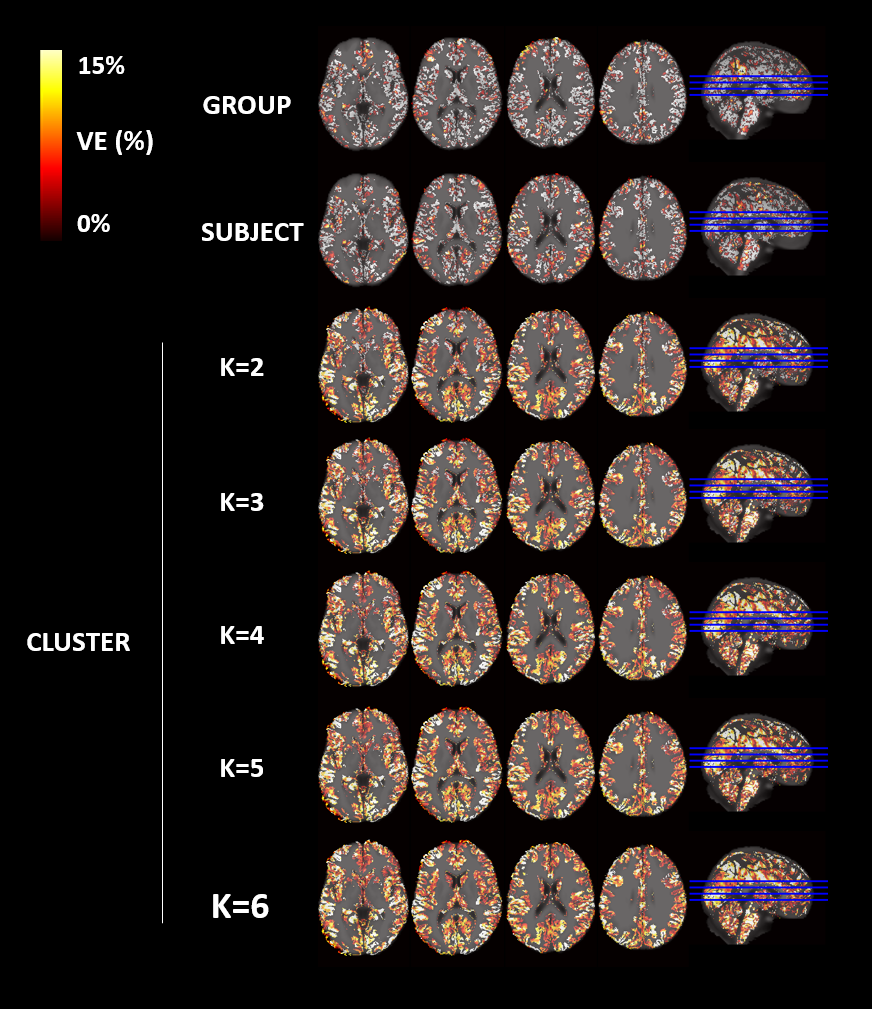
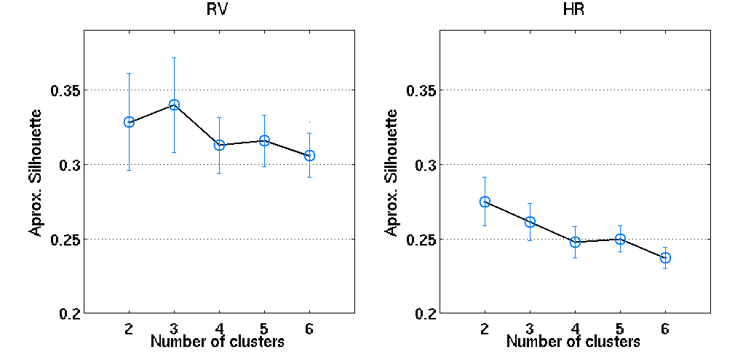
An illustrative example of the proposed clustering approach (k=3) is shown in Fig.1, with cluster-averaged VE-vs-lag curves and respective brain maps for each cluster. Clearly distinct VE-vs-lag curves can be found for the different clusters, exhibiting different optimal time-lags and shapes, with most clusters exhibiting monophasic curves. Group average VE in GM for both RV and HR models across the different levels of optimization specificity is displayed in Fig.2. A 3-way repeated measures ANOVA with factors specificity level (Group, Subject, Cluster), model type (Single-Lag, Dual-Lag, Convolution) and physiological variable (RV, HR) showed statistically significant main effects for specificity level and model type (p<0.05). In general, increasing the level of specificity leads to an increase in VE from group to subject and to cluster levels up to three clusters (k=3), however, no statistically significant improvements were obtained beyond k=3. Both Convolution and Dual-lag models outperformed the Single-lag model for both HR and RV, with Dual-Lag models overall outperforming the two others. Fig 3 displays an illustrative example of the VE maps obtained by the single lag model at each level of optimization specificity. The group average silhouette values as a function of the number of cluster, k, are shown in Fig.4, for the Single-Lag model for both HR and RV, displaying a general decrease beyond k=3, which reinforces the VE results indicating an optimal number of clusters of 3.Conclusion
Our results indicate that physiological noise modeling of 7 Tesla rs-fMRI data may be improved if a cluster-based lag optimization approach is employed in order to take into account the individual spatial variability in the time-lags of HR and RV contributions, particularly if a dual-lag model is employed.Acknowledgements
FCT grants PTDC/EEI-ELC/3246/2012, PTDC/BBB-IMG/2137/2012, UID/EEA/50009/2013, NIH-NIBIB P41EB015896.References
1. Chang, C., Cunningham, J. P. & Glover, G. H. 2009. Influence of heart rate on the BOLD signal: the cardiac response function. Neuroimage, 44, 857-869.
2. Jo, H. J., Saad, Z. S., Simmons, W. K., Milbury, L. A. & Cox, R. W. 2010. Mapping sources of correlation in resting state FMRI, with artifact detection and removal. Neuroimage, 52, 571-82.
3. Birn, R. M., Cornejo, M. D., Molloy, E. K., Patriat, R., Meier, T. B., Kirk, G. R., Nair, V. A., Meyerand, M. E. & Prabhakaran, V. 2014. The influence of physiological noise correction on test-retest reliability of resting-state functional connectivity. Brain Connect, 4, 511-22.
4. Golestani, A. M., Chang, C., Kwinta, J. B., Khatamian, Y. B. & Chen, J. J. 2015. Mapping the end-tidal CO 2 response function in the resting-state BOLD fMRI signal: Spatial specificity, test–retest reliability and effect of fMRI sampling rate. NeuroImage, 104, 266-277
5. Van Der Kouwe, A. J., Benner, T., Salat, D. H. & Fischl, B. 2008. Brain morphometry with multiecho MPRAGE. Neuroimage, 40, 559-569.
6. Shmueli, K., Vand Gelderen, P., De Zwart, J. A., Horovitz, S. G., Fukunaga, M., Jansma, J. M. & Duyn, J. H. 2007. Low-frequency fluctuations in the cardiac rate as a source of variance in the resting-state fMRI BOLD signal. Neuroimage, 38, 306-320.
7. Biancardi, M., Fukunaga, M., Vand Gelderen, P., Horovitz, S. G., De Zwart, J. A., Shmueli, K. & Duyn, J. H. 2009. Sources of functional magnetic resonance imaging signal fluctuations in the human brain at rest: a 7 T study. Magn Reson Imaging, 27, 1019-29.
8. Birn, R. M., Smith, M. A., Jones, T. B. & Bandettini, P. A. 2008. The respiration response function: the temporal dynamics of fMRI signal fluctuations related to changes in respiration. Neuroimage, 40, 644-54.
Figures