5328
Reproducibility of Functional Connectivity Measures acquired at different times of day1MRC/UCT Medical Imaging Research Unit, Department of Human Biology, University of Cape Town, Cape Town, South Africa, 2Cape Universities Body Imaging Centre (CUBIC-UCT), Cape Town, South Africa
Synopsis
Resting state fMRI (rs-fMRI) used to detect and evaluate resting state functional connectivity (RSFC) in both healthy subjects and patients. However, the reproducibility of rs-fMRI may be influenced by the time of day when the scan is performed. In this work, we investigated the reproducibility of resting state networks by comparing scans performed in the morning (immediately after the scanner was switched on) and again in the late afternoon (after all daily scans were done) on six different days. Our results showed higher RSFC in afternoon scans in 5 regions within 5 networks .
INTRODUCTION:
Resting state fMRI (rs-fMRI) has been used to assess intrinsic brain functional networks when the subject is not performing any explicit task [1]. Several studies have investigated the reproducibility of the resting state networks over time, both in single subjects and across subjects. Shannon et al. (2013) [2] reported that medial temporal lobe functional connectivity (FC) changes dramatically over a normal daily period of wakefulness. In contrast, other studies have reported high reproducibility of most resting state networks (RSNs) [3-5]. The aim of this work was to investigate how reproducible RSNs are over a period of six days when measured first thing in the morning and just before the scanner is switched off in the late afternoon.METHODS:
Three healthy adults were scanned early in the morning (immediately after the scanner was switched on, 5:30 am) and again in the late afternoon (after all daily scans were done, 6:00 pm) repeated over a period of six days. Each subject received 6 morning and 6 afternoon scans, yielding a total of 18 morning and 18 afternoon scans. Structural (T1 w) and functional (rs-fMRI) scans were performed with a 3-Tesla Siemens Skyra MRI using a 32 channel head coil. The rs-fMRI protocol parameters were: TR/TE = 2000/30 ms, 33 axial slices, resolution = 3x3x4mm3, 180 measurements. Rs-fMRI data were processed using AFNI's afni_proc.py [6]. Group independent component analysis (ICA) was performed using MELODIC in FSL with 20 ICs [7]. Dual regression in FSL was used to identify clusters showing significant resting state functional connectivity (RSFC) differences between morning and afternoon scans (p<0.05). We report regions that survived cluster size correction at α<0.05 using AFNI-3dClustSim. Cluster sizes for significance are listed in Table 1.RESULTS:
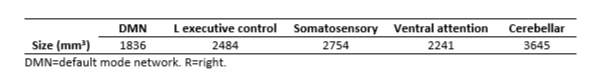
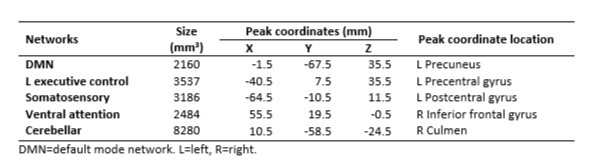
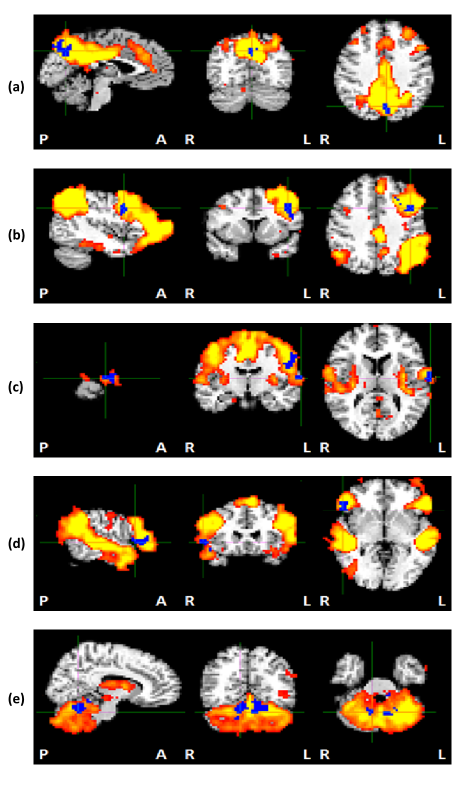
Higher RSFC was found in afternoon scans within 5 regions in 5 networks compared to morning scans, including left- (L-) precuneus in default mode network (DMN), L-precentral gyrus in L- executive control network, L-postcentral gyrus in Somatosensory network, right- (R-) inferior frontal gyrus in ventral attention network and R-Culmen in cerebellar network. The cluster size, peak coordinates and location of each region are shown in Table 2. Figure 1 shows the clusters within each network where higher RSFC was found in afternoon scans compared to morning scans.DISCUSSION:
Significant changes in RSFC were observed over time in 5 regions within 5 networks. These data provide additional evidence that FC may change over a day, with changes in medial temporal lobe having been reported previously [2]. These changes may be related to alterations in brain synaptic density arising from learning and experience [8]. Alternatively, field inhomogeneity due to the heating of the iron plates in the shim trays may play a role in observed RSFC changes.CONCLUSION:
The time of day of MRI scans may influence RSFC in the brain. This is important when conducting a longitudinal study or when using rs-fMRI to assess treatment responses over time.Acknowledgements
The National Research Foundation of South Africa (NRF), Thuthuka grant TTK150612119380.References
1. Biswal B, Yetkin FZ, Haughton VM, Hyde JS (1995): Functional connectivity in the motor cortex of resting human brain using echo-planar MRI. Magnetic resonance in medicine, 34:537-541.
2. Shannon BJ, Dosenbach RA, Su Y, Vlassenko AG, Larson-Prior LJ, Nolan TS, Snyder AZ, Raichle ME. Morning-evening variation in human brain metabolism and memory circuits..J Neurophysiol. 2013 Mar;109(5):1444-56.
3. Chen S, Ross TJ, Zhan W, Myers CS, Chuang KS, Heishman SJ, Stein EA, Yang Y. Group independent component analysis reveals consistent resting-state networks across multiple sessions. Brain Res. 2008 Nov 6;1239:141-51.
4. Wisner KM, Atluri G, Lim KO, Macdonald AW. Neurometrics of intrinsic connectivity networks at rest using fMRI: retest reliability and cross-validation using a meta-level method. Neuroimage. 2013 Aug 1;76:236-51.
5. Choe AS, Jones CK, Joel SE, Muschelli J, Belegu V, Caffo BS, Lindquist MA, van Zijl PC, Pekar JJ. Reproducibility and Temporal Structure in Weekly Resting-State fMRI over a Period of 3.5 Years PLoS One. 2015 Oct 30;10(10):e0140134.
6. Cox RW (1996): AFNI: software for analysis and visualization of functional magnetic resonance neuroimages. Computers and Biomedical research, 29,162-173.
7. Smith SM, Fox PT, Miller KL, Glahn DC, Fox PM, Mackay CE, Filippini N, Watkins KE, Toro R, Laird AR (2009): Correspondence of the brain's functional architecture during activation and rest. Proceedings of the National Academy of Sciences, 106:13040-13045.
8. Gilestro GF, Tononi G, Cirelli C. Widespread changes in synaptic markers as a function of sleep and wakefulness in Drosophila. Science. 2009 Apr 3;324(5923):109-12.
Figures