5327
The resting state fMRI regional homogeneity (ReHo) metrics KCC-ReHo & Cohe-ReHo are valid indicators of tumor-related neurovascular uncoupling1Russell H. Morgan Department of Radiology and Radiological Science, Johns Hopkins University School of Medicine, Baltimore, MD, United States
Synopsis
The validity of BOLD fMRI in pre-surgical planning may be severely compromised due to disruption of the normal coupling between neural activity and the consequent microvascular blood flow response (neurovascular uncoupling, or NVU). The effects of brain tumor-induced NVU on resting state BOLD fMRI (rsfMRI) have been previously described through seed-based correlation analysis (SCA). In this study, we evaluated regional homogeneity of resting state fMRI data using Kendall's coefficient of concordance (KCC-ReHo) & Coherence (Cohe-ReHo) metrics and compared these results with those of “gold standard”motor task-based (tbfMRI) activation to determine their effectiveness in detecting NVU in the sensorimotor network.
Purpose
The validity of BOLD fMRI in pre-surgical planning may severely be compromised due to disruption of the normal coupling between neural activity and the consequent microvascular blood flow response (neurovascular uncoupling, or NVU). 1 The effects of brain tumor-induced NVU on task based and resting state BOLD fMRI (rsfMRI) have been previously published.2,3 In this study, we evaluated regional homogeneity (ReHo) of rsfMRI data based on Kendall's coefficient of concordance (KCC-ReHo) 4 & Coherence (Cohe-ReHo) 5 metrics and compared the these results with those of standard motor tbfMRI activation to determine whether such metrics may allow detection of brain tumor-induced NVU in the sensorimotor network.Methods
Twelve patients with perirolandic primary gliomas referred for presurgical motor mapping with BOLD fMRI were included in this IRB-approved study. Each patient demonstrated NVU as evidenced by abnormally decreased or absent tbfMRI activation in ipsilesional (IL) compared to contralesional (CL) primary motor cortex despite absence of clinical motor deficits or impaired task performance.2 Imaging was performed on a 3.0 T Siemens Trio MRI with a 12-channel head matrix coil. Imaging protocol included 3D T1 MPRAGE (TR=2300 ms, TI= 900 ms, TE= 3.5 ms, 9° FA, 24-cm FOV, 256x 256x176 matrix, slice thickness 1 mm) structural and multiple 2D GE-EPI T2* weighted BOLD sequences for both tbfMRI and rsfMRI (TR=2000 ms, TE=30 ms, 90° FA, 24-cm FOV, 64x64x33 matrix, 4 mm slice thickness with 1 mm gap between slices, interleaved acquisition). 180 volumes were acquired in a 6 minute duration rsfMRI scan. Vertical tongue movement and bilateral simultaneous sequential finger tapping tasks (each 3 minutes duration with alternating 30 seconds blocks of movement and rest were used for tbfMRI. Instructions for all tasks were visually cued. SPM12 was used for preprocessing of tbfMRI (slice timing correction, realignment, normalization to MNI space at 2mm voxel resolution, and spatial smoothing using a 6 mm FWHM Gaussian kernel). Similar pre-processing steps were performed on rsfMRI data except the smoothing which was done after ReHo maps were calculated. Z-score maps for the motor tasks were obtained from the general linear model (GLM) analysis using the standard SPM canonical HRF (reflecting motor activation vs. rest). Pre-processed rsfMRI data were analyzed using the REST(version 1.8)6 toolkit. After detrending and low frequency (0.01-0.08 Hz) bandpass filtering, KCC-ReHo & Cohe-ReHo were calculated. For ROI analysis, pre- and post- central gyri were automatically parcellated using an Automated Anatomical Labeling (AAL) template7,8 for each patient. Cl and IL ROIs circumscribing the combination of pre- and post- central gyri (CG) were obtained for each slice. Consecutive axial sections were evaluated along the z-axis where lesion was present in pre- & post CG. Identical ROIs were used for analysis of the tbfMRI, KCC-ReHo and Cohe-ReHo maps.Results
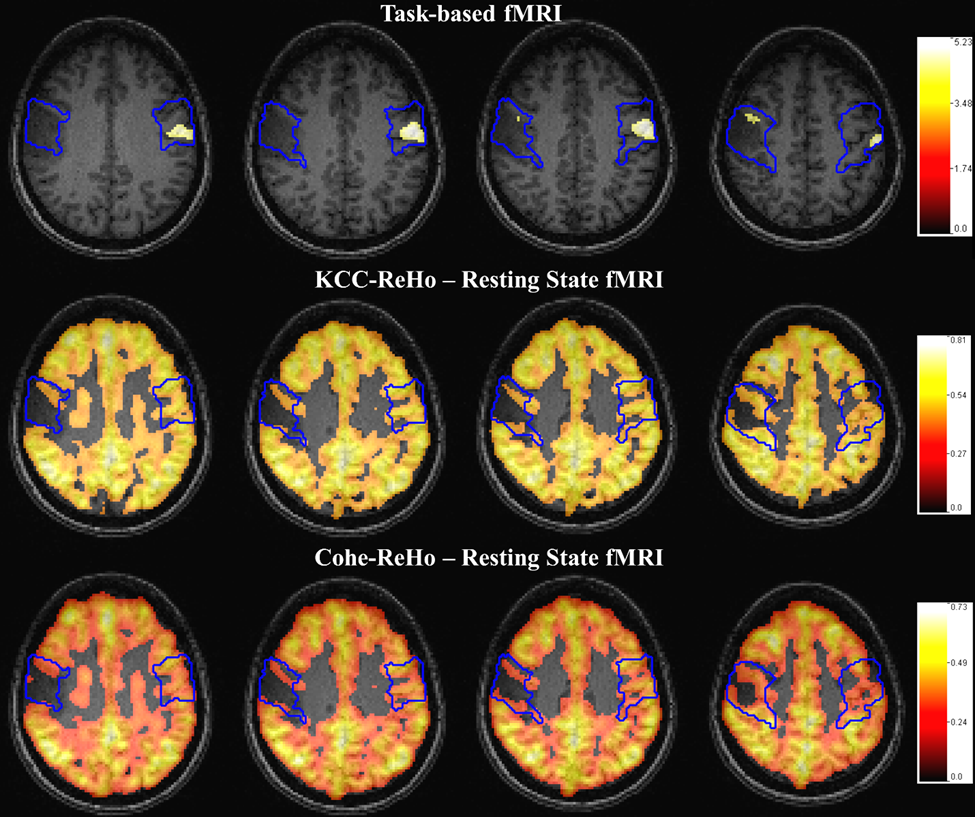
Voxel values in the CL & IL ROI of each map were divided by the corresponding global mean of KCC-ReHo & Cohe-ReHo in cortical brain tissue. Group analysis demonstrated significantly decreased mean values of KCC-ReHo and Cohe-ReHo in the ipsilesional ROIs compared to the contralesional ROIs (based on nonzero voxels in the respective ROIs including only the lesion volume (p=0.02 & p=0.04)). These findings correspond to similar ipsilesional abnormal BOLD signal reductions on tbfMRI (p=0.0005) on the bilateral movement tasks that indicate NVU in these patients without clinical motor deficits or suboptimal task performance. Figure 1 displays results for a single patient.Discussion
In this preliminary study we have demonstrated that ipsilesional reduction in regional homogeneity of resting state fMRI due to perirolandic tumors may be as useful an indicator of tumor-induced neurovascular uncoupling affecting the sensorimotor network as asymmetric ipsilesional reductions in tbfMRI activation. The potential advantages of ReHo may be the scalability of this method for assessment of other brain networks beyond the sensorimotor network, and future studies will explore this possibility.Conclusions
Ipsilesional abnormalities in ReHo derived from rsfMRI may serve as a potential indicator of NVU in patients with brain tumors and other resectable brain lesions; as such, ReHo findings may complement findings on tbfMRI used for presurgical planning.Acknowledgements
This work is partially supported by NIH grant R42 CA173976-02 (NCI).References
1. Attwell D, et al. Nature 2010;468:232-243
2. Zacà D, et al. J Magn Reson Imaging 2014;40(2):383-90
3. Agarwal S et al. J Magn Reson Imaging 2016 Mar; 43(3):620-6
4. Zang Y et al. Neuroimage 2004;22(1):394-400
5. Liu D et al. Front Syst Neurosci 2010;4:24
6. Song X-W et al. PLoS ONE 2011;6(9):e25031
7. Tzourio-Mazoyer N et al. Hum Brain Mapp 2002;17:143–55
8. Smith SM. Hum Brain Mapp 2002;17:143–55
Figures