5325
Spatial Adaptive Kernel Canonical Correlation Analysis1Cleveland Clinic Lou Ruvo Center for Brain Health, LAS VEGAS, NV, United States, 2University of Colorado Boulder, CO, United States
Synopsis
Spatially adaptive multivariate methods were applied in fMRI activation analysis to alleviate low sensitivity in commonly used Gaussian smoothing single voxel analysis. Usually these methods require constraint to avoid the curse of high degrees of freedom. We have developed a novel spatially adaptive kernel canonical correlation analysis method, which does not require constraint and has superior performance compared to other methods.
INTRODUCTION
Local canonical correlation analysis (CCA) is a spatially adaptive method and has recently been proposed for fMRI data analysis1 as an alternative to the most commonly used single voxel analysis using isotropic Gaussian smoothing. However, local CCA has much higher degrees of freedom than univariate methods. Constraints on the neighborhood are required to alleviate low specificity issues. We propose a novel global kernel CCA approach for activation detection. It efficiently analyzes the time series of the entire brain simultaneously and adaptively smooths fMRI time courses. Besides, no spatial constraint is required to alleviate the curse of high degrees of freedom. We investigates the performance of proposed kernel CCA method, local constrained CCA method and single voxels analysis.METHODS
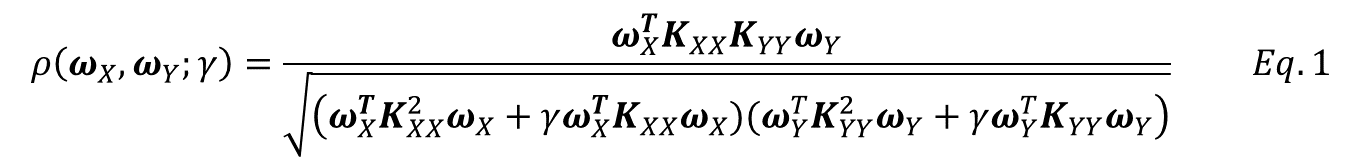
Episodic memory task fMRI data of 7 normal controls (NCs) and 7 amnestic mild cognitive impairment (aMCI) subjects were acquired with Institutional Review Board approval on a 3.0T GE HDx MRI scanner. The EPI sequence has TR/TE=2000 ms/30 ms, parallel imaging factor=2, slices=25, slice thickness/gap = 4.0 mm/1.0 mm, 288 time frames, in plane resolution 96 x 96 voxels, FOV=220 mm. The fMRI volumes were interpolated to obtain an isotropic voxel size of 2 mm x 2 mm x 2 mm. Preprocessing steps included slice-timing correction, realignment and high-pass filtering. For single voxel analysis (SV), fMRI data were smoothed with isotropic Gaussian filter (FWHM=4mm). In the proposed global kernel CCA method (stKCCA) and local constrained CCA method (nonneg-stCCA), fMRI data were smoothed with seven steerable filters2 that can adaptively estimate the smoothing direction during the following analysis. In all the analysis methods, the design matrix $$$X (size T x 4)$$$ represents fours functions modeling the blood oxygenation level-dependent (BOLD) response for the tasks of interest. In the local constrained CCA method, canonical correlation function $$$\rho(\alpha,\beta)=corr(Y_q\alpha,X\beta)$$$ is maximized at voxel q with nonnegative constraint1, where $$$Y_q$$$ represents seven anisotropically smoothed time series. In the proposed kernel CCA method, $$$Y$$$ represents the anisotropically smoothed time series of entire brain. The goal of kernel CCA is to maximize the correlation function $$$\rho(\omega_X,\omega_Y)$$$ defined in Eq.1. Linear kernel was used to construct the kernel matrices3. The regularization parameter $$$\gamma$$$ is imposed by controlling the sum of the squares of the weight vector norms to avoid overfitting and the $$$\gamma$$$ value which maximized the correlation difference between memory task fMRI data and wavelet-resampled fMRI data was selected for analysis. Kernel CCA can be solved as standard eigenvalue problems. The weight vector $$$\alpha$$$ for voxel q was obtained by $$$\alpha=Y_q^T\omega_Y$$$. Nonnegative least square was carried out to determine $$$\beta$$$ by minimizing $$$||X\beta-Y_q\alpha||_2$$$. We applied these methods on simulated and real fMRI data. In the simulation, correlation map was obtained. In real fMRI data, an approximate unsigned F statistic map with contrast “encoding – control” was computed.RESULTS
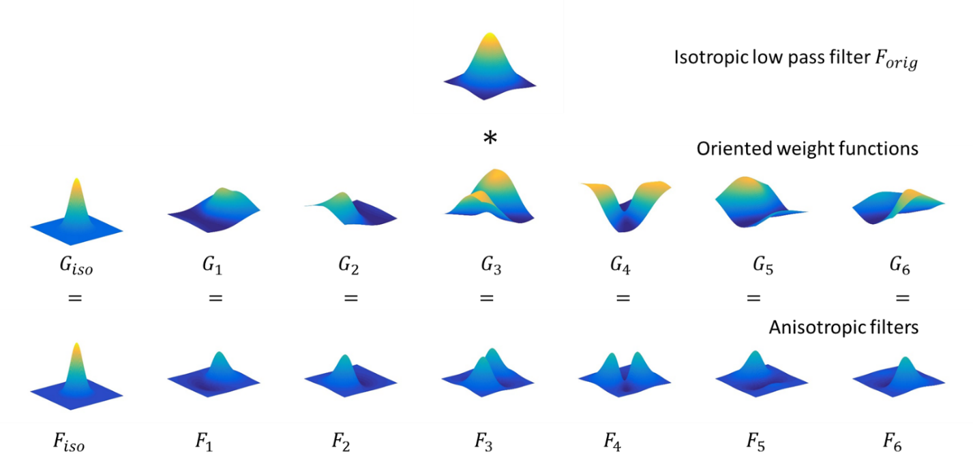
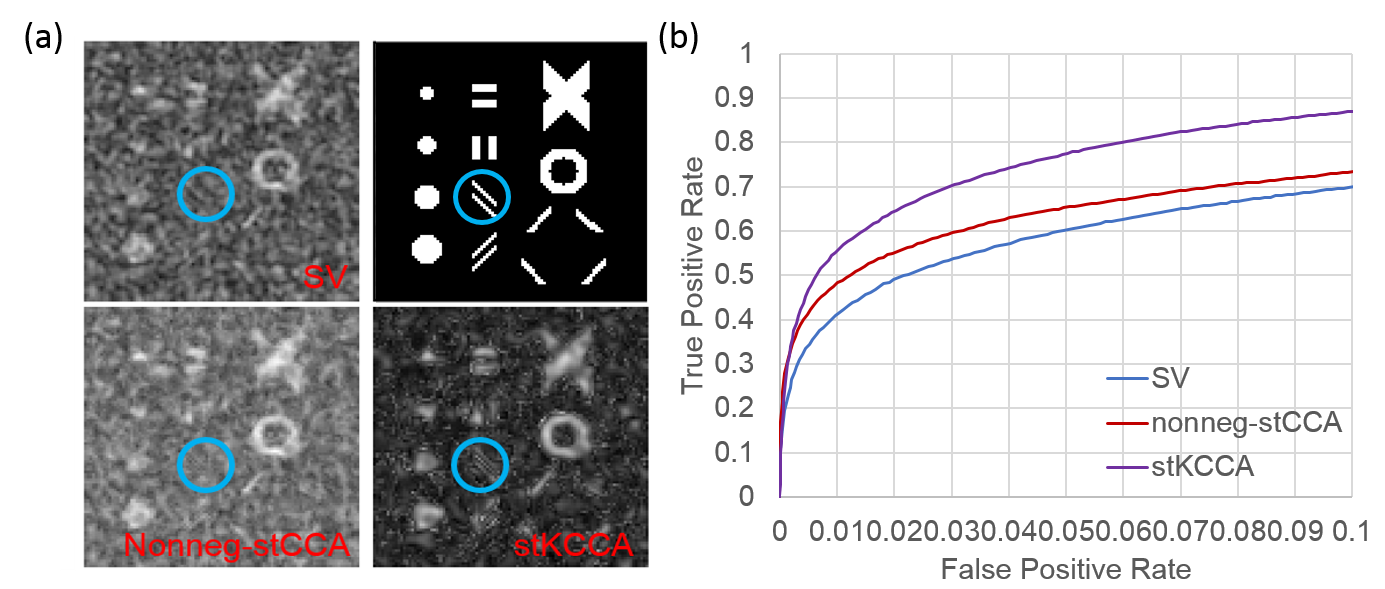
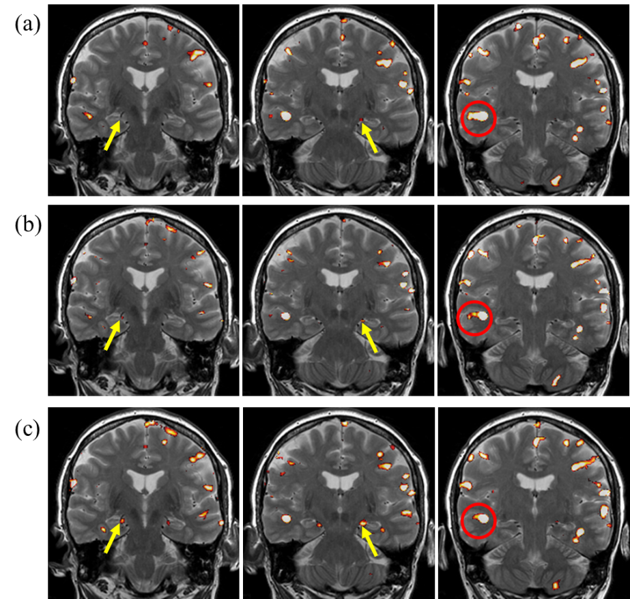
Fig.1 shows the construction of seven steerable filters. Isotropic Gaussian filter (FWHM=4mm) is used as low pass filter $$$F_{orig}$$$. Seven steerable filters are constructed by element-by-element product of low pass filter $$$F_{orig}$$$ with oriented weight functions ($$$G_{iso}$$$ and $$$G_i, i=1,..., 6$$$). Fig.2 shows the correlation maps and receive operating characteristic (ROC) curves of these methods in the simulation. Fig.3 presents the F statistic maps at p value 10-4 for SV, nonneg-stCCA and stKCCA.DISCUSSION
With simulated data, stKCCA shows the largest area under ROC curve and correctly estimates the orientation of activated regions. With real fMRI data, as shown in the area circled in red, both nonneg-stCCA and stKCCA activation pattern are following the spatial contour of gray matter without any significant blurring, quite opposite to the SV method which shows a very strong smoothing artifact. The proposed stKCCA has shown the strongest activation in hippocampus. The stKCCA method differentiates itself from local CCA approaches in several aspects. First, it considers the time series of the entire brain instead of only a local neighborhood, and the filtering orientations are adaptively estimated simultaneously for all voxels during analysis. Second, no constraint is applied in stKCCA and overfitting problems are alleviated by adjusting a single regularization parameter. The optimal regularization parameter for stKCCA can be found by a grid search algorithm without considerable time cost. Last, stKCCA is much faster than local CCA approaches because stKCCA can be converted to a purely algebraic problem whereas the local CCA approaches usually need optimization algorithms for obtaining solutions.CONCLUSION
We have investigated the performance of proposed global kernel CCA method and compared it with commonly used multivariate and univariate method. Our study shows stKCCA is a time efficient and highly accurate adaptive method for fMRI activation detection.Acknowledgements
This research project was partially supported by the NIH (grant number 1R01EB014284 and COBRE grant 1P20GM109025).References
[1] Friman, O., Borga, M., Lundberg, P., Knutsson, H., (2003). Adaptive analysis of fMRI data. NeuroImage, 19(3), pp.837-845.
[2] Knutsson, H., Wilson, R., Granlund, G.H., (1983). Anisotropic nonstationary image estimation and its applications: Part 1-Restoration of noisy images, IEEE Trans. Commun., vol. 31, no. 3, pp.388-397.
[3] Hardoon, D.R., Szedmak, S., Shawe-Taylor, J., (2004). Canonical correlation analysis: an overview with application to learning methods. Neural Computation 16, 2639-2664.
Figures