5324
Evaluating the impact of SNR, sampling interval and number of samples on functional sensitivity using the General Linear Model framework1Wellcome Trust Centre for Neuroimaging, UCL Institute of Neurology, London, United Kingdom, 2Department of Radiology, Brigham and Women’s Hospital, Harvard Medical School, Boston, MA, United States
Synopsis
In fMRI, functional sensitivity is dictated by many factors related to the data acquisition scheme, most notably image SNR, temporal resolution and the number of samples acquired. Advanced acquisition techniques, such as 2D multiband imaging, are popular for fMRI studies because they afford the possibility of greatly increasing temporal resolution allowing more samples to be acquired per unit time, but at the cost of image SNR and increased temporal auto-correlations. This study uses the General Linear Model framework to disentangle these effects and determine the net impact on functional sensitivity, as parameterised via temporal SNR and t-scores.
Introduction
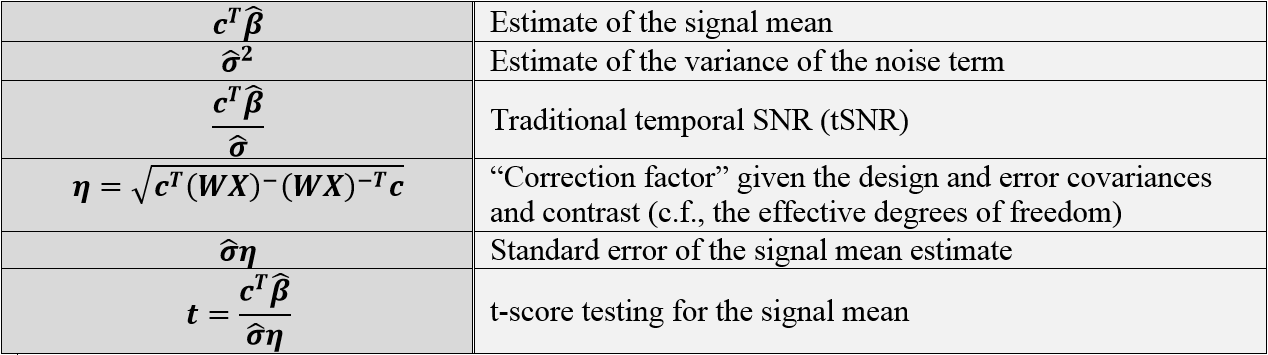
In fMRI, the most common method of detecting task-induced BOLD activation in data Y is via voxel-wise (mass univariate) general linear models (GLM): $$Y=X\beta+\epsilon, \epsilon\sim\mathcal{N}(0,\sigma^2V)$$ X is the GLM’s design matrix. Each row represents a single observation (i.e. acquisition volume). Each column represents an explanatory variable, for which $$$\beta$$$ constitute the regression coefficients. We assume $$$\epsilon$$$ to be Gaussian-distributed error with zero-mean and covariance $$$\sigma^2V$$$. To evaluate the significance of an effect of interest, $$$c^T\beta$$$, (c is a contrast vector of weights), a t-score is calculated:$$t=\frac{c^T\widehat{\beta}}{var(c^T\widehat{\beta})}=\frac{c^T\widehat{\beta}}{\widehat{\sigma}\sqrt{c^T(WX)^-(WX)^{-T}c}}=\frac{c^T\widehat{\beta}}{\widehat{\sigma}\eta}$$ $$$\widehat{\beta}=(WX)^-WY$$$ are maximum likelihood estimates. “-” denotes pseudoinverse. $$$W$$$ the whitening matrix, is defined as $$$W^TW=V^{-1}$$$. $$$V$$$ is a linear combination of a fixed set of covariance components modelling a mixture of white noise and a first-order autoregressive process1. Inference is performed by comparing the computed t-score with a statistical threshold at a nominal significance level.
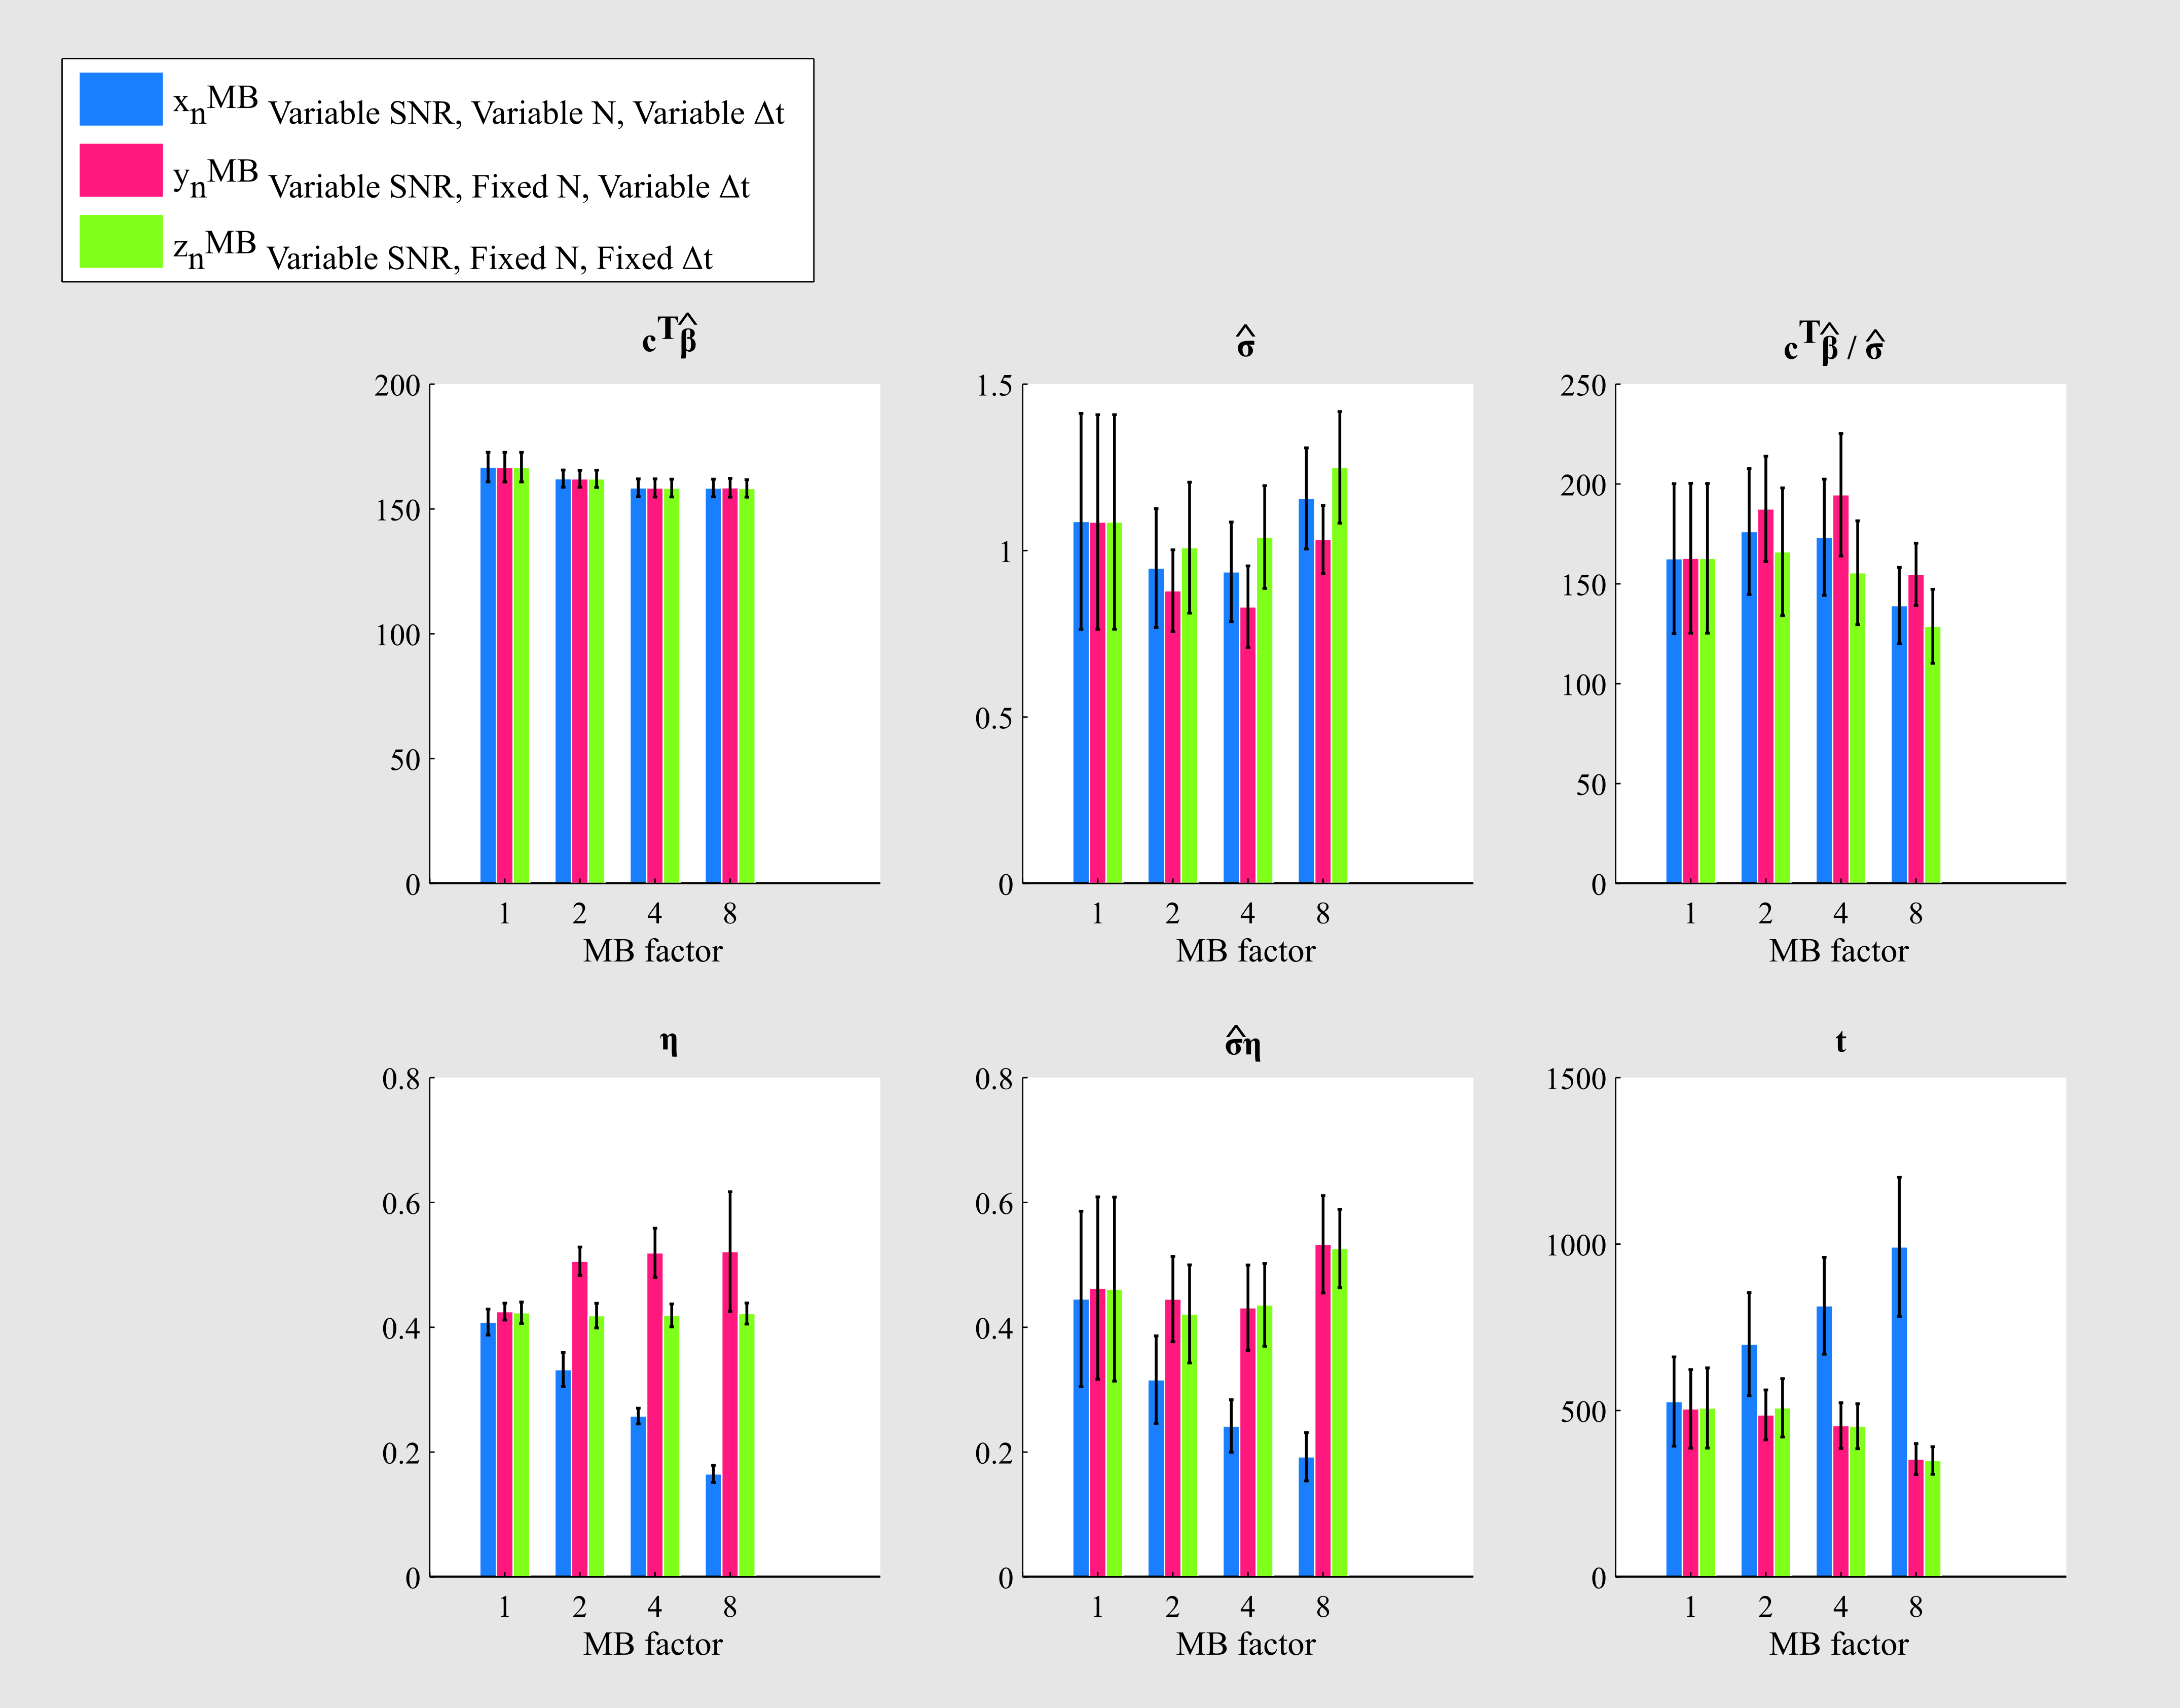
Multiband acquisitions afford increased temporal resolution2-4 allowing more samples to be acquired for the same acquisition time and enabling physiological and BOLD signals to be better separated. Drawbacks include reduced SNR (lower steady-state magnetisation), increased g-factor (unfolding penalty) and greater temporal auto-correlation. Here we examine how number of samples (N), sampling interval (Δt) and multiband factor (MB) affect functional sensitivity by quantifying their effects on components of the t-score testing the mean (Fig.1).
Methods
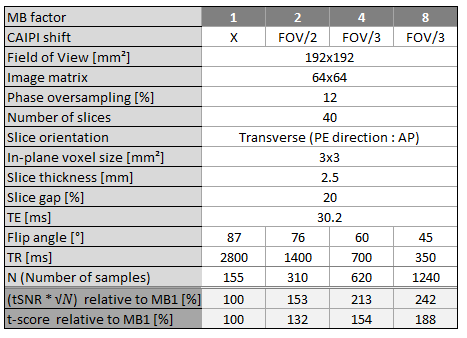
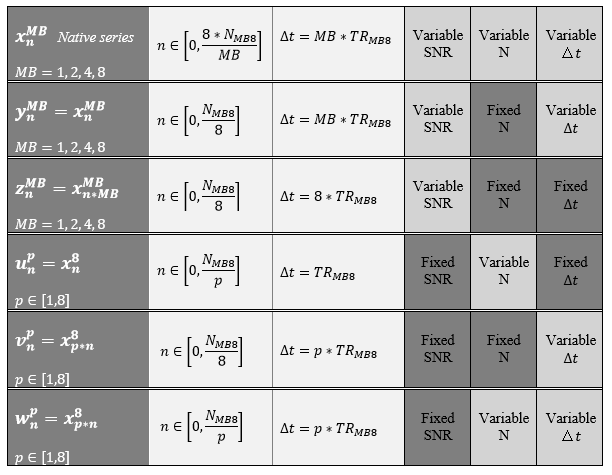
Task-based fMRI data were acquired for ~8mins, on 10 subjects, with MB=1,2,4,8, using the CMRR sequence (R012, https://www.cmrr.umn.edu/multiband/) summarised in Fig.2. Using SPM12, time series were realigned, smoothed, co-registered with a T1-weighted image, normalized to MNI space. To distinguish increasing N from temporal resolution, under constant SNR, several series were derived from the original MB8 series (Fig.3). All GLM design matrices comprised mean, high-pass filter (cut-off=128s), motion and stimuli-specific regressors. Physiological corrections were not performed. The t-score testing the mean and its constituent components were estimated. Each mean metric within grey matter was averaged across subjects.Results - Analysis of time series derived from MB=8 data to avoid confounds of varying SNR
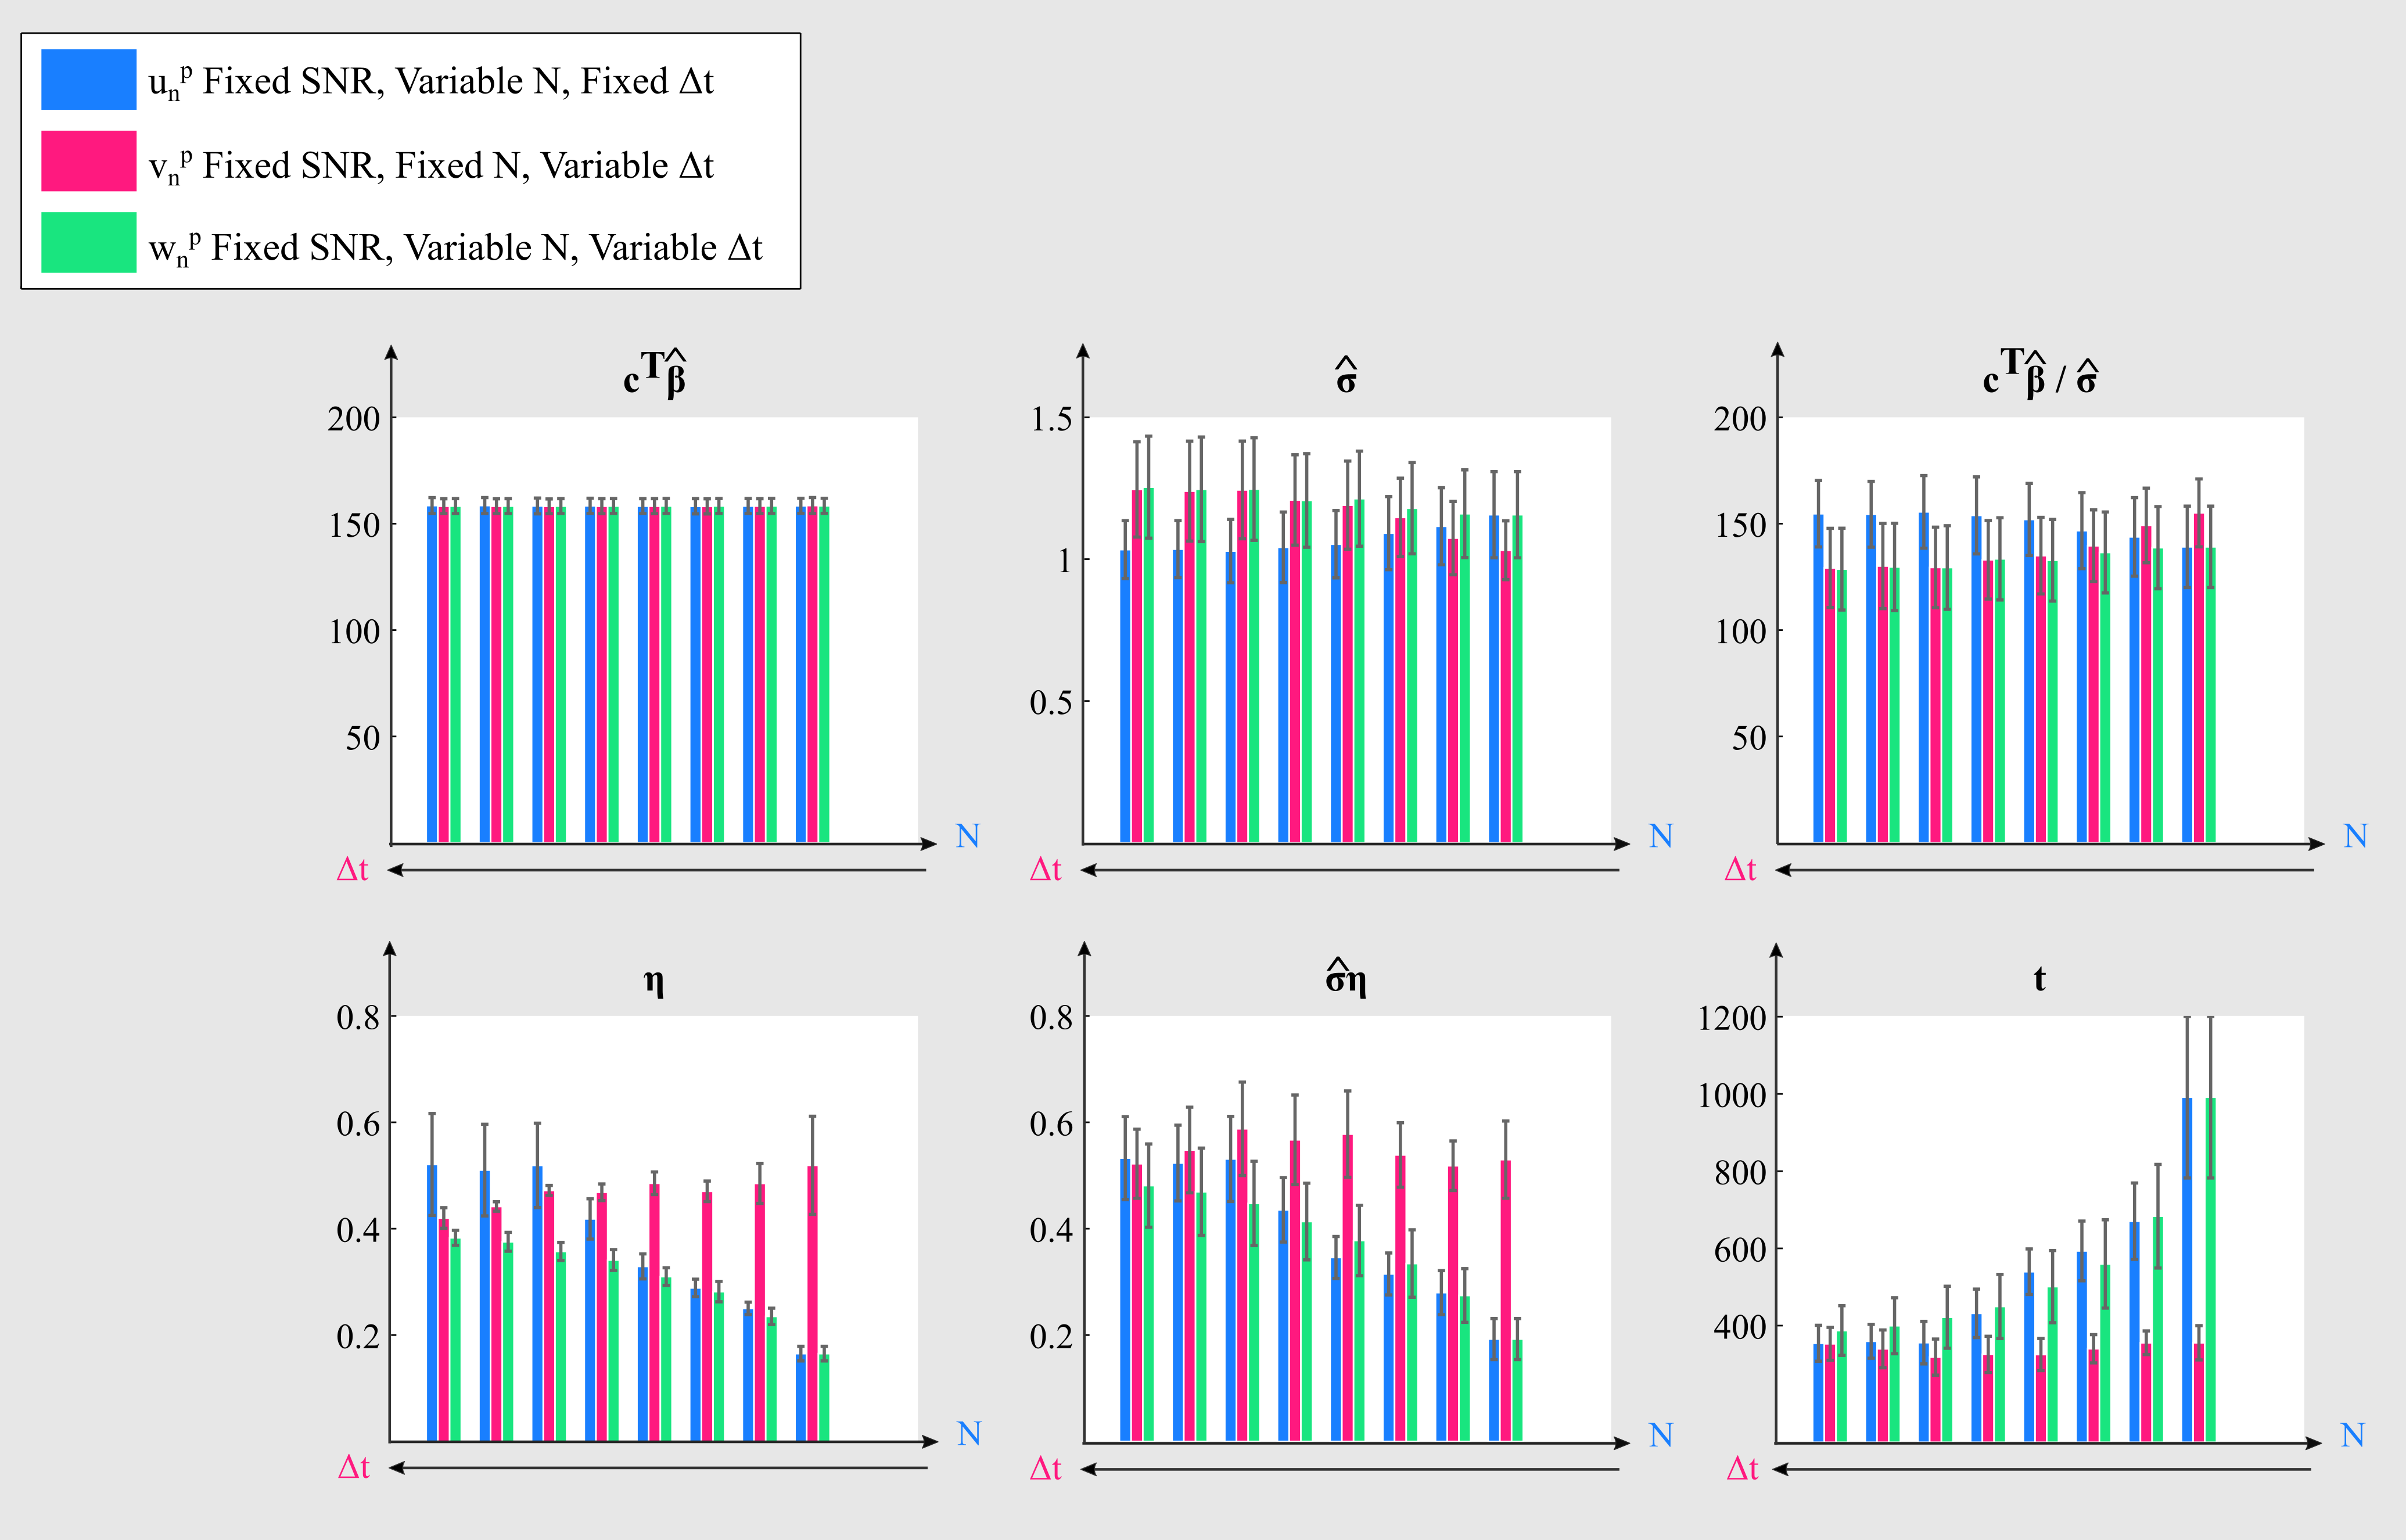
Increasing N (blue,Fig.1): The mean estimate is independent of N whereas the variance estimate slightly increases, resulting in a tSNR decrease. Since $$$\widehat{\sigma}$$$ is taken to be an unbiased estimate, it is more accurately estimated with higher N. The tSNR is therefore interpreted as being artificially high for low N. η greatly decreases, increasing the t-score.
Decreasing Δt (red,Fig.1): As Δt decreases, but >1.5s, the variance estimate remains stable, while η increases because of increased auto-correlation in the data. For Δt<1.5s, the variance decreases, increasing tSNR. η is also under-estimated, because of temporal correlations remaining in the data. The t-score initially decreases (Δt>1.5s) as expected but is then over-estimated.
Increasing N and decreasing Δt (green,Fig.1) for a fixed acquisition time, leads to an increase in t-score since dominated by the effect of increasing N.
Results - Analysis of time series acquired with varying MB factor
Increasing MB, while fixing Δt and N (green,Fig.4) reduces the mean signal (reduced steady-state magnetisation) and increases the noise variance (g-factor penalties), without changing η. The overall result is a lower estimated tSNR and t-score.
Increasing MB, while decreasing the Δt (red,Fig.4): The noise variance is likely under-estimated for high MB (due to remaining temporal auto-correlations). The tSNR is biased by this under-estimation such that MB4 appears to have highest tSNR. The t-score decreases with increasing MB, though may still be over-estimated.
In typical imaging scenarios, increasing MB is accompanied by decreasing Δt and, assuming a constant overall acquisition time, increasing N (blue,Fig.4). The net effect is decreasing tSNR. However, the increase in N dominates (via η), such that t-scores greatly increase.
Discussion
Many studies assess functional sensitivity as tSNR per unit time (i.e. $$$tSNR*\sqrt{N}$$$, assuming fully independent data). However, this over-estimates the functional sensitivity improvement by failing to account for temporal auto-correlations and the effective degrees of freedom of the data (last rows, Fig.1). The GLM-derived t-score testing the mean estimates the mean signal relative to its estimated variance, accounting for temporal auto-correlations, giving a more reliable measure of functional sensitivity. However, for very short TR, the AR(1) plus white noise model (used here) is not guaranteed to sufficiently model temporal auto-correlations.Conclusion
The key insight from this analysis is that improving functional sensitivity is not simply a matter of reducing the amplitude of random fluctuations (that may be irreducible if physiologically-mediated). More interesting is how efficiently both signal amplitude and random fluctuations can be estimated. In other words, one has to quantify the uncertainty about signal estimates (via standard error) and uncertainty about the standard error (via statistical degrees-of-freedom). This framework can be used to evaluate the impact of different acquisitions/data-processing schemes, e.g. our analysis shows that MB profoundly changes the degrees-of-freedom (inverse η).Acknowledgements
The Wellcome Trust Centre for Neuroimaging is supported by core funding from the Wellcome Trust 091593/Z/10/Z.References
[1] K. J. Friston, W. Penny, C. Phillips, S. Kiebel, G. Hinton, and J. Ashburner, “Classical and Bayesian inference in neuroimaging: theory,” NeuroImage, vol. 16, no. 2, pp. 465–483, Jun. 2002.
[2] K. Setsompop, B. A. Gagoski, J. R. Polimeni, T. Witzel, V. J. Wedeen, and L. L. Wald, “Blipped-controlled aliasing in parallel imaging for simultaneous multislice echo planar imaging with reduced g-factor penalty,” Magn. Reson. Med., vol. 67, no. 5, pp. 1210–1224, May 2012.
[3] C. Preibisch, G. Castrillón, M. Bührer, and V. Riedl, “Evaluation of multiband EPI acquisitions for resting state fMRI,” PLoS ONE, vol. 10, no. 9, 2015.
[4] N. Todd, S. Moeller, E. J. Auerbach, E. Yacoub, G. Flandin, and N. Weiskopf, “Evaluation of 2D multiband EPI imaging for high-resolution, whole-brain, task-based fMRI studies at 3T: Sensitivity and slice leakage artifacts,” NeuroImage, vol. 124, pp. 32–42, 2016.
Figures