5322
Modeling the hemodynamic response function in rat fMRI study1Department of Biomedical Imaging and Radiological Science, China Medical University, Taichung, Taiwan, 2Center for Advanced Molecular Imaging and Translation, Chang Gung Memorial Hospital
Synopsis
Previous rat fMRI studies have been analyzed by statistical parametric mapping (SPM) but the SPM is designed for human fMRI studies. In this study, we examine whether the default settings including delay time, statistic methods and hemodynamic response function (HRF) shape in SPM can directly transform to rat fMRI studies. Results show statistic methods do not affect the mapping of brain activation. However, the delay time and HRF shapes have significant impacts on extracting brain activation, especially in primary somatosensory cortex and striatum. We therefore suggest the HRF should be optimized to approach better sensitivity in other rat fMRI studies.
PURPOSE
Functional magnetic resonance imaging (fMRI) using blood oxygenation level dependent (BOLD) is a useful means to extract the information regarding unobserved brain activity. In terms of preclinical studies, such as cortical reorganization, rat fMRI studies play crucial roles in better understanding of neuroscience. Thus, precisely modeling the evoked hemodynamic response to a neural activity is important. Previous rat fMRI studies have been analyzed by statistical parametric mapping (SPM)1, 2. Since SPM is developed for human fMRI studies, default parameters setting such as delay time and hemodynamic response function (HRF) are designed for human as well. Given that rats may characterize different features of neural activity under anesthesia, default settings in SPM adopted to rat fMRI studies may loss the power and validity. Therefore, the goal of this study is to systematically examine whether the default settings including delay time, statistic methods and HRF shape in SPM can directly transform to rat fMRI studies.METHODS
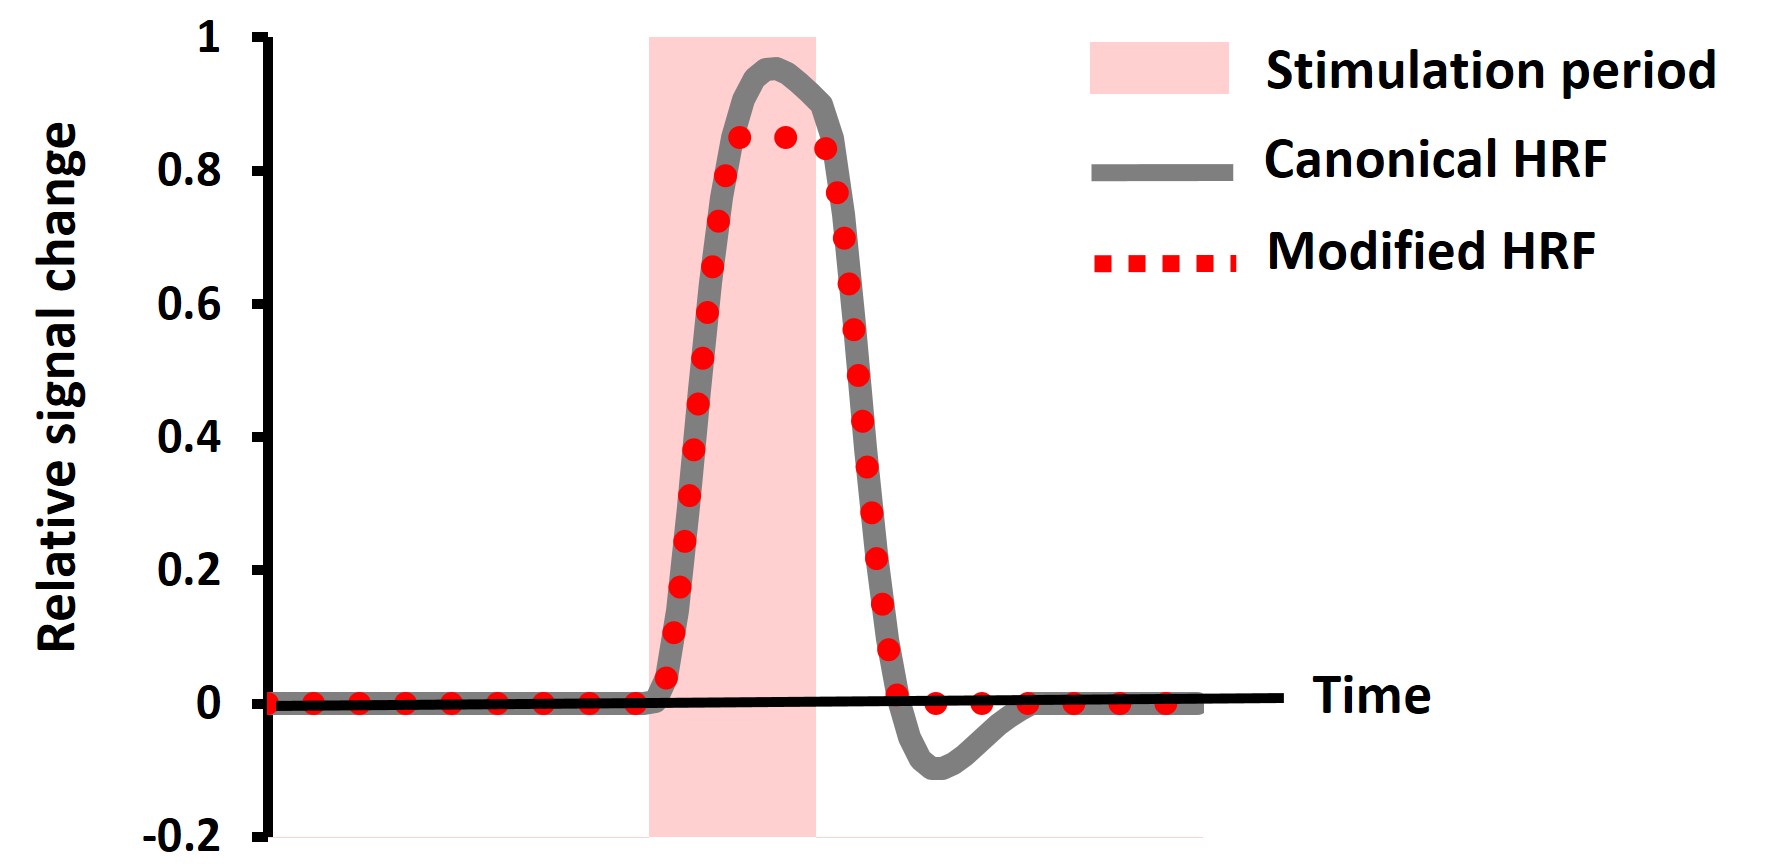
This study was approved by the local institutional animal ethics committee. Nine SD rats were scanned by a 7T animal MRI scanner (Bruker) and anesthetized with isoflurane throughout experiments. Needle electrodes inserted under the skin of the left mystacial pad and a stimulator supplying current of 3mA and frequency of 3Hz invoked activation in the primary somatosensory cortex barrel field (S1BF). A block-designed stimulation paradigm with 75 sec resting followed by 15 sec stimulation was delivered. The BOLD images were simultaneously acquired during the stimulation with parameters of TR=1000 ms, TE=25 ms, flip angle=90°, FOV=30 mm, and matrix size=64x64. Study 1: Effects of delay time setting and statistical strategies on data analysis. The definition of delay time is the lag of BOLD signal behind the onset of the stimulation. For the canonical HRF used in SPM5, the default setting is 1 sec (1s). In this study, the delay times shifted from -4s to 4s were examined. To test whether different statistical methods affect the mapping of brain activation, two commonly used statistics including cross-correlation3 and general linear model (GLM)4 were employed. For cross-correlation, relationships between evoked BOLD signals and the canonical HRF with different delay times were tested; for GLM, evoked BOLD signals were set as the dependent variable while the canonical HRFs with different delay times were respectively set as a regressor. Study 2: Effect of HRF shapes on data analysis. The canonical HRF used in SPM5 consists of a linear combination of two gamma functions, showing a clear peak to represent the BOLD signal change (Figure 1). However, such pronounced peak is not commonly observed in rat fMRI studies. Thus, a modified HRF with a plateau was proposed (Figure 1). The statistical maps obtained by different HRFs were compared as well.RESULTS and DISCUSSION
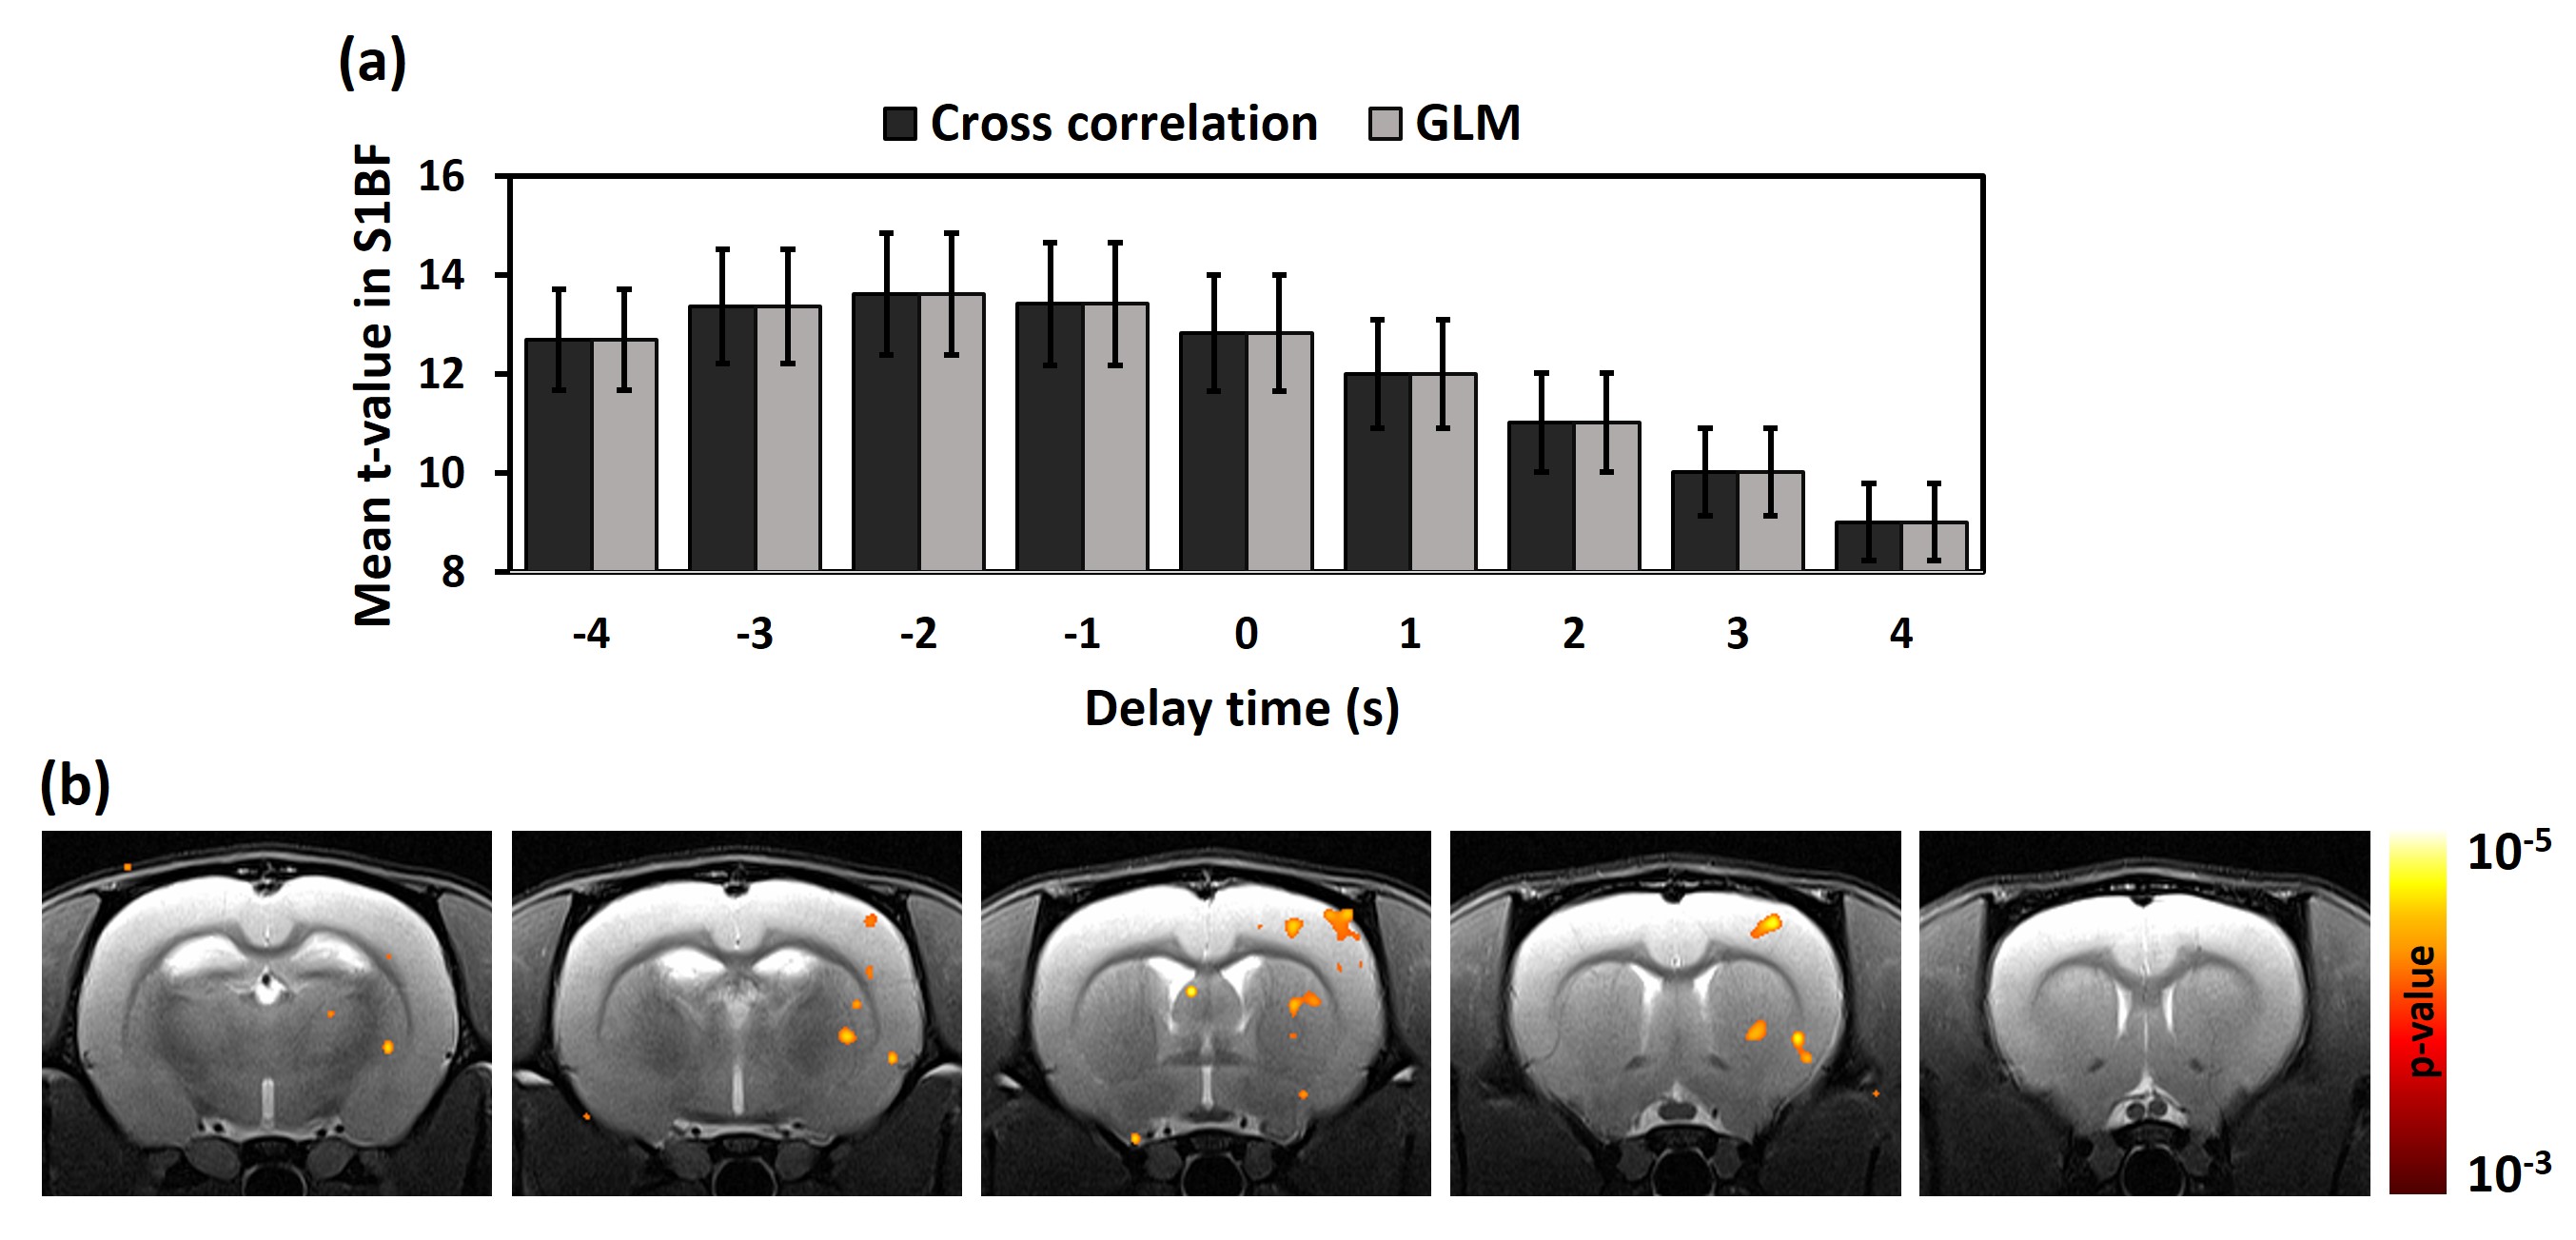
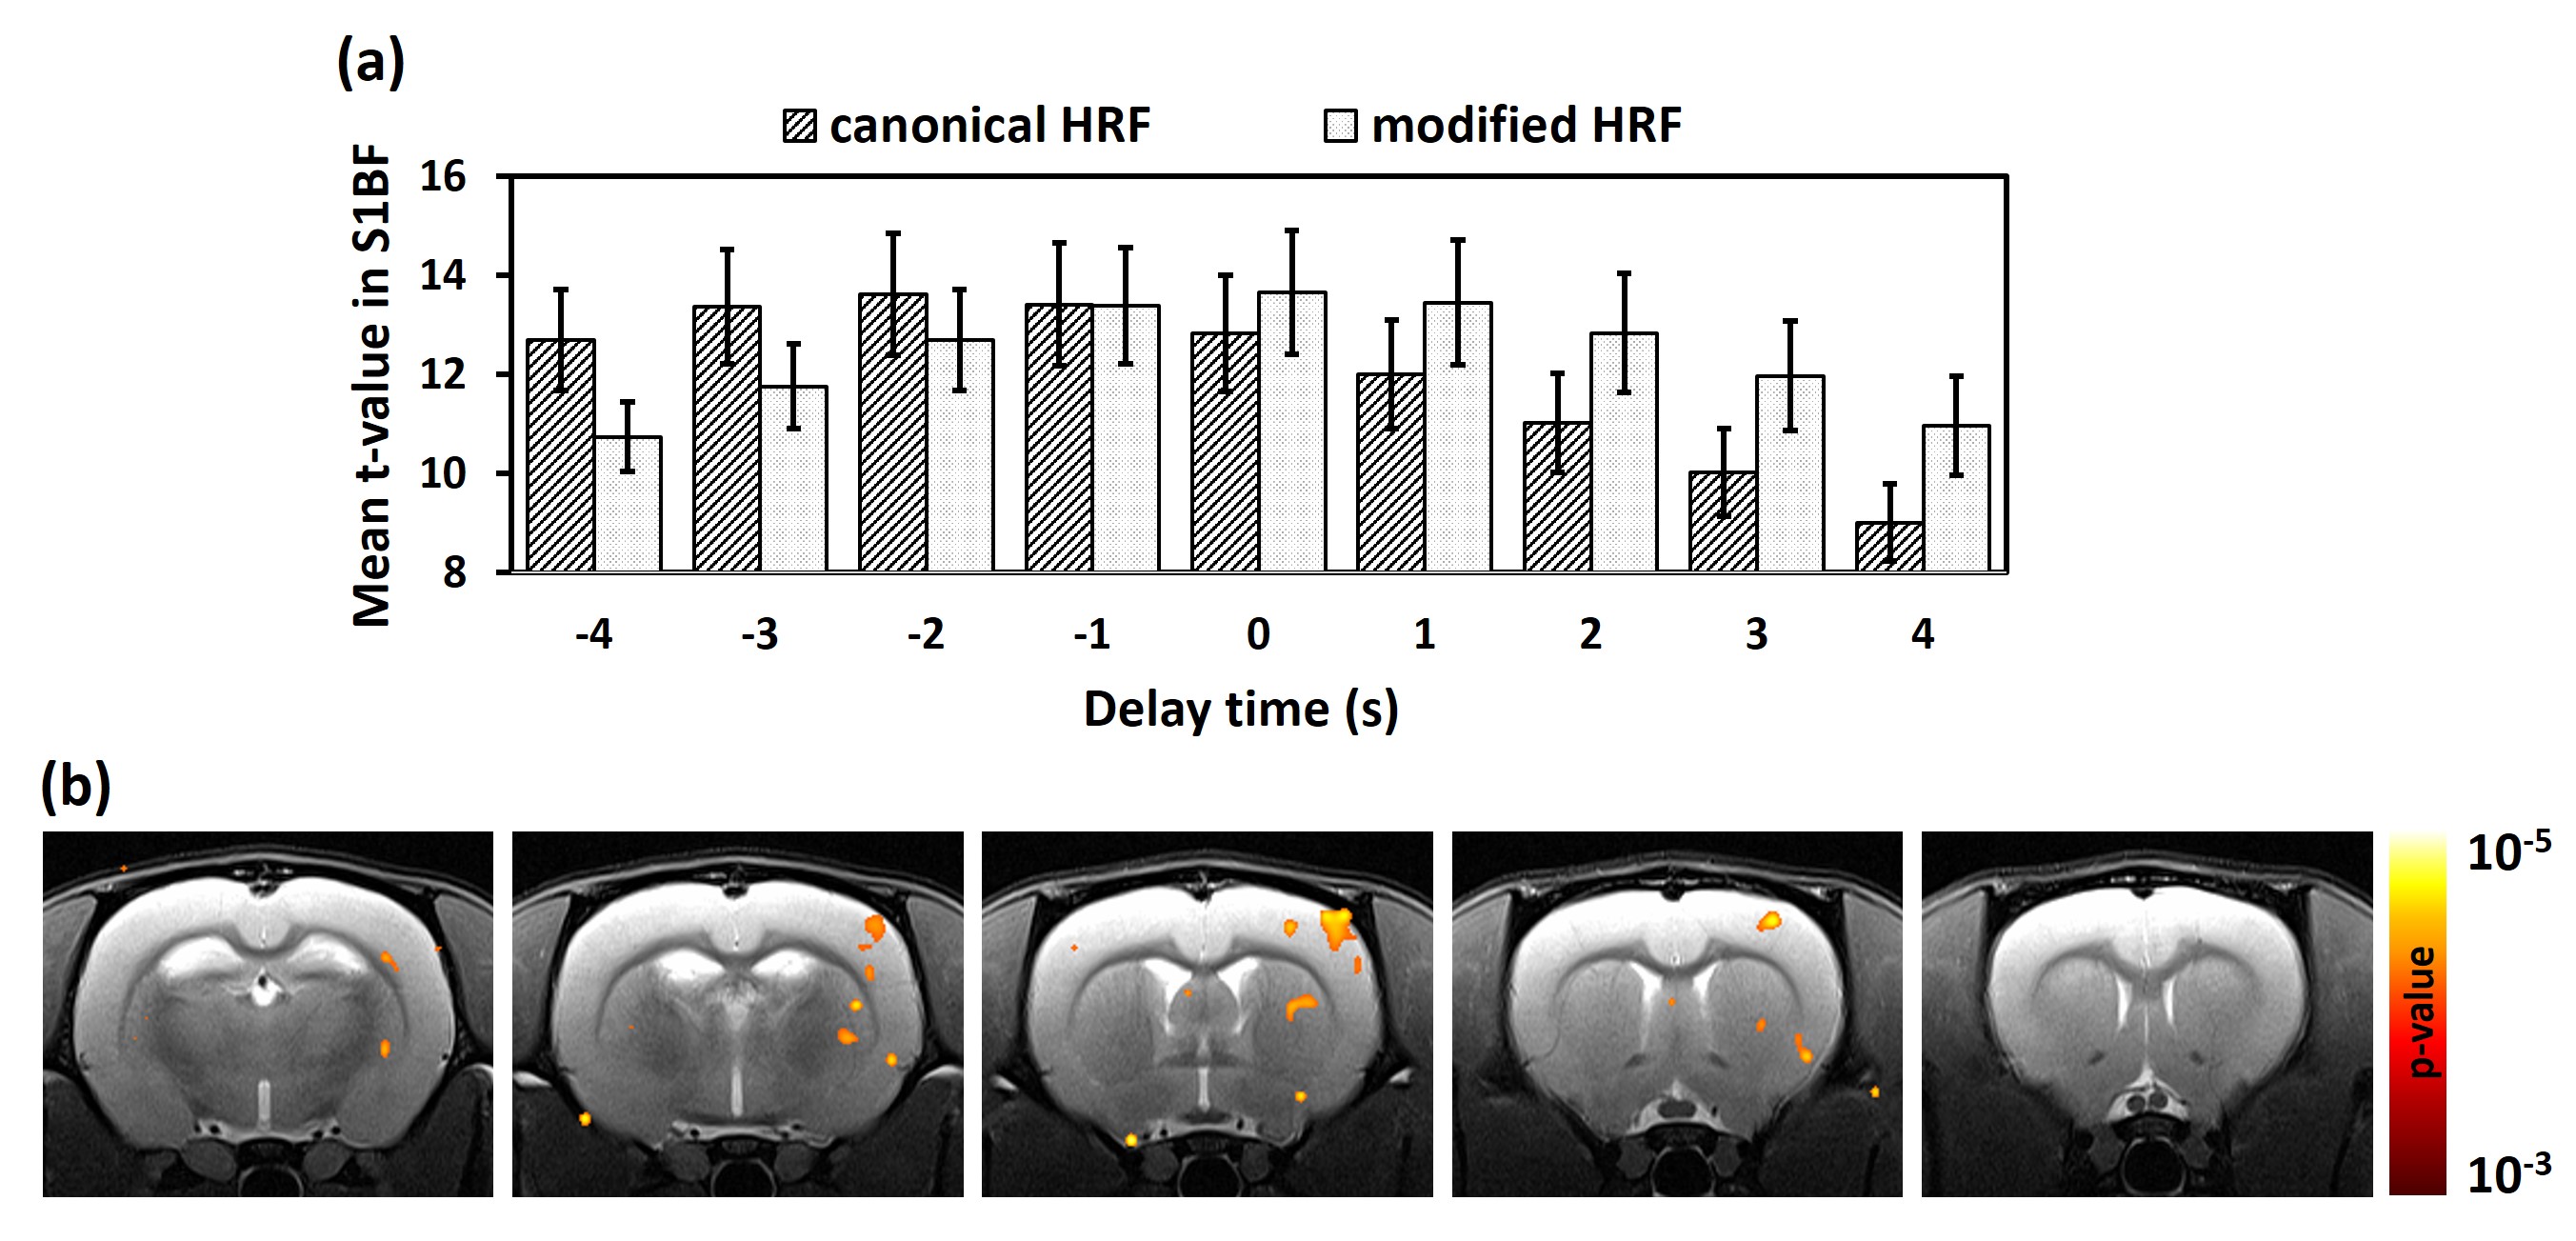
Study 1: Figure 2a displays mean t-values in S1BF from 9 rats by two different statistical strategies. It is obvious both statistical methods result in identical t-values, supporting the idea when there is only one variable, it does not matter which of strategies in used5. When taking the delay time into consideration, the canonical HRF with delay time of -2s demonstrates the maximized statistical power. The group comparison between canonical HRF with delay time of 1s and that with delay time of -2s is shown in Figure 2b. The canonical HRF with delay of -2s shows the leverage in detecting the neuronal activation in S1BF and striatum. Since the delay time of -2s implies the brain response precedes the stimulation and it is not the case in rat fMRI studies, we hypothesized the default canonical HRF in SPM may not be appropriate for rat fMRI studies. We therefore proposed a modified HRF for the following test. Study 2: Mean t-values in S1BF from 9 rats by using canonical HRF and modified HRF are shown in Figure 3a. When setting the modified HRF as the regressor, the statistical power was higher than that of canonical HRF if the delay time > 0s. The group comparison between canonical HRF of delay time of 1s (default in SPM5) and modified HRF of delay time of 0s (maximized statistical power) suggests the modified HRF is more capable of extracting the brain activity in S1BF and striatum (Figure 3b).
CONCLUSION
In this study, influences of delay time and the shape of estimated HRF on extracting brain activation during rat mystacial pad electric stimulation were investigated. We suggest the default canonical HRF in SPM may not be the optimal model for rat fMRI studies. The HRF should be optimized to approach better sensitivity in different kinds of rat fMRI studies.Acknowledgements
This work was supported by MOST-105-2815-C-039-032-B and MOST-105-2314-B-039-044-MY2.References
1. Just N, Xin L, Frenkel H, Gruetter R. Characterization of sustained bold activation in the rat barrel cortex and neurochemical consequences. NeuroImage. 2013;74:343-351
2. Wehrl HF, Hossain M, Lankes K, Liu CC, Bezrukov I, Martirosian P, et al. Simultaneous pet-mri reveals brain function in activated and resting state on metabolic, hemodynamic and multiple temporal scales. Nature medicine. 2013;19:1184-1189
3. De La Garza BH, Muir ER, Li G, Shih YY, Duong TQ. Blood oxygenation level-dependent (bold) functional mri of visual stimulation in the rat retina at 11.7 t. NMR in biomedicine. 2011;24:188-193
4. Tambalo S, Peruzzotti-Jametti L, Rigolio R, Fiorini S, Bontempi P, Mallucci G, et al. Functional magnetic resonance imaging of rats with experimental autoimmune encephalomyelitis reveals brain cortex remodeling. The Journal of neuroscience : the official journal of the Society for Neuroscience. 2015;35:10088-10100
5. Bewick V, Cheek L, Ball J. Statistics review 7: Correlation and regression. Critical
Figures