5321
Deciphering the functional projections of the lateral hypothalamus with optogenetic fMRI1Translational Neuroimaging and Neural Control Group, High-Field Magnetic Resonance Department, Max-Planck Institute for Biological Cybernetics, Tuebingen, Germany
Synopsis
The lateral hypothalamus (LH) is a central node of the brain to mediate brain states. It is comprised of highly heterogeneous neuronal populations and diverse projections. It remains elusive how different neuronal LH subdivisions mediate the brain state. Here, we developed an optogenetic method to map LH functional projections and investigate functional connectivity upon LH activation. Optical stimulation of the LH can directly activate the preoptic area, central thalamus and the subiculum area, and increase the cortical resting-state correlation. This work makes it possible to further target different LH neuronal populations and decipher cell-type specific functional projections.
Purpose
The lateral hypothalamus (LH) is a central node of the brain to mediate brain states1. It has highly heterogeneous neuronal populations and diverse projections2,3. It remains elusive how different neuronal LH subdivisions mediate the brain state. Here, we have developed an optogenetic method to map LH functional projections and investigate functional connectivity upon LH activation. Optical stimulation of the LH shows to directly activate the preoptic area, central thalamus and the subiculum area. Although no direct cortical BOLD-fMRI signal is detected upon LH activation, the cortical resting-state correlation increases upon the increased duration of the LH optical stimulation. This work makes it possible to further target different LH neuronal populations and decipher the cell-type specific functional projections in future studies.Methods
Male Sprague-Dawley rats (4-weeks old) were transfected with a viral construct expressing a channelrhodopsin (CAG::ChR2-mCherry, supplied by UPenn vector core) in the lateral hypothalamus. Optogenetic fMRI experiments were performed in 6-8 weeks following the viral injection. A detailed procedure was described previously4. A fiberoptic was implanted to target the LH for optogenetic stimulation (stereotaxic coordinates: M/L -1.15, A/P -3.85, D/V 7.45). The fiber was coupled to a 473 nm Laser (Changchun New Industries). Stimulus duration lasted for 4/8/15 s with a frequency of 10 Hz and a pulse width of 20 ms. At the resting-state condition, no optical stimulation was given. All MRI scans were acquired with a 14.1 T/26cm horizontal bore magnet (Magnex), connected to an AVANCE III console (Bruker). This setup was equipped with a 12 cm gradient set, capable of providing 100 G/cm with a rise time of 150 us (Resonance Research). For image acquisition, a transreceiver surface coil was used. Increases in BOLD-response were determined using custom AFNI scripts. F-Statistics were calculated by deconvolution with a stimulus time series block design of equal length to the stimulus paradigm. The data from two animals was registered to one another and averaged. The extracted time courses were taken from one representative voxel centrally located in each area. For determining correlations between the hemispheres in the resting-state analysis, a ROI was drawn covering parts of the somatosensory cortex. The average time course from this ROI was correlated to its respective trial. The threshold was set to a correlation coefficient p-value of 8.-34.Results
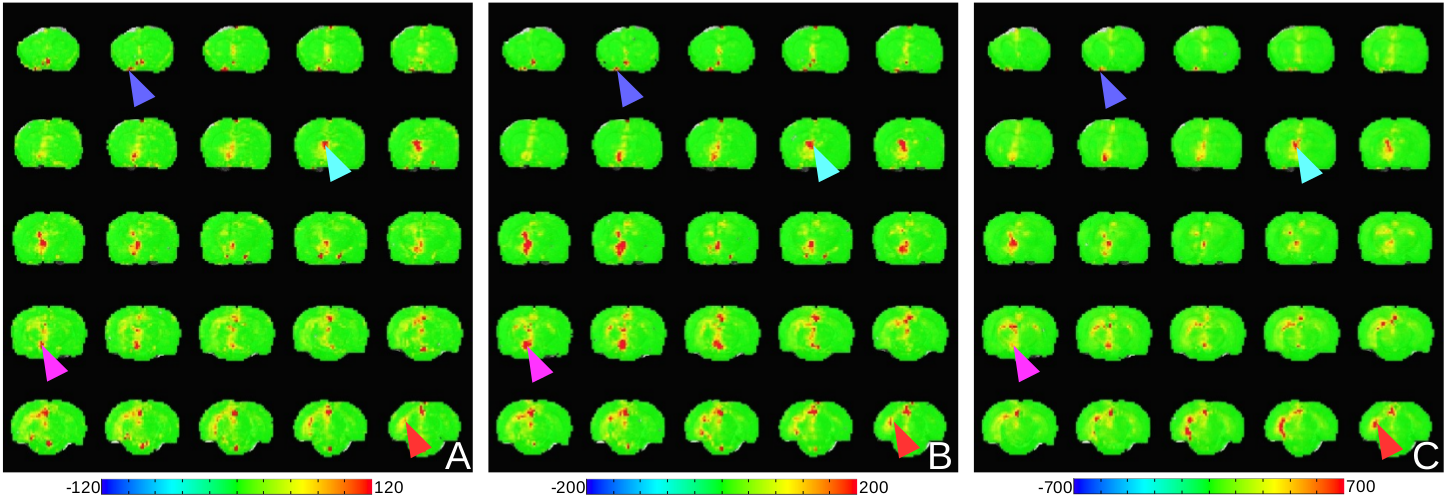
Functional mapping of the downstream network of the lateral hypothalamus under anesthesia with optogenetic methods revealed a wide-branching network of subcortical regions. A stimulation paradigm comprised of 3 different stimulus durations showed an intensity-related increase in BOLD response (Fig 1). The activated subcortical areas were restricted to the same hemisphere where the optic fiber was placed, e.g. the preoptic area, the central thalamic area and the subiculum area. However, no significant BOLD signal was detected in the cortex upon optical stimulation of the LH.
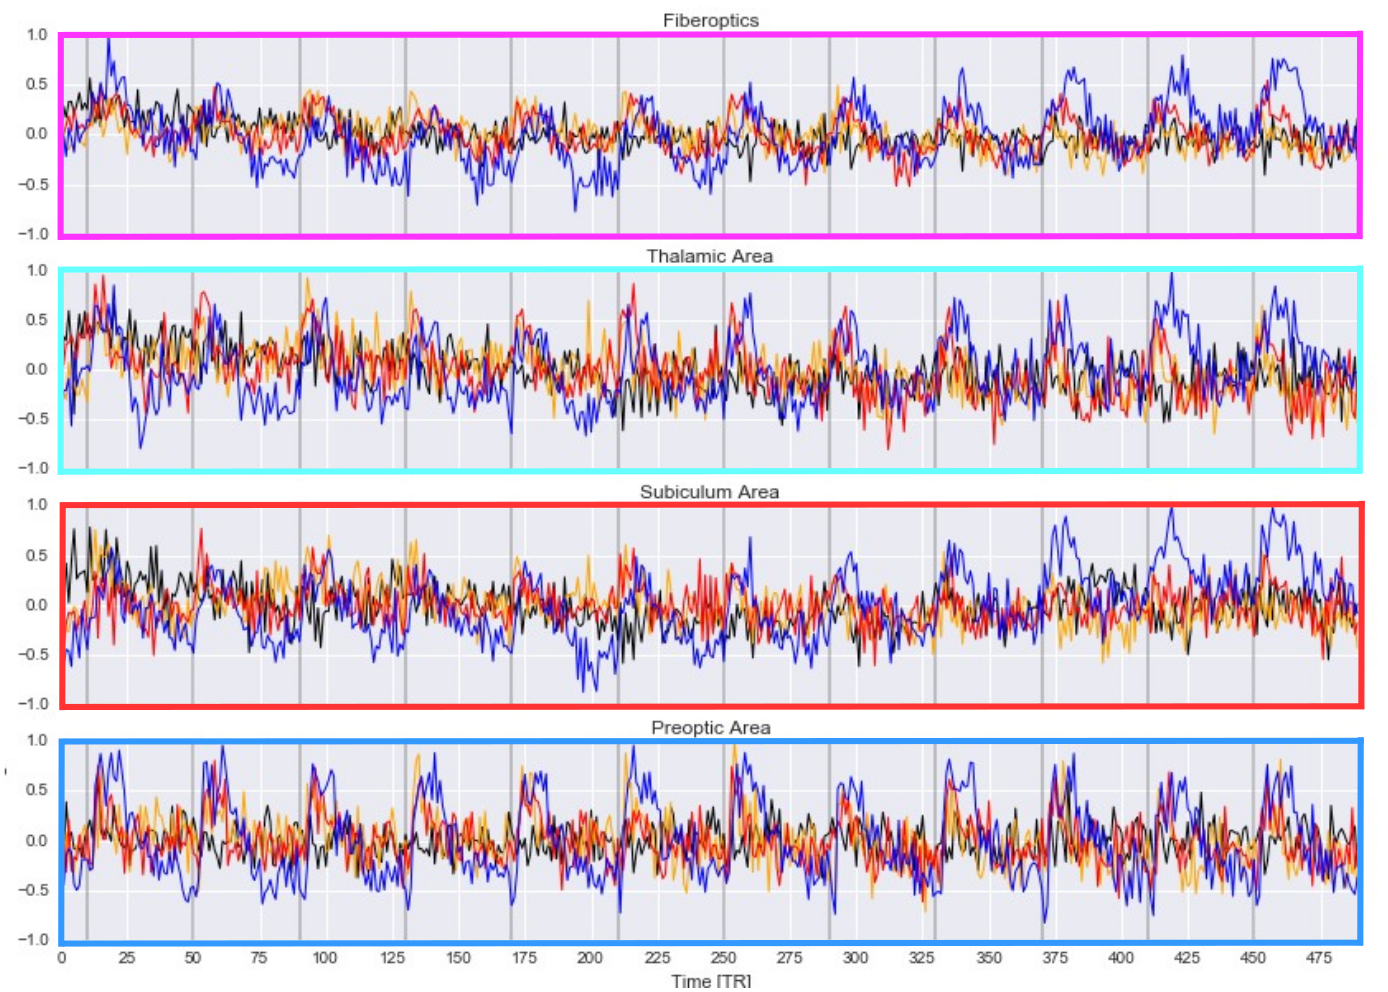
The time courses from these four areas were taken to confirm the BOLD response to optogenetic stimulation (Fig 2).
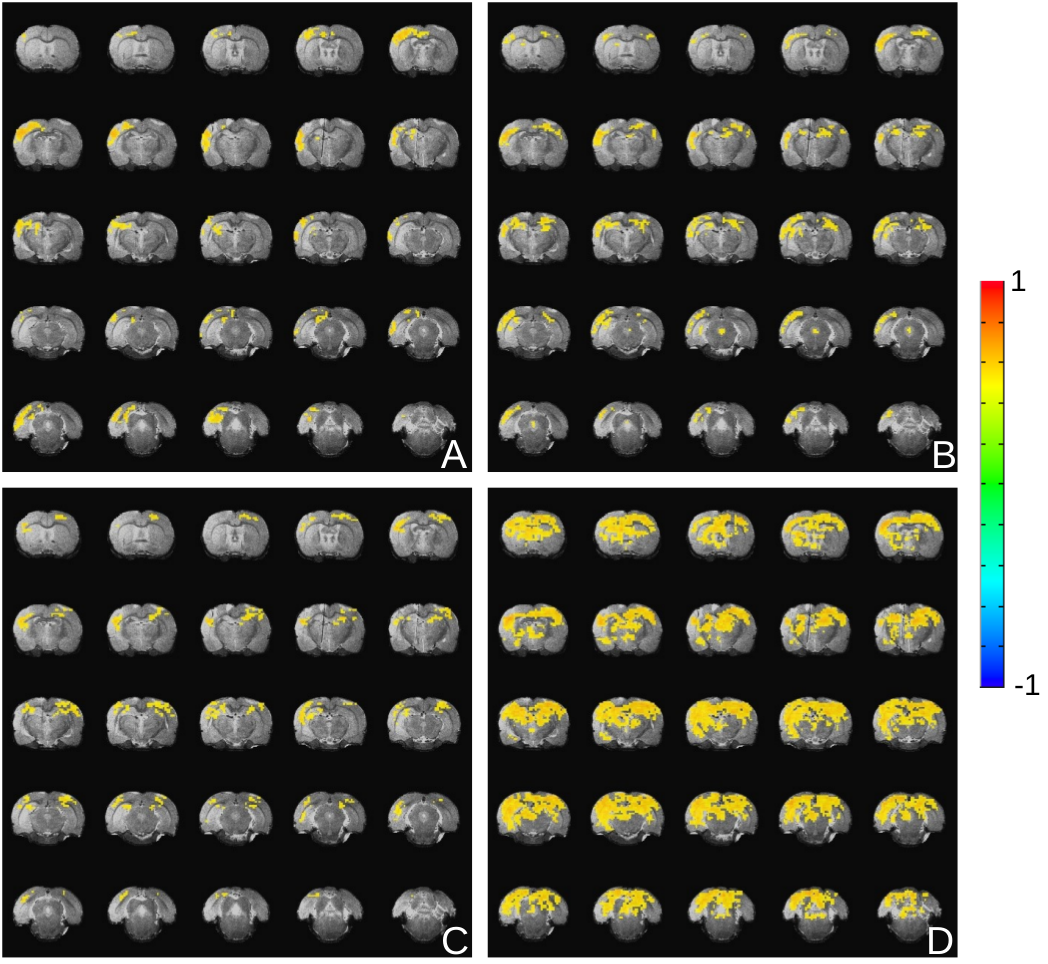
The resting-state fMRI data, as well as the fMRI data with LH activation, were correlated with a time course extracted from a ROI drawn into the somatosensory cortex on the side of the implanted optic fiber. With increased stimulus duration, there is drastically more correlation between the two hemispheres. Under anesthesia, there was strong correlation in the ipsilateral cortex, but no correlation on the contralateral side during the resting state. For the 4s and 8s LH activation, the signal correlated with the other hemisphere as well. During the 15s stimulation, strong cortical and subcortical correlations were detected in both hemispheres (Fig 3).
Conclusion
In our experimental approach of stimulating the lateral hypothalamus optogenetically under alpha-chloralose anesthesia, increases of functional activity were detected in different subcortical structures. Cortical functional connectivities were influenced in a resting-state analysis, but most of the activity was restrained to the subcortical regions. This suggests that changes to cortical correlations may be modulated indirectly by nodes downstream of the lateral hypothalamus instead of using direct innervations.Acknowledgements
This work was made possible by internal support from the Max-Planck Institute for Biological Cybernetics. We thank all staff from the High-Field Magnetic Resonance Department for their support.References
1: C. B. Saper, T. E. Scammell, and J. Lu. Hypothalamic regulation of sleep and circadian rhythms. Nature, 437(7063):1257–1263, Oct 2005.
2: T. Mochizuki and K. Yoshida-Court. Input and output systems of orexin neurons. In T. Sakurai, S. R. Pandi-Perumal, and J. M. Monti, editors, Orexin and Sleep. Molecular, Functional and Clinical Aspects. Springer International Publishing Switzerland, 2015.
3: T. Nambu, T. Sakurai, K. Mizukami, Y. Hosoya, M. Yanagisawa, and K. Goto. Distribution of orexin neurons in the adult rat brain. Brain Res, 827(1-2):243–60, May 1999.
4: X. Yu, Y. He, M. Wang, H. Merkle, S. J. Dodd, A. C. Silva, and A. P. Koretsky. Sensory and optogenetically driven single-vessel fMRI. Nat Meth, 13(4):337–340, Apr 2016.
Figures