5320
fMRI-based brain responses to bitter and sucrose gustatory stimulation for nutrition research in the minipig model1UR1341 ADNC, INRA, Saint-Gilles, France, 2UR TERE, IRSTEA, Rennes, France, 3UMR1099, INSERM, Rennes, France
Synopsis
The minipig model is of high interest for brain research in nutrition and associated pathologies considering the similarities to human nutritional physiology, brain structures and functions1,2 . In the context of a gustatory stimulation paradigm, fMRI can provide crucial information about the sensory, cognitive and hedonic integration of exteroceptive stimuli in healthy and pathological nutritional conditions. To date, this is the first intent to describe gustatory stimulation in minipigs using fMRI.
Purpose
Methods
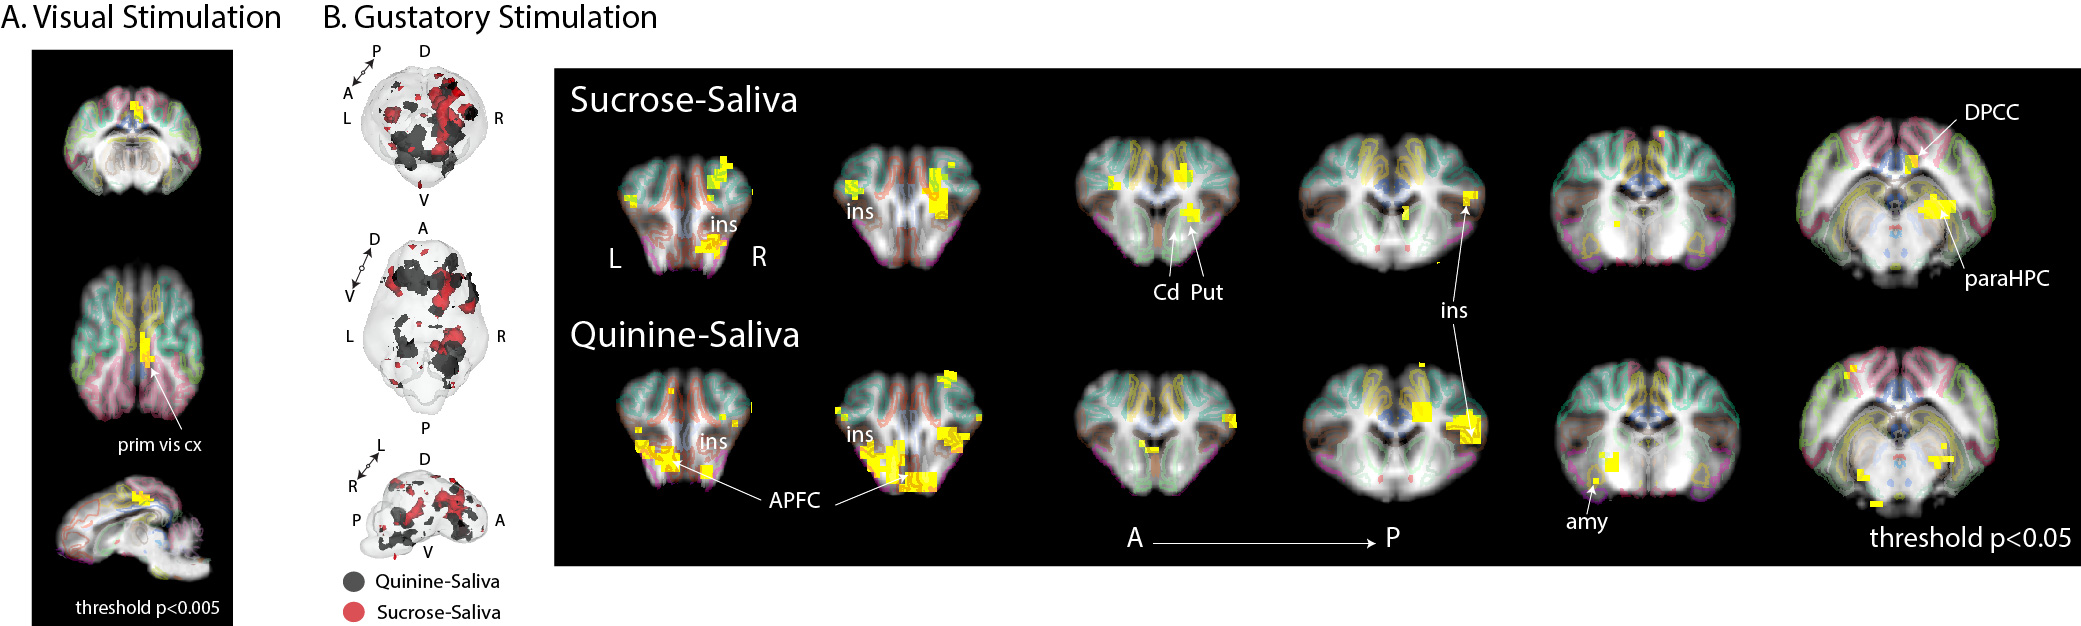
Six 18-month-old Yucatan minipigs were imaged on an Avanto 1.5 T MRI (Siemens) under anaesthesia (2-2.5% isoflurane) and mechanical ventilation. A home-made stimulation system (INRA) was developed for visual and gustatory stimulation. Visual stimulation3: n=9, 8Hz, right eye only, stimulation ON: 20s, OFF:20s, 15 repetitions. Gustatory stimulation: n=8, stimulation (artificial saliva, sucrose 5%, or bitter 10mM): 5s at 24mL/min, pause: 15s, rinse (artificial saliva): 10s at 24mL/min, pause: 10s, 15 repetitions. MRI acquisition: MPRAGE for anatomy and registration: 1.2x1.2x1.2mm3, TE: 3.62ms, TR: 2400ms, TI:854ms; Epi for BOLD imaging: 2.5x2.5x2.5mm3, TE: 40ms, TR: 2500ms. Image analysis: registration on pig Atlas4 and functional activation statistics with SPM12 with a threshold set to p<0.005 for visual brain activation and p<0.05 for gustatory brain activation (both uncorrected).Results/Discussion
Contralateral left visual cortex activation was detected with visual stimulation of the right eye, which validates our experimental set-up and statistical analysis procedure (Fig.1A). Quinine and sucrose stimulation promoted different cerebral activation patterns (Fig.1B, left, deactivations are not shown). Details in brain regions involved in each stimulation are shown (Fig.1B, right). The insular cortex (i.e. gustatory cortex) was activated with both sucrose and quinine, although some other regions were specifically activated by sucrose or quinine. According to the hedonic value of sweet taste, sucrose stimulation induced activation in the right caudate nucleus and putamen. Quinine stimulation induced activation in the amygdala, a brain region involved in associative conditioning such as taste aversion. This might suggest an aversive effect of quinine gustatory stimulation at the concentration used.Conclusion
Overall, the activation of the visual cortex with visual stimulation allowed us to validate our fMRI and stimulation setup. Differences between bitter and sweet oral stimulation were highlighted. Gustatory stimulation combined with fMRI analysis in large animals such as minipigs might be a promising approach to investigate the integration of gustatory stimulation in healthy or pathological condition such as obesity, eating disorders or dysgeusia.Acknowledgements
We thank the PRISM imaging facility of Rennes and the pig facility (UEPR) of Saint-Gilles.References
1. Roura E, Koopmans SJ, Lallès JP, et al. Critical review evaluating the pig as a model for human nutritional physiology. Nutr Res Rev. 2016;29(1):60-90.
2. Val-Laillet D, Aarts E, Weber B et al. Neuroimaging and neuromodulation approaches to study eating behavior and prevent and treat eating disorders and obesity. Neuroimage Clin. 2015;24 (8) :1-31.
3. Gizewski ER, Schanze T, Bolle I, et al. Visualization of the visual cortex in minipigs using fMRI. Res Vet Sci. 2007;82(3):281-286.
4. Saikali S, Meurice P, Sauleau P, et al. A three-dimensional digital segmented and deformable brain atlas of the domestic pig. J Neurosci Methods. 2010;192(1):102-109.
Figures