5319
BOLD Signal Changes in Spinal Cord with Hypercapnia1Institute of Imaging Science, Vanderbilt University, Nashville, TN, United States, 2Neuroscience, Vanderbilt University, Nashville, TN, United States, 3Radiology and Radiological Sciences, Vanderbilt University Medical Center, Nashville, TN, United States, 4Radiology, Athinoula A. Martinos Center for Biomedical Imaging, Massachusetts General Hospital, Charlestown, MA, United States, 5Radiology, Harvard Medical School, Boston, MA, United States
Synopsis
A hypercapnic gas challenge was used to demonstrate blood oxygenation level dependent (BOLD) signal changes in the cervical spinal cord, and the sensitivities of two functional acquisition sequences (standard single shot (GE-EPI) and 3D multishot (3D-EPI) gradient echo EPI) were compared. Results indicated that both acquisitions were able to detect signal changes of about 1% in gray matter and higher values in white matter confirming that BOLD effects in the cord are reliable. The 3D multishot sequence exhibited higher temporal SNR and reduced susceptibility distortions, making it an attractive option for BOLD fMRI in the spinal cord.
Purpose
Several reports of reliable task-induced activity, and demonstrations of resting state connectivity within and across segments in the spinal cord, highlight the need for better characterization and validation of spinal cord blood oxygenation level dependent (BOLD) signals.1,2 A hypercapnic gas challenge induces iso-metabolic vasodilation and an increase in BOLD signal in the brain and one previous study has employed such a challenge in spinal cord.3 We sought to measure BOLD signal changes in spinal cord tissues with hypercapnia and to compare two acquisitions schemes, single-shot gradient echo EPI (GE-EPI) and 3D multi-shot gradient echo EPI (3D-EPI), for their abilities to detect and quantify BOLD signal changes.Methods
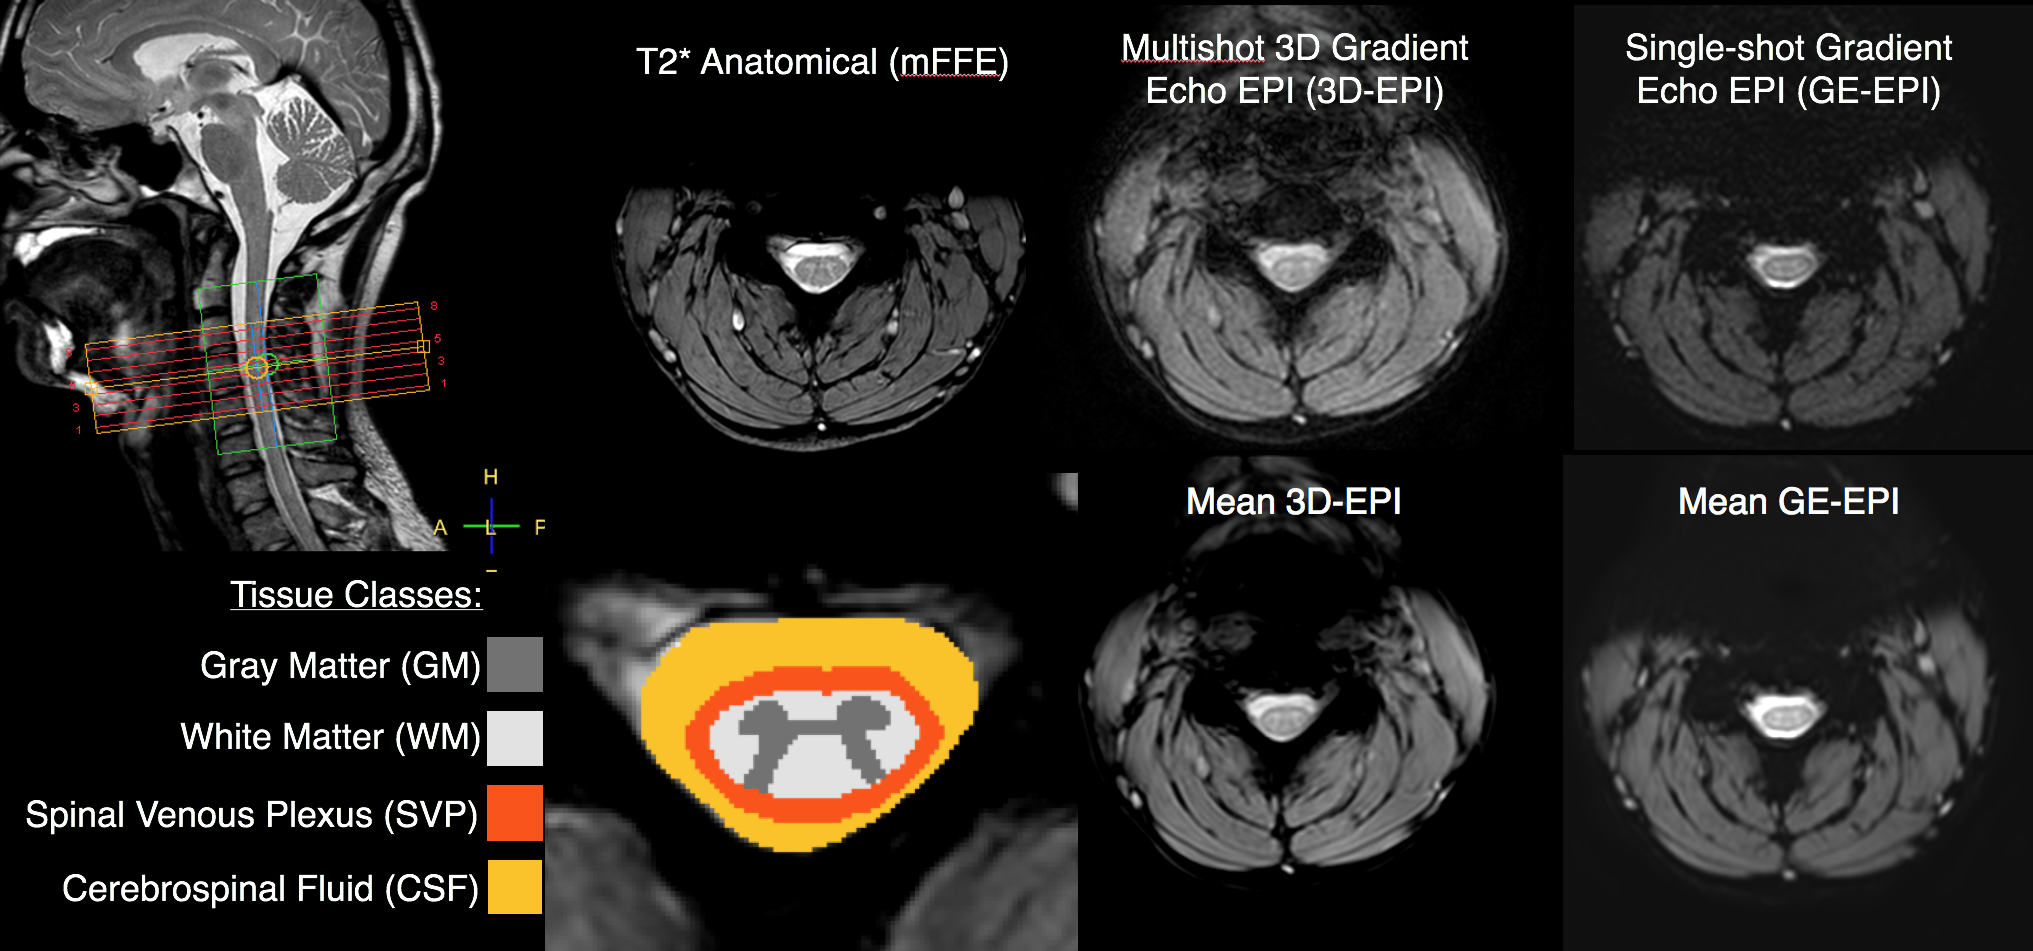
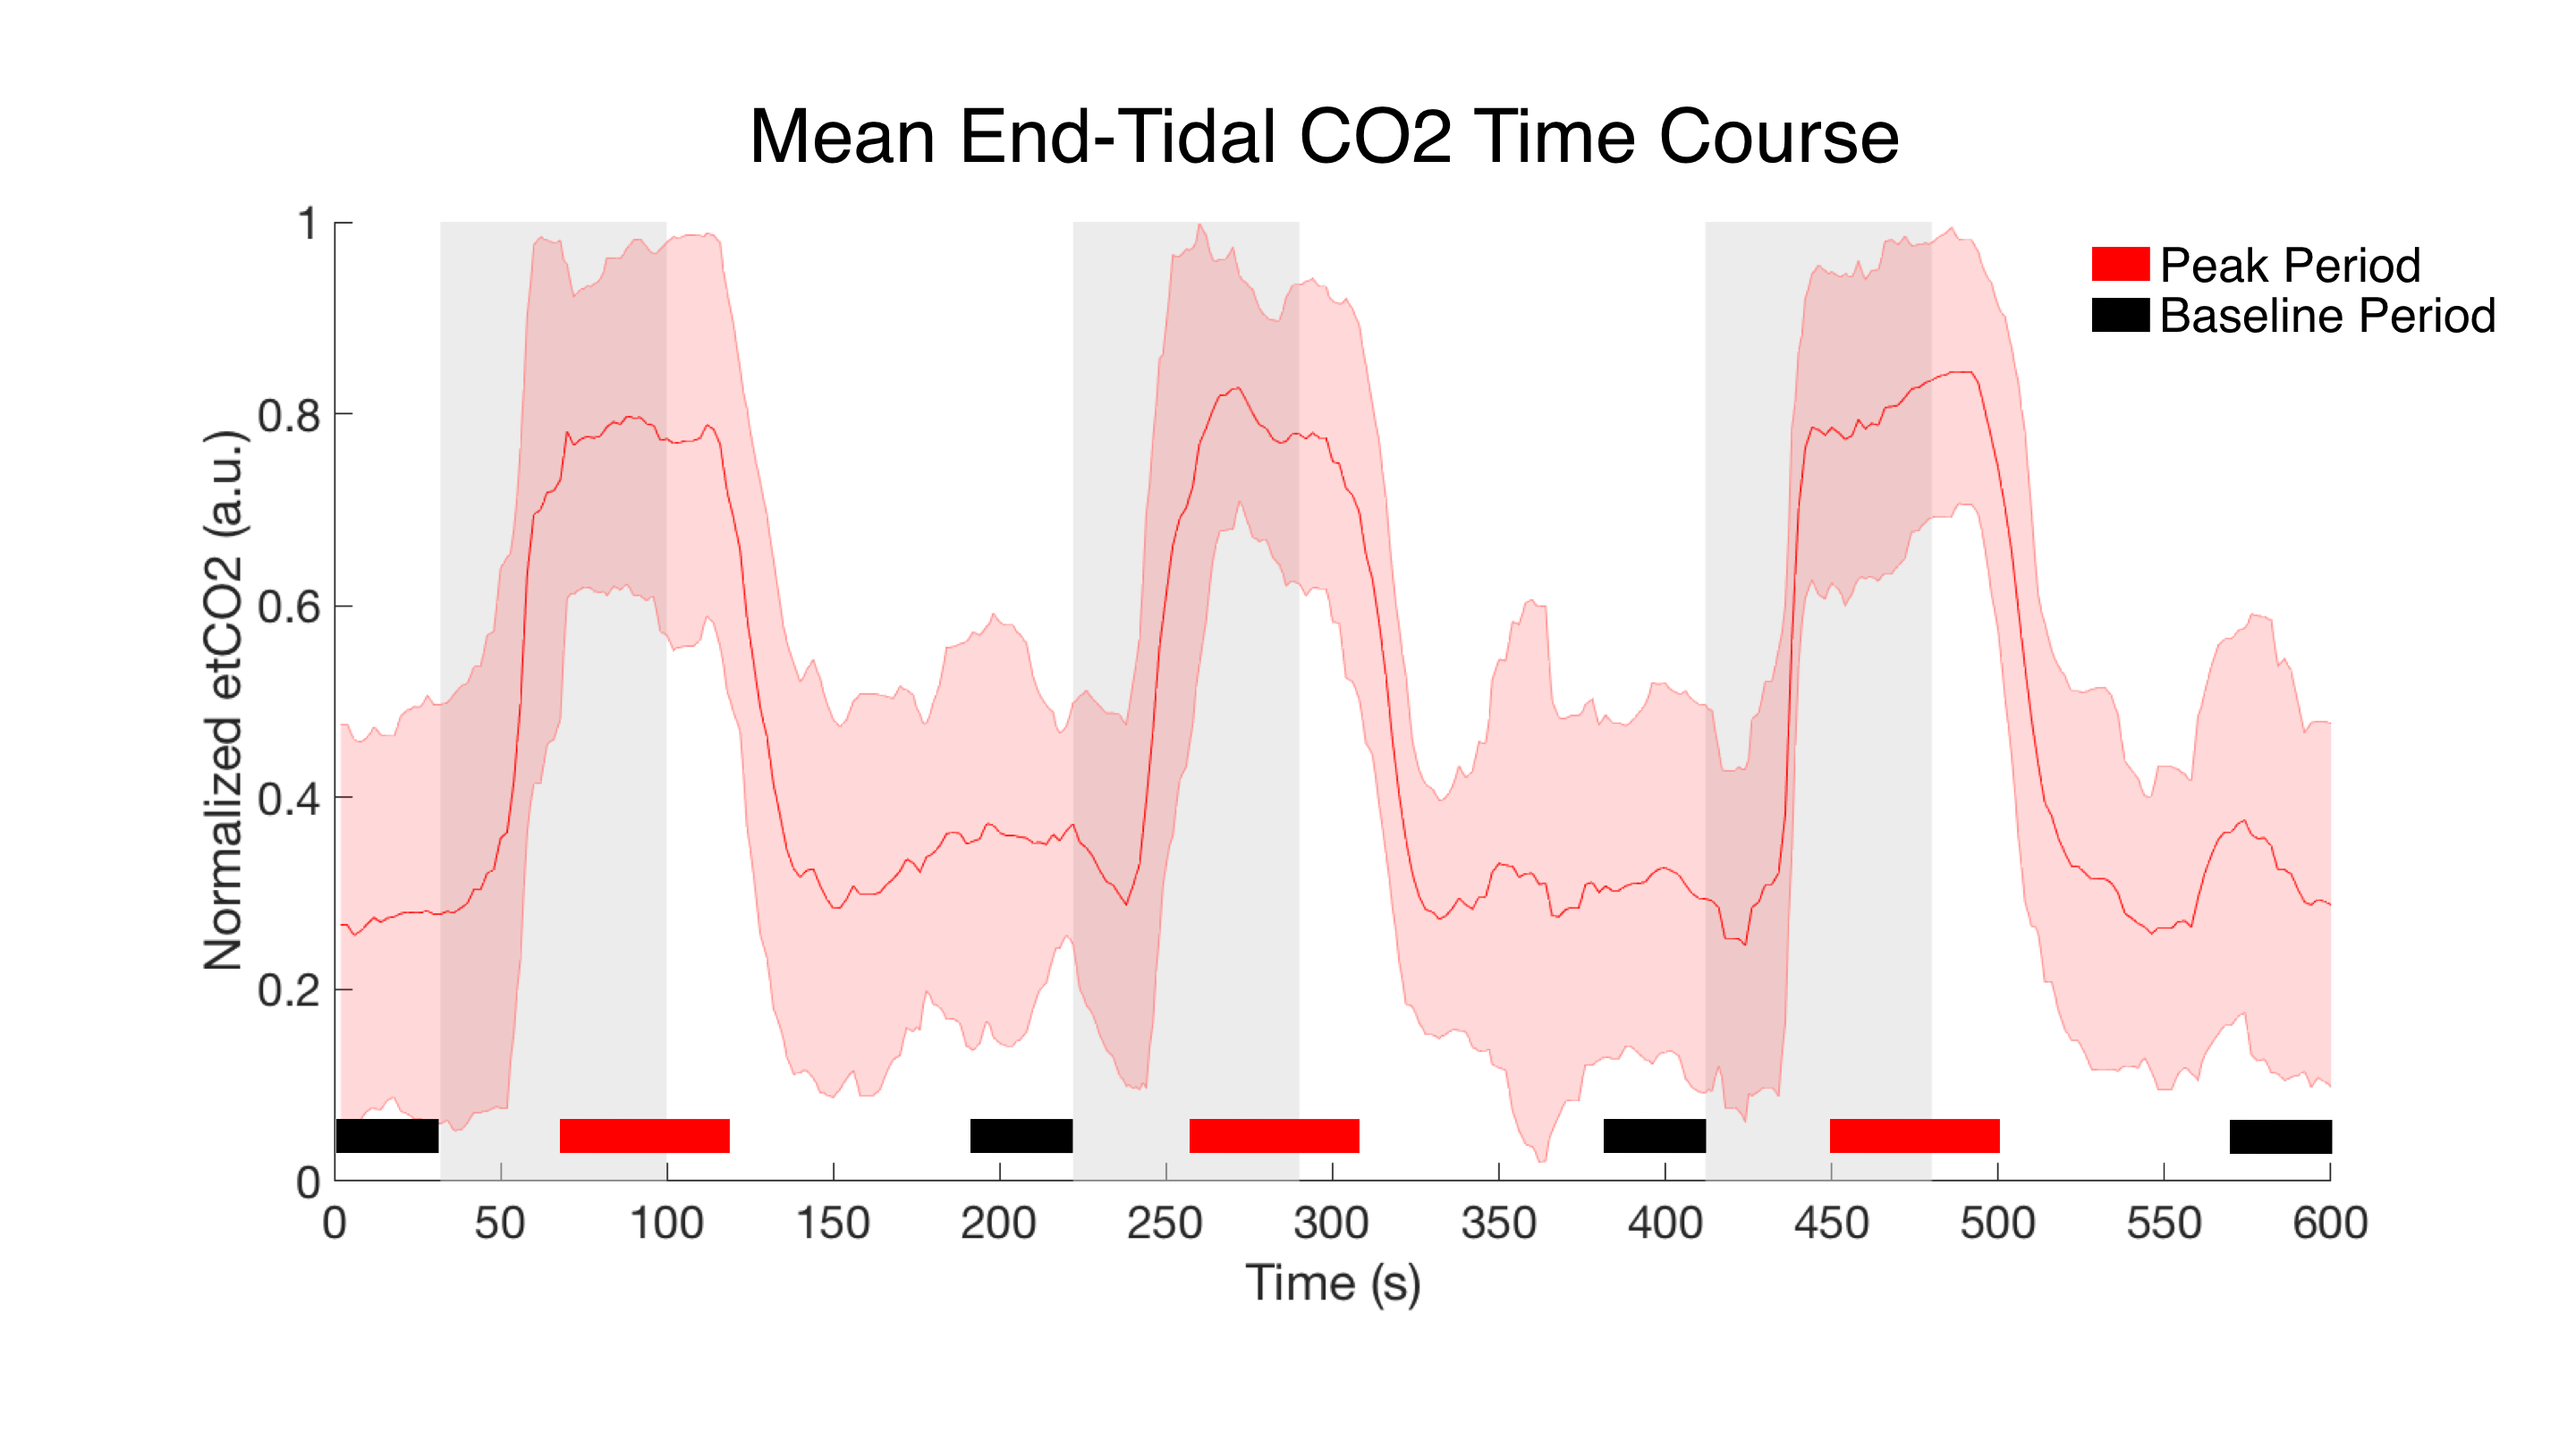
After signed, informed consent, seven subjects participated in the study (26.4 ± 4.9 years, 4 female). Scans were acquired using a Philips Achieva 3T with dual-channel transmit and 16-channel neurovascular coil for reception. After anatomical imaging, two 10-minute gas challenge fMRI runs were acquired. The acquisition parameters are described in Figure 1. Both were acquired axially at the same resolution of 1x1x5mm with 8 slices, a FOV of 150x150x40mm, and centered in the middle of C4 vertebral level. A hypercapnic normoxia gas mixture (5%CO2,21%O2,74%N2) was used and the gas presentation paradigm is described in Figure 2. Respiration, cardiac, and end tidal CO2 (etCO2) signals were recorded. Anatomical masks of gray matter (GM), white matter (WM), and cerebrospinal fluid (CSF) were manually defined. A fourth tissue mask for the spinal cord venous plexus (SVP) was created by dilating the border of cord white matter by two voxels which was intended to encompass the spinal veins running along the cord's periphery. The processing pipeline for each fMRI run involved motion correction focused on the cord/canal, RETROICOR (correction using the respiratory/cardiac traces), and coregistration/resampling to the high-resolution anatomical (T2*w mFFE) space (acquired with the same geometry). An initial step of slice timing correction was applied to the single shot EPI data. No smoothing was applied. While relatively few distortions or signal dropout were present in the 3D-EPI data, significant susceptibility artifacts and tissue distortion in the single shot EPI data were accounted for by editing the tissue masks prior to statistical analysis.Analysis
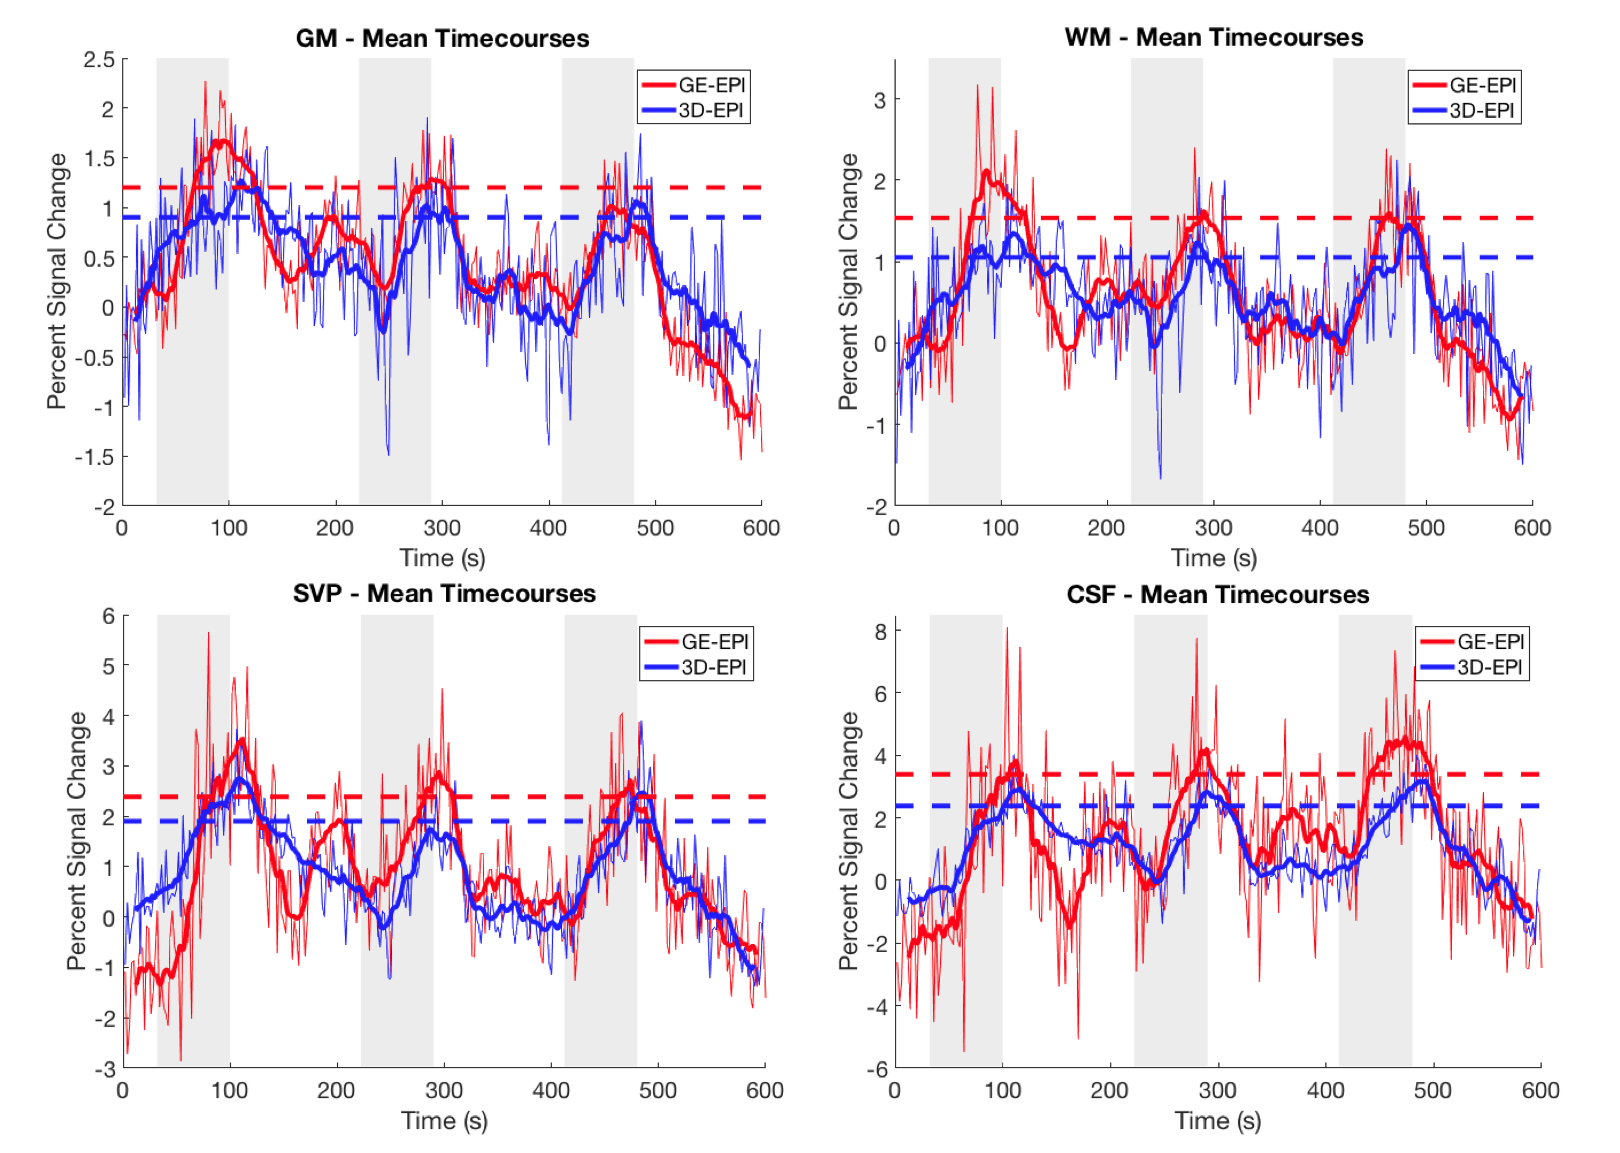
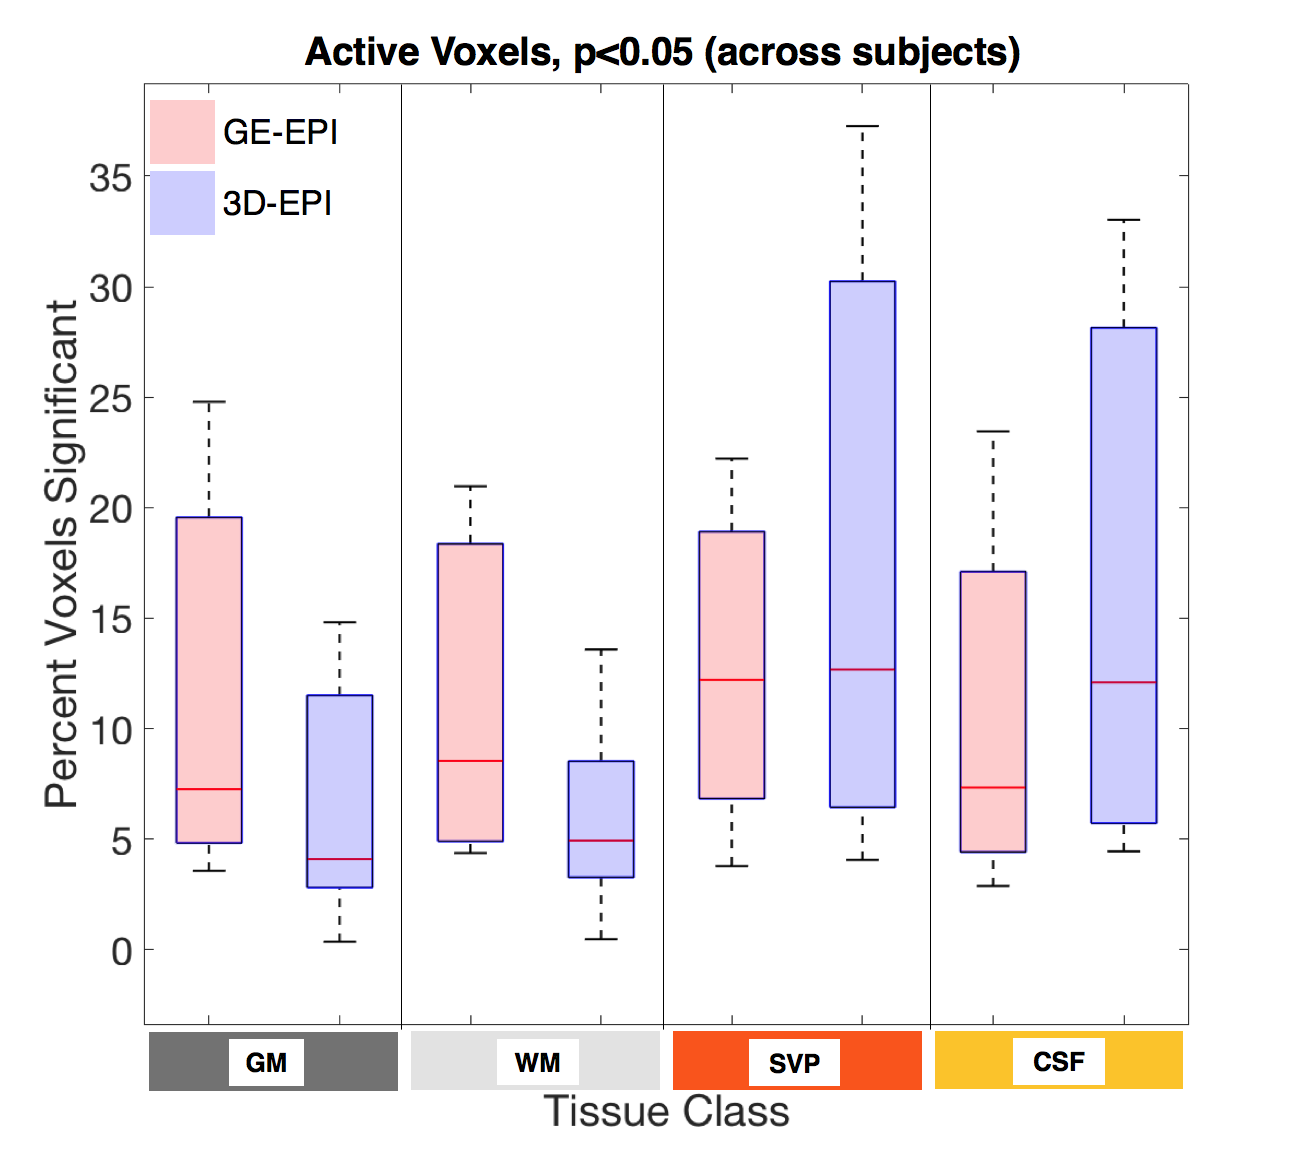
A general linear model (GLM) was applied using a gamma function convolved with the stimulus time course and delayed by 20 seconds from the onset of gas blocks, which most closely matched our measured average etCO2 time course (Fig. 2). Percent signal change time series were calculated at the voxel level by dividing the signal at each time point by the mean signal of the voxel across the four baseline periods. To compare the magnitude of signal change between the two acquisition schemes, for each subject, voxels of each tissue class were sorted according to the t-values estimated from GLM analysis and the top half of voxels for each subject were used in the group average signal time course (Fig. 3). Additionally, the numbers of voxels demonstrating a significant BOLD effect (i.e. “active” voxels) for each acquisition scheme were assessed and compared.Results
In all subjects a reliable increase in etCO2 of 4-5mmHg was observed during gas blocks. Mean tSNR in gray matter was calculated to be 18.3±2.9 for 3D-EPI and 13.6±1.9 for GE-EPI, which was significantly greater in a paired t-test across subjects (p=0.00006). Figure 3 demonstrates that both sequences detected robust BOLD signal change in the tissues of interest. The average % peak signal change in GM/WM was 1.20/1.54 for GE-EPI and 0.90/1.05 for 3D-EPI. GE-EPI demonstrated higher average peak signal change for all tissue classes. The signal change values in CSF and SVP were highly variable in GE-EPI, suggesting that this sequence is more sensitive to flow effects and CSF pulsation compared to 3D-EPI. In Figure 4, none of the paired t-tests were significant. Similar to Cohen-Adad et al.3, we found significant voxels at the edge of the cord (SVP) and outside the cord in CSF, suggesting there may be BOLD effects in these regions from vasculature along the cord and nerve rootlets.Discussion and Conclusion
Both GE-EPI and 3D-EPI are sensitive BOLD signal changes in the cervical spinal cord. While our GE-EPI provided slightly higher detection and peak signal change of BOLD response in the tissues of interest, 3D-EPI provided similar levels of detection, despite a much shorter echo time and different TR and flip angle. Interestingly, BOLD effects were larger in WM than in GM, unlike the brain. The merits of 3D-EPI, including higher tSNR and less susceptibility artifact, make it an attractive option for BOLD fMRI in the spinal cord.Acknowledgements
This research was supported by: 4T32EB014841-04 (Gore), W81XWH-13-1-0073 (Smith), NIH/NINDS R21NS087465, National MS Society, and NIH/NIBIB R00EB016689 (Barry)References
1. Cohen-Adad J & Wheeler-Kingshot C (Eds.), Quantitative MRI of the Spinal Cord, Elsevier (2014).
2. Barry RL, et al. NeuroImage 2015; 133:31-40.
3. Cohen-Adad J, et al. NeuroImage 2010; 50:1074-1084.
Figures