5313
Modulation of resting state networks after slow and periodic visual stimulation in humans1Laboratory of Biomedical Imaging and Signal Processing, The University of Hong Kong, Hong Kong, Hong Kong, 2Department of Electrical and Electronic Engineering, The University of Hong Kong, Hong Kong, Hong Kong, 3Department of Electrical and Electronic Engineering, Southern University of Science and Technology, Shenzhen, People's Republic of China
Synopsis
Periodicity is inherent in numerous external sensory stimuli. However, its effect on large-scale resting state brain networks has not been fully understood. This study investigated brain networks before and after periodic visual stimulation in low frequency (1Hz) using resting state functional MRI. Enhanced connectivity in visual, temporal, salience and ventral attention networks were detected after 1Hz visual stimulation. Furthermore, power spectrum analysis showed increase in infra-slow (<0.1Hz) rsfMRI activity. These findings suggest that slow and periodic visual stimulation initiates and/or facilitates certain neuromodulatory mechanisms such as neural oscillations, leading to increased rsfMRI connectivity.
Purpose
Non-invasive brain stimulation (i.e., transcranial magnetic and current stimulation) and invasive deep brain stimulation have been adopted by many clinicians as a promising therapeutic approach for neurological diseases such as epilepsy, cluster headaches, depression and Parkinson’s disease1.Inherent in these stimulations is the nature of periodicity. Previous human electrophysiology recording and network modeling studies2,3 indicate that periodic external stimulation can shape numerous intrinsic neural oscillatory activity. Moreover, the intrinsic low frequency oscillations play a fundamental role in organizing functional brain networks, particularly during resting state4. Together, these studies suggest that periodic stimulation might alter brain resting state functional connectivity. However, whether periodic stimulation modulates resting state networks and the specificity of the modulatory effects (if any) as measured by resting state functional MRI (rsfMRI) remain unexplored. In this study, to unveil the relationship between periodic stimulus and brain networks, rsfMRI experiments were performed to compare human resting state networks before and after low frequency periodic visual stimulation. We showed a significant increase in functional connectivity in medial visual (MVN), occipital visual (OVN), temporal (TN), salience (SN), and ventral attention network (VAN) after the presentation of a low frequency (1Hz) periodic visual stimulus.Methods
Participants: Six healthy volunteers (F/M=2/4, median age=24 yrs) without history of neurological illness took part in this study.
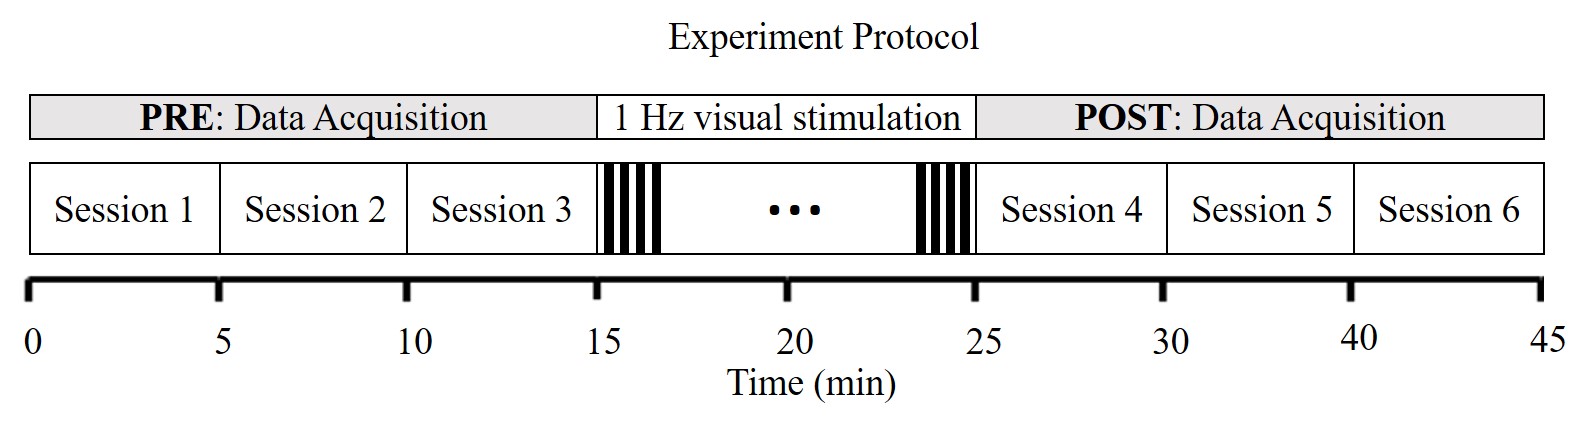
Visual stimulation protocol: In total, six 5-min rsfMRI sessions were performed on each participant. After the first three rsfMRI sessions (PRE), a 10-min low frequency periodic visual stimulus of white and black flash (1Hz; 50% duty cycle) was presented before the last three sessions (POST; Figure 1).
Data acquisition: All rsfMRI data was acquired at 3T scanner (Achieva Philips) with an 8-channel head coil using GE-EPI (TR/TE=2000/30ms, FA=90o, voxel size=2.18×2.08×4mm3, slice gap=1mm, Nslice=33, repetition=150).
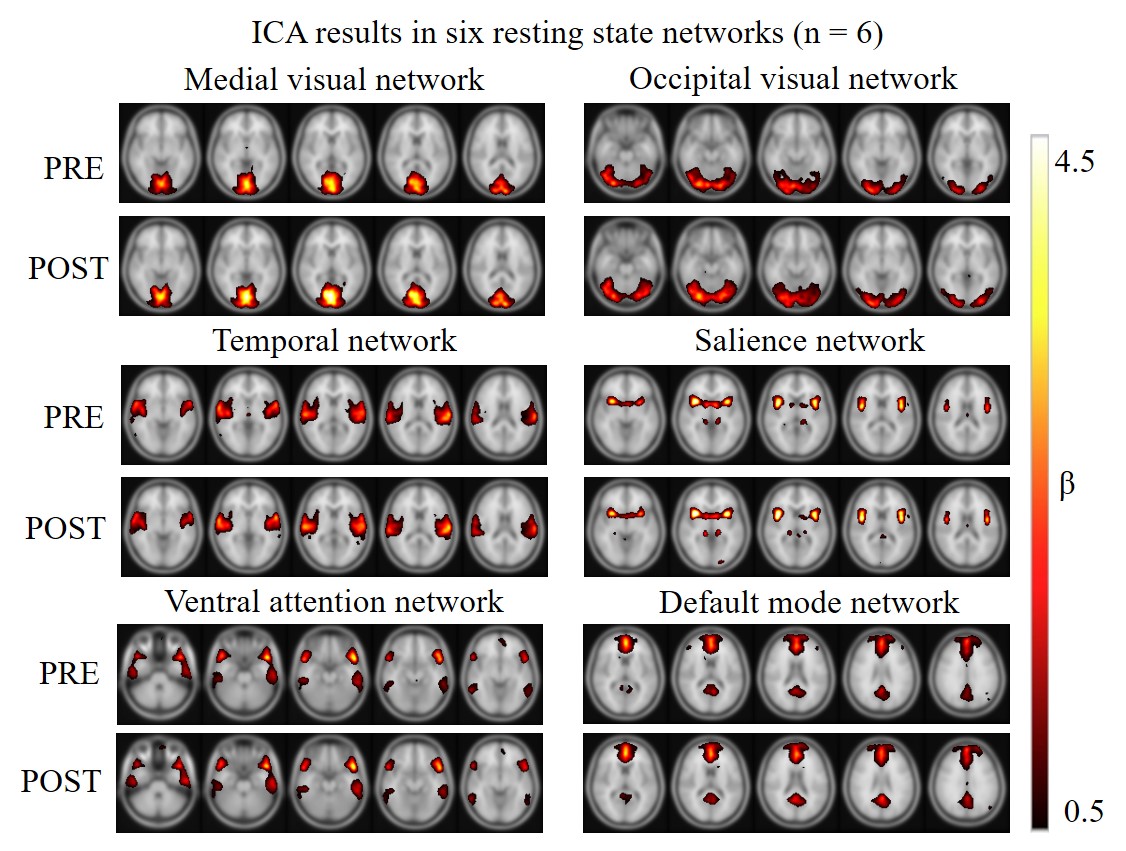
Data analysis: Standard preprocessing steps of realignment, normalization and smoothing were performed using SPM8. RsfMRI networks were then obtained using independent component analysis (ICA; 40 independent components; GIFT toolbox). Finally, the functional connectivity of rsfMRI networks were quantified as activation magnitude. Power spectrum density was then computed.
Results
Figure 2 presents averaged rsfMRI functional connectivity maps of six brain networks overlaid on T1-weighted anatomical images.
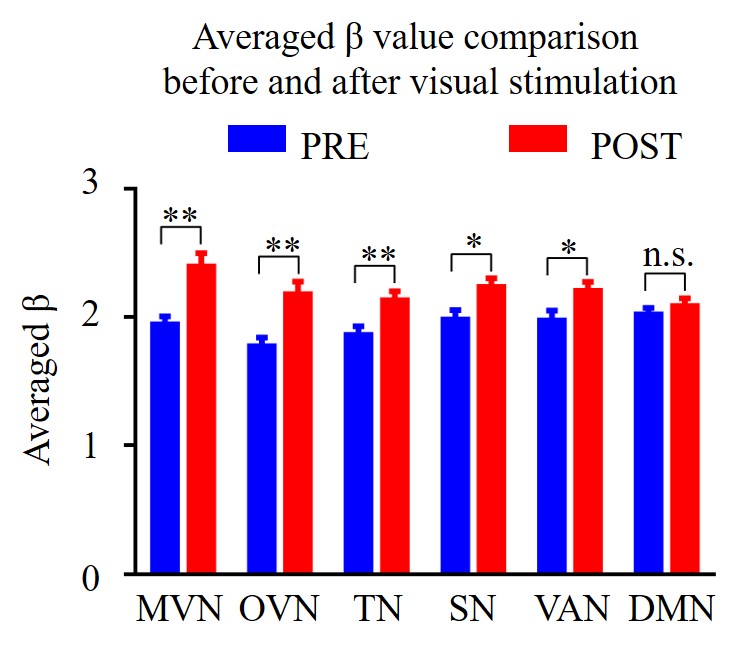
Figure 3 shows the strength of rsfMRI functional connectivity (quantified as activation magnitude) before (PRE) and after (POST) the presentation of low frequency periodic visual stimulus. Specifically, a significant increase was observed in sensory related networks (i.e., MVN, OVN and TN; p<0.01) POST. Positive modulatory effects were also observed in visual associated networks (SN and VAN; p<0.05) POST. RsfMRI connectivity strength in default mode network (DMN) did not change.
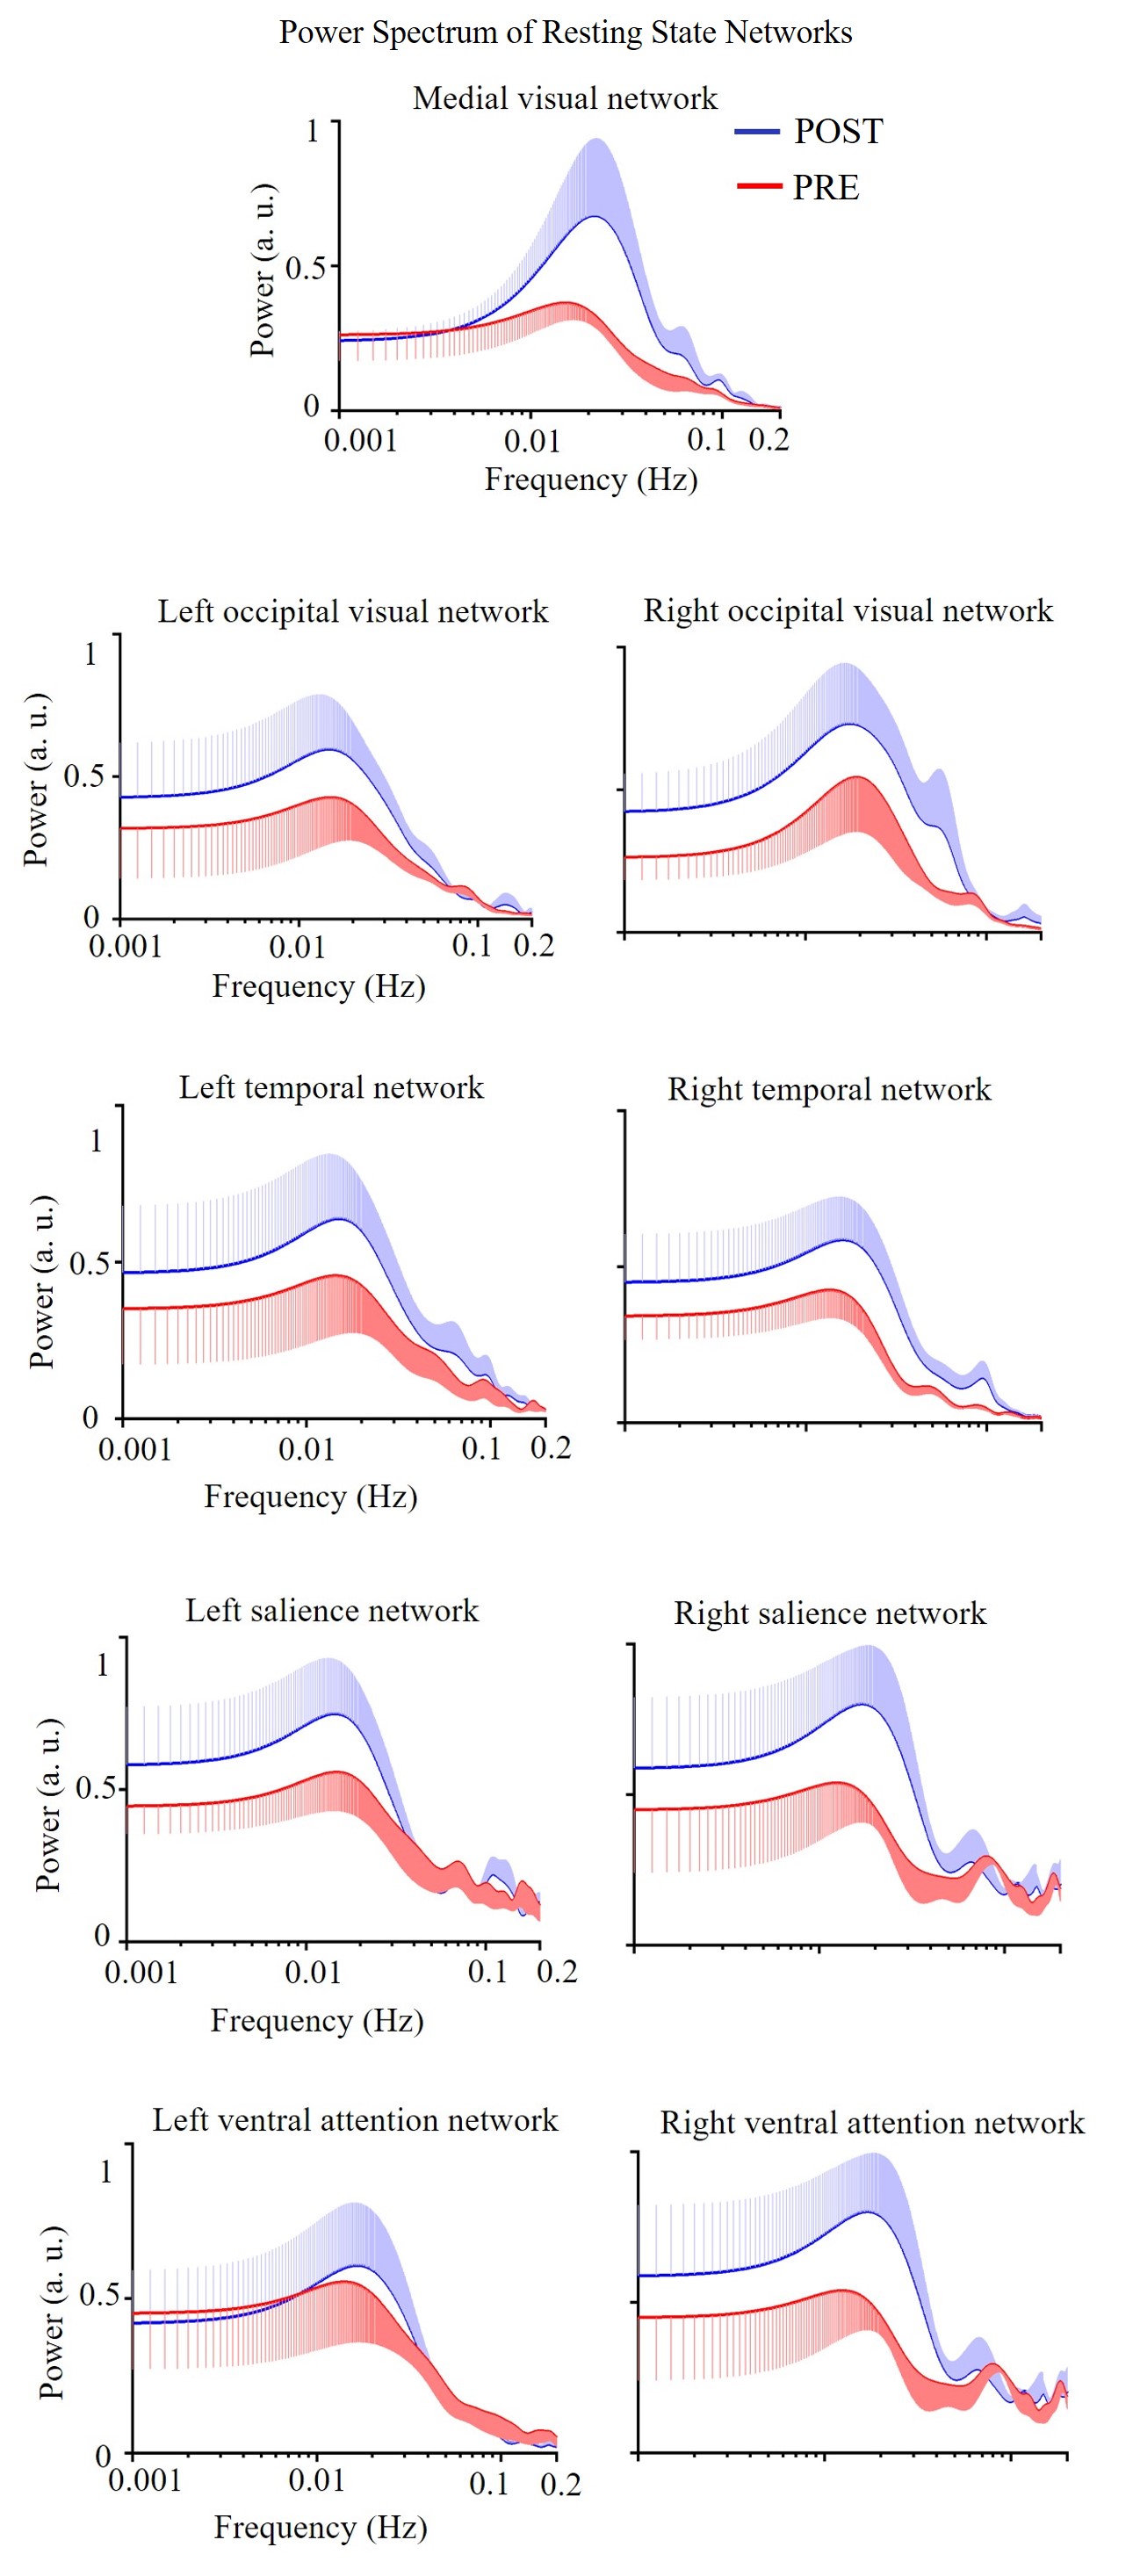
Figure 4 shows the power spectrum density of the rsfMRI networks, namely MVN, OVN, TN, SN and VAN. Infra-slow (<0.1Hz) rsfMRI activity was increased after 1Hz visual stimulation.
Discussion and Conclusion
In the present study, an enhanced rsfMRI functional connectivity in MVN and OVN was observed after low frequency periodic visual stimulation. Furthermore, other related networks including TN, SN and VAN also showed a significant increase. These findings demonstrate that a slow and periodic visual stimulus not only affects the visual networks, but also visual associated networks5. Additionally, spectral analysis of the rsfMRI networks revealed that such enhancement of functional connectivity was underlain by an increase in infra-slow (<0.1Hz) rsfMRI activity. This suggest that certain neuromodulatory mechanisms were recruited by the slow and periodic visual stimulus. A recent study demonstrated that task activation patterns are excellent predictors of rsfMRI connectivity patterns and vice versa. One of the mechanism proposed to characterize this relationship is activity flow (i.e., large-scale spreading of BOLD activity via functional pathways that are facilitated by underlying neuronal action potentials)6. Given that the enhancement were confined to only visual associated networks, it is highly likely that our observation is a direct outcome of the activity flow over rsfMRI networks, initiated by the low frequency visual stimulus. We do not preclude that such modulatory effects can be mediated by high frequency periodic visual stimulus. However, given a recent evidence showing restricted cortical activations during high frequency, not low frequency, stimulation of the thalamus7, modulatory effects will only be confined within the visual networks. We also observed a trend of increase in connectivity in the DMN albeit not significant, indicating that the underlying mechanisms could be complex and as such warrants further investigation. In summary, the current study demonstrated that human rsfMRI networks were modulated after periodic visual stimulation. Future studies will examine the dynamic properties of such neuromodulatory effects on rsfMRI connectivity and elucidate their underlying neural activity.Acknowledgements
No acknowledgement found.References
1. Mahmud, M. & Vassanelli, S. Differential Modulation of Excitatory and Inhibitory Neurons during Periodic Stimulation. Front Neurosci 10, 62 (2016).
2. Herrmann, C.S., Murray, M.M., Ionta, S., Hutt, A. & Lefebvre, J. Shaping Intrinsic Neural Oscillations with Periodic Stimulation. J Neurosci 36, 5328-5337 (2016).
3.Rouhinen, S., Panula, J., Palva, J.M. & Palva, S. Load dependence of beta and gamma oscillations predicts individual capacity of visual attention. J Neurosci 33, 19023-19033 (2013).
4. Allen, E.A., Damaraju, E., Plis, S.M., Erhardt, E.B., Eichele, T. & Calhoun, V.D. Tracking whole-brain connectivity dynamics in the resting state. Cereb Cortex 24, 663-676 (2014).
5. Fox, M.D., Corbetta, M., Snyder, A.Z., Vincent, J.L. & Raichle, M.E. Spontaneous neuronal activity distinguishes human dorsal and ventral attention systems. Proceedings of the National Academy of Sciences of the United States of America 103, 10046-10051 (2006).
6. Cole, M.W., Ito, T., Bassett, D.S. & Schultz, D.H. Activity flow over resting-state networks shapes cognitive task activations. Nat Neurosci (2016).
7. Leong, A.T.L., Chan, R.W., Gao, P.P., Chan, Y.S., Tsia, K.K., Yung, W.H. & Wu, E.X. Long-range projections coordinate distributed brain-wide neural activity with a specific spatiotemporal profile. Proceedings of the National Academy of Sciences of the United States of America (2016 (in press)).
Figures