5312
Eigenvector Centrality Mapping in Detecting Parkinson’s Disease1Cleveland Clinic Lou Ruvo Center for Brain Health, LAS VEGAS, NV, United States, 2University of Colorado Boulder, CO, United States
Synopsis
Eigenvector centrality (EC) is a parameter-free method to measure the centrality of complex brain network structures without a priori assumption. It is here applied to resting state fMRI data acquired from normal controls (NC) and Parkinson’s disease (PD) subjects for the purpose of detecting centrality abnormality in PD, a disease known to impact neural networks diffusely. The features extracted from EC were able to accurately classify subjects when used with linear discriminant analysis and support vector machine.
INTRODUCTION
Betweenness centrality, as a graph-based method identifying nodes which play central roles within network structure, has been used to show alterations in resting-state functional connectivity between brain regions in PD. Because of its computational complexity, however, betweenness centrality is usually applied to a preselected limited number of nodes; thus, it is not suitable for computing whole-brain voxel-wise centrality. Due to this limitation, the functional connectivity differences detected between groups (e.g. PD and NC) may be attenuated or even eliminated. In contrast, eigenvector centrality1 (EC) offers an assumption- and parameter-free method which is more efficient than betweenness centrality and is also feasible for whole-brain voxel-wise centrality analysis. Thus, in this study we used the EC approach to investigate centrality changes in PD utilizing the Parkinson’s Progression Marker Initiative (PPMI) database. Furthermore, with the EC-derived features as the input to linear discriminant analysis (LDA) and support vector machine with linear kernel (SVMlinear), we attempted to classify the subjects as PD or NC.METHODS
Data used in this study were obtained from the PPMI2 database. 18 age- and gender-matched PD subjects (F/M=4/14, age=65.7$$$\pm$$$8.1 ys, UPDRS-III=38.3$$$\pm$$$7.2) and 18 NCs (F/M=4/14, age=64.2$$$\pm$$$9.8 ys) with rs-fMRI were included and either baseline or earliest fMRI scans were used to improve scan uniformity for analysis. Preprocessing steps including slice-timing correction, realignment, smoothing (FWHM=8mm) were performed using SPM12, and coregistration to T1 images and normalization to standard MNI 152 template were performed using ANTS software. In EC, a voxel strongly correlated with many other nodes that themselves are central within the network has a large value. Fast eigenvector centrality mapping3 (ECM) algorithm was used to obtain EC maps for each subjects. Two-side t-test was then performed over centrality maps. The t-test map was then thresholded at p value 0.001 and cluster size 100. The mean centrality values were calculated for all clusters in each subject. LDA and SVMlinear classifiers with 6-fold cross-validation were then used to predict whether a subject was NC or PD utilizing the mean centrality values as input features.RESULTS
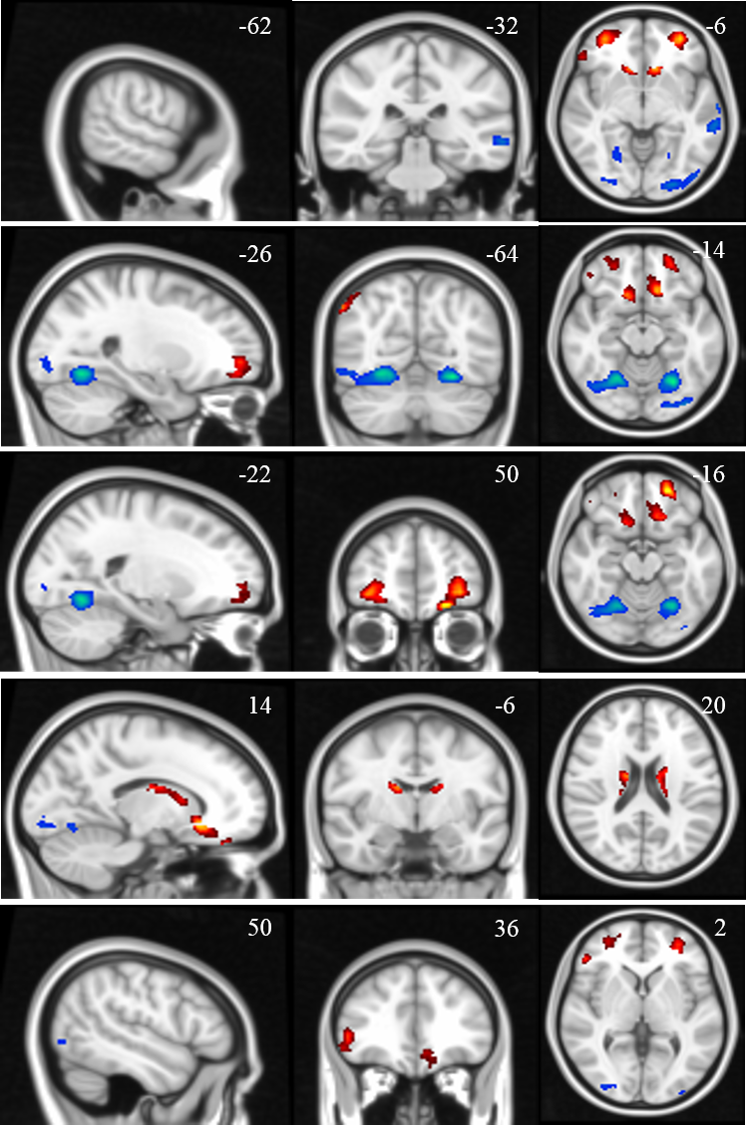
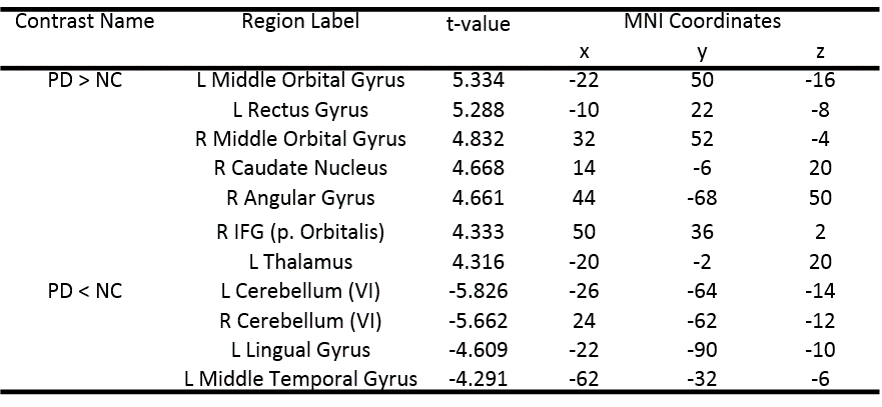
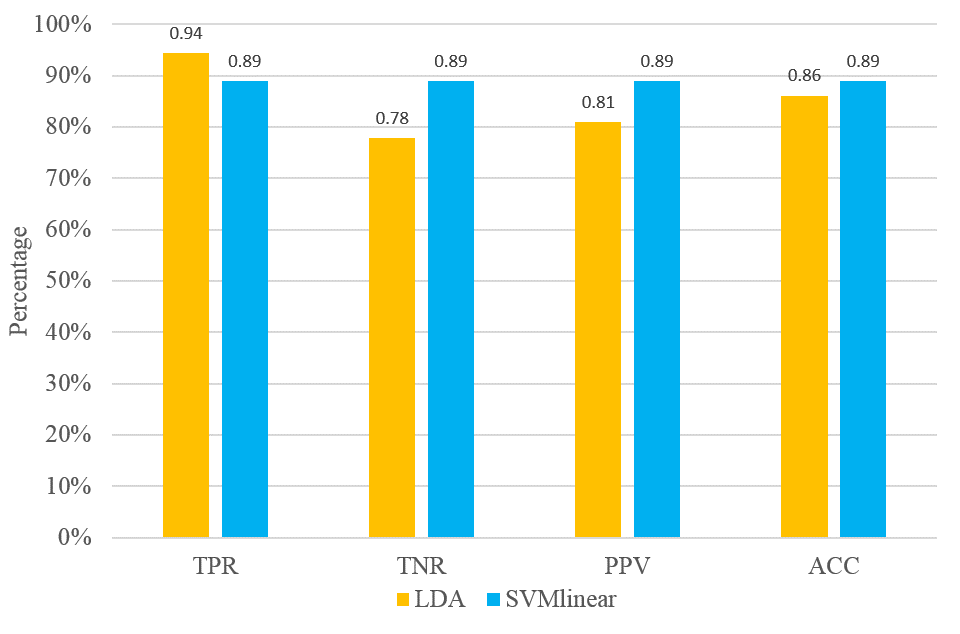
Fig.1 presents the t-value of two sample t-test contrasting PD to NC at p value 0.001 and cluster size 100, where red means PD>NC and blue means PD<NC. Table 1 shows the eleven clusters which have significant centrality alteration in PD compared to NC. In contrast to NC, PD subjects showed significantly increased EC in the left and right middle orbital gyrus (MOG), left rectus gyrus (RG), right caudate (CN), right angular gyrus (AG), right inferior frontal gyrus (IFG) and left thalamus (Th), and significantly decreased EC in the cerebellum (Cb), left lingual gyrus (LG) and left middle temporal gyrus (MTG). The average EC values in these eleven clusters were extracted as the input features for classification, which demonstrated high performance in classifying subjects as NC or PD as shown in Fig.2.DISCUSSION
As a method without a priori assumption or node limitation, EC was able to detect centrality abnormalities in both cortical and subcortical areas known to be important in PD (e.g. thalamus, caudate, cerebellum and multiple cortices). These phenomena add support to EC’s superior ability to determine centrality alteration in disease. Furthermore, using the regions of centrality identified by this method, classification of subjects as PD or NC was highly accurate, indeed approaching if not surpassing clinical accuracy of diagnosis.CONCLUSION
We have investigated the performance of EC in detecting the abnormality of centrality in PD patients. It has successfully detected the centrality alteration in the regions such as thalamus, caudate and cerebellum, which are the regions known to be important in PD. Furthermore, classification based on these features is highly accurate and approaches if not surpasses clinical diagnostic accuracy. Our study shows EC is a promising approach to study the network structure of human brain with rs-fMRI.Acknowledgements
The study was supported in parts supported by the NIH (grant number 1R01EB014284 and COBRE grant 1P20GM109025).References
[1]. Lohmann, G. (2010), ‘Eigenvector Centrality Mapping for Analyzing Connectivity Patterns in fMRI Data of the Human Brain’, PLos ONE 5(4):e10232.
[2]. Marek, K. (2011), ‘The Parkinson progression marker initiative (PPMI)’, Progress of Neurobiology, 95, pp. 629-635.
[3]. Wink, A.M., (2012), ‘Fast eigenvector centrality mapping of voxel-wise connectivity in functional magnetic resonance imaging: implementation, validation, and interpretation’, Brain Connect, 2(5):265-74.
Figures