5311
Cerebral oxygen extraction fraction measurement using an asymmetric spin echo EPI approach1MR Research China, GE Healthcare, Shanghai, People's Republic of China, 2GE Healthcare, Milwaukee, WI, United States
Synopsis
Quantitative measurement of oxygen delivery and consumption in the brain can provide insight into neurovascular and metabolic coupling. A single shot asymmetric spin echo (ASE) EPI sequence was implemented for quantitative oxygen extraction fraction (OEF) measurement in healthy volunteers for the feasibility study. OEF results were in good agreement with the normal range of 30%-40% reported in the previous literature. ASE EPI shows the potential to provide quantitative OEF maps with good brain coverage and without the need of gas challenges. Further investigation is required to evaluate the sensitivity of OEF measurement in the disease situation, such as stroke.
Purpose
Quantitative measurement of oxygen delivery and consumption in the brain can provide insight into neurovascular and metabolic coupling in the healthy and disease situations. The oxygen consumption by brain tissue can be measured with oxygen extraction fraction (OEF), also a potential indicator of the occurrence of stroke.1 Positron emission tomography (PET) is regarded as the golden standard for OEF quantification, which involves the radiation induced side effect. Some other methods require hypercapnic and hypoxic gas challenges, which are not very practical in a clinical setting.2 Recently, a single shot asymmetric spin echo (ASE) EPI approach was reported by H. An and W. Lin for quantitative OEF measurement.3 The transverse MR signal decay in the presence of a blood vessel network was modeled to explore the sensitivity of the reversible transverse relaxation rate to the OEF, as proposed by Haccke and Yablonskiy.4 In this study, we developed an ASE EPI sequence for measuring the OEF in the brain and performed the feasibility study on healthy volunteers.Methods
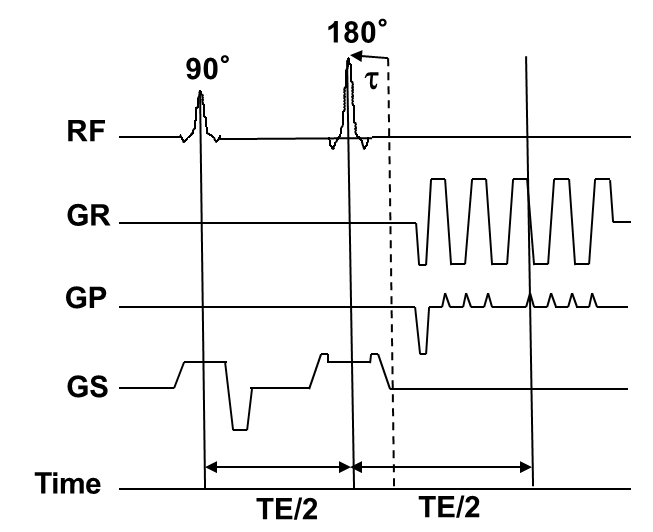
Five healthy volunteers (age 20-43 years old, one female) gave written informed consent to participate the study. All MRI scans were performed on a 3.0-T MR750 scanner (GE Healthcare, Milwaukee, USA) using an 8-channel phase array head coil. The ASE EPI sequence was a variation of a single-shot spin echo EPI sequence. The 180° refocusing pulse was shifted relative to the original position (time shift τ) while the time of echo (TE) was kept constant (Fig. 1). The ASE EPI sequence used a fixed TE to achieve the same R2 weighting but various time shift τ to introduce different R2’ and R2* weighting on the acquired images. Scan parameters were as follows: TR/TE=2000/80ms, FOV=240mm, slice thickness/gap=5/1mm, acquisition matrix=64×64, number of excitations (NEX) = 3. The ASE EPI sequence was repeated 19 times to acquire 19 asymmetric spin echoes with time shift τ corresponding to -18, -16, …, 2, 0, 2, …, 16, 18ms. The total acquisition time was 4min to acquire 28 slices. The ASE EPI images were used to estimate two parameters (reciprocal of reversible transverse relaxation rate R2’ and deoxygenated blood volume λ) by fitting them to the model proposed by Haacke and Yablonskiy.4 Then δω map could be calculated using: 𝛿𝜔=𝑅2′/λ (Eq.1). After that, OEF value was estimated using the following equation: 𝑂𝐸𝐹=𝛿𝜔/(𝛾∙4/3𝜋∙∆χ∙𝐻𝑐𝑡∙𝐵0) (Eq.2), where γ was the gyromagnetic ratio, Δχ represented the susceptibility difference between fully deoxygenated blood and fully oxygenated blood with the value of 0.18ppm. Hct was the hematocrit value, which was assumed to be 0.42.Results
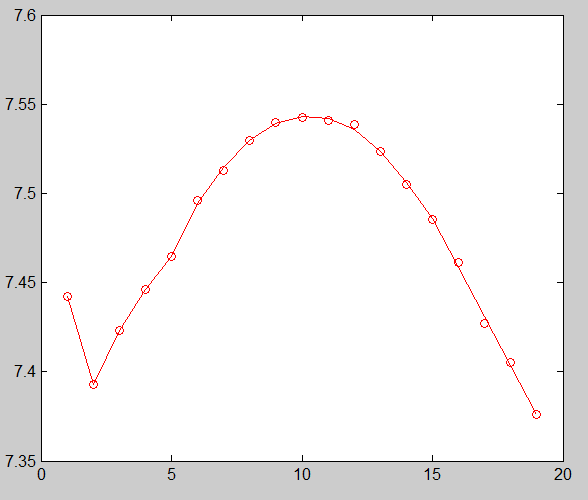
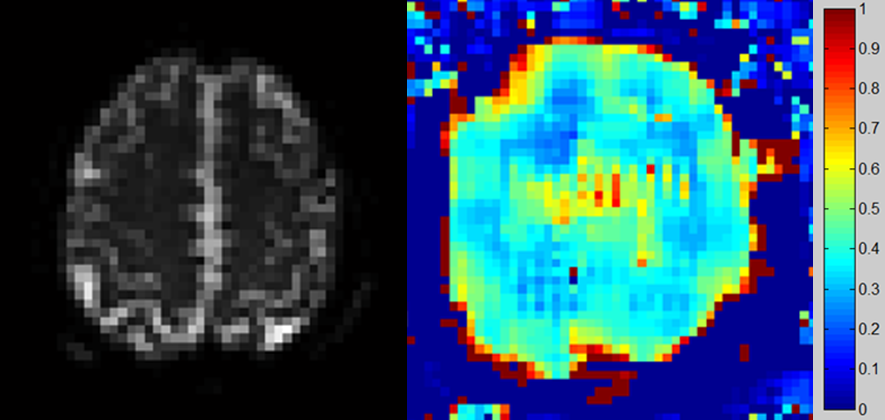
Fig.2 shows the MR signal on the ASE EPI images sampled at multiple refocusing pulse offsets. The MR signal first increased when the 180° refocusing pulse approached to the middle position between the excitation and readout pulses and then decreased when the refocusing pulse passed the symmetric position. Fig. 3 shows the representative ASE EPI image (left) and the corresponding OEF map (right) of one volunteer. Results were in good agreement with the normal range of 30%-40% reported in the literature.3Discussion and Conclusion
ASE EPI has the potential to provide quantitative OEF maps with good brain coverage and without the need of gas challenges. These results hold promise for some clinical uses, such as stroke, showing increased OEF in the cortex areas with decreased blood supply. Further investigation is required to assess the sensitivity of OEF measurement in the disease situation.Acknowledgements
No acknowledgement found.References
1. Derdeyn CP, Yundt KD, Videen TO, et al. Increased oxygen extraction fraction is associated with prior ischemic events in patients with carotid occlusion. Stroke. 1998; 29:754-758.
2. Ni WW, Christen T, Zaharchuk G. Assessing reproducibility and changes in oxygenation with R2’ during clinical hypercapnic and hypoxic gas challenges. Proc Intl Soc Mag Reson Med. 2015;1450.
3. An H, Lin W. Impact of intravascular signal on quantitative measures of cerebral oxygen extraction and blood volume under normo- and hypercapnic conditions using an asymmetric spin echo approach. Magn Reson Med. 2003;50:708–716.
4. Yablonskiy DA, Haacke EM. Theory of NMR signal behavior in magnetically inhomogeneous tissues: the static dephasing regime. Magn Reson Med. 1994;32:749–763.
Figures