5309
Comparison of BH CVR and resting state fMRI to “gold standard” task-based fMRI for assessment of brain tumor-induced neurovascular uncoupling1Russell H. Morgan Department of Radiology and Radiological Science, Johns Hopkins University School of Medicine, Baltimore, MD, United States, 2Dept. of Biomedical Engineering, Johns Hopkins University School of Medicine, Baltimore, MD, United States
Synopsis
Neurovascular Uncoupling (NVU) can critically limit presurgical mapping using blood oxygen level dependent functional magnetic resonance imaging (BOLD fMRI). False-negative activations caused by NVU can lead to erroneous interpretation of clinical fMRI examinations. Brain tumor-related NVU has been previously demonstrated on task-based BOLD fMRI (tbfMRI) and resting state BOLD fMRI (rsfMRI). The purpose of this study is to demonstrate that NVU in the sensorimotor network can be similarly detected on rsfMRI and BH CVR maps as evident in the criterion standard tbfMRI.
Purpose
False negative BOLD fMRI activation in the eloquent cortex surrounded by brain tumors or other focal brain lesions can lead to inaccurate pre-surgical planning which can result in inadvertent eloquent cortical resection.1 These false negative BOLD responses in the vicinity of focal brain lesions often occur due to the disruption of coupling between neuronal activity and adjacent microvascular responses. This phenomenon of neurovascular uncoupling (NVU) is a critical limitation of clinical fMRI. Brain tumor-related NVU has been previously demonstrated in task-based BOLD fMRI (tbfMRI)2 and in resting state BOLD fMRI (rsfMRI)3. The purpose of this study is to demonstrate that the NVU in sensorimotor network of patients with low-grade perirolandic tumors can be similarly detected on rsfMRI and breath hold cerebrovascular reactivity (BH CVR) maps as evident in tbfMRI.Methods
Among 114 patients undergoing clinical presurgical fMRI mapping along with rsfMRI from 2012 to 2016, a total of twelve such patients displayed perirolandic tumors with evidence of NVU involving the motor network. This was manifested as abnormally decreased or absent tbfMRI activation and corresponding decreased BH CVR in the primary sensorimotor cortex of the ipsilesional hemisphere without corresponding motor deficits or inadequate task performance.2 Imaging was performed on a 3.0 T Siemens Trio MRI with a 12-channel head matrix coil. Imaging protocol included a 3D T1 MPRAGE (TR=2300 ms, TI= 900 ms, TE= 3.5 ms, 9° FA, 24-cm FOV, 256x 256x176 matrix, slice thickness 1 mm) for structural imaging and multiple 2D GE-EPI T2* weighted BOLD sequences for task, BH & resting functional imaging (TR=2000 ms, TE=30 ms, 90° FA, 24-cm FOV, 64x64x33 matrix, 4 mm slice thickness with 1 mm gap between slices, interleaved acquisition). 180 volumes were acquired in a 6 minute rsfMRI scan and 130 volumes were acquired in a 4 minute 20 sec BH scan. The motor tasks used were a vertical tongue movement task and a bilateral simultaneous sequential finger tapping task (each 3 minutes long with 30 seconds blocks of rest alternating with 30 seconds blocks of motion). The details of the BH task are described in a previous publication.2 Instructions for all tasks were visually cued. SPM software was used for preprocessing of BH, tbfMRI & rsfMRI data (slice timing correction, realignment, normalization to MNI space at 2mm voxel resolution, and spatially smoothing using a 6 mm FWHM Gaussian kernel). Z-score maps for the motor and BH tasks were obtained using general linear model (GLM) analysis using SPM software (reflecting motor activation vs. rest and hypercapnia vs. baseline, respectively). De-trending for removal of systematic linear trend and low frequency (0.01-0.08 Hz) bandpass filtering was performed on the pre-processed rsfMRI data using the REST (version 1.8)4 toolkit. An Automated Anatomical Labeling (AAL) template5,6 was used to obtain a seed region circumscribing the combination of pre- and post- central gyri (CG) in each contralesional (CL) hemisphere. Pearson linear correlation was calculated using REST toolkit between the seed region in CL to ipsilesional (IL) pre- and post- CG to obtain the functional connectivity map (Seed Correlation Analysis (SCA) Map) of the sensorimotor network in each patient.3 BOLD signal changes on un-thresholded Z score maps derived from all three maps BH CVR, tbfMRI, and SCA rsfMRI were evaluated in pre- and post- central gyri for evidence of NVU. A subsequent two-tailed t-test was performed on the mean Z-scores to determine whether statistically significant differences between the two sides that were consistent with NVU were present.Results
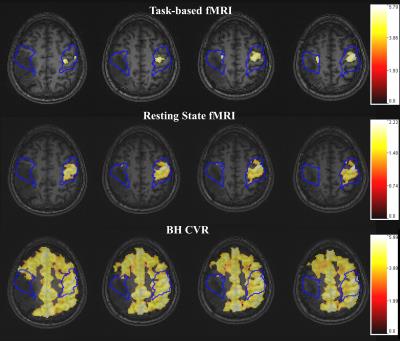
Group analysis revealed significantly decreased motor activation (p=0.0005) in ispilesional (IL) compared to contralesional (CL) perirolandic ROIs in these patients with motor cortical NVU. Significant IL BOLD signal decreases compared to CL ROIs were found on BH CVR maps (p=0.03) and SCA maps (p=0.0004), suggesting that these findings also reflect the presence of NVU. Single subject data for one patient are provided in Figure 1.Discussion
Our study demonstrates that there is significantly decreased ipsilesional BOLD signal within the sensorimotor network on both resting state fMRI and BH CVR maps in this group of perirolandic primary glioma patients. Since none of these patients displayed clinical motor deficits suggestive of tumor-related destruction of the primary motor cortex, such ipsilesional BOLD signal decreases are indicative of NVU, similar to previously established findings with tbfMRI.Conclusion
Our study suggests that neurovascular uncoupling within the sensorimotor network can be similarly detected on rsfMRI using seed-based correlation analysis for functional connectivity assessment as well as on BH CVR maps. These findings are analogous to findings on task-based fMRI in the setting of NVU.Acknowledgements
This work is partially supported by NIH grant R42 CA173976-02 (NCI).References
1. Attwell D, et al. Nature 2010;468:232-243
2. Zacà D, et al. J Magn Reson Imaging 2014;40(2):383-90
3. Agarwal S et al. J Magn Reson Imaging 2016 Mar; 43(3):620-6
4. Song X-W, et al. PLoS ONE 2011;6(9):e25031
5. Tzourio-Mazoyer N et al. Hum Brain Mapp 2002;17:143–55
6. Smith SM. Hum Brain Mapp 2002;17:143–55
Figures
