5307
Quantification of Neural Energetic Changes during Visuomotor Learning using Arterial Spin Labelling FMRI1School of Psychology, Cardiff University Brain Research Imaging Centre, Cardiff, United Kingdom, 2School of Medicine, Neuroscience and Mental Health Research Institute, Cardiff, United Kingdom, 3School of Medicine, Institute of Psychological Medicine and Clinical Neurosciences, Cardiff, United Kingdom
Synopsis
Recovery of motor function following neurological damage is dependent on functional neuroplasticity. Mechanisms of adaptive plasticity are not well understood, thus limiting the ability to predict recovery following rehabilitation. This study examined the suitability of calibrated fMRI to study cerebrovascular changes during motor learning, as cerebrovascular function plays an important role in neuroplasticity. Results showed cerebral blood flow, BOLD and oxygen metabolism increases from rest with task but decreases with task-learning. However, high inter-subject response variability was observed. Calibrated fMRI shows promise for studying cerebrovascular changes during learning but the repeatability and stability of measurements requires further investigation.
Purpose
Functional recovery following stroke or neuroinflammatory related damage is dependent on adaptive plasticity. Neuroplasticity has been studied using BOLD fMRI1 but, due to ambiguity of interpretation of BOLD signals, understanding the mechanisms of functional changes has been limited. Here, we used calibrated fMRI2 to obtain additional direct quantification of cerebral blood flow (CBF) and the cerebral metabolic rate of oxygen consumption (CMRO2) during motor learning. The objective of the study was to evaluate the suitability of calibrated fMRI to measure group-level BOLD, CBF and CMRO2 responses to a short visuomotor sequence learning task, and subsequent changes in these parameters over the task duration with sequence learning.Methods
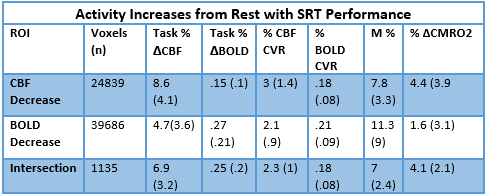
Simultaneous BOLD and CBF data were acquired for 20 subjects at 3T using a PICORE QUIPSS II3 dual-echo4 ASL sequence (14 slices, 64 spiral, TE1= 2.7ms, TE2= 29ms, TR= 2.4s, TI1= 700ms, TI2= 1.5s, FOV= 19.8cm, flip angle= 20°, resolution 3.1x3.1x8.44mm) during an adapted serial reaction time (SRT) task5. This was followed by a reference hypercapnia scan where PETCO2 levels were raised (target +7 mmHg PETCO2) for 2 minute intervals separated by 2 minutes of baseline. CBF timeseries were calculated for the SRT and hypercapnia tasks from the first echo and BOLD from the second echo. ROIs were determined from the group level BOLD and CBF task responses and mean signal changes over time, modelled using FSL FEAT6. CBF was quantified using a single compartment model7 for these ROIs and percentage BOLD change calculated as a % change from the mean. BOLD and CBF CVR to CO2 was calculated for each task ROI using methods described previously8 and CMRO2 for each ROI was obtained using the Davis model2 (Figure 1) with α= 0.2 and β= 1.39. BOLD, CBF, CVR, M and relative CMRO2 changes were calculated for 6 ROIs; total CBF, BOLD and CBF-BOLD intersecting task-related increases and task-related activity decreases over time.Results
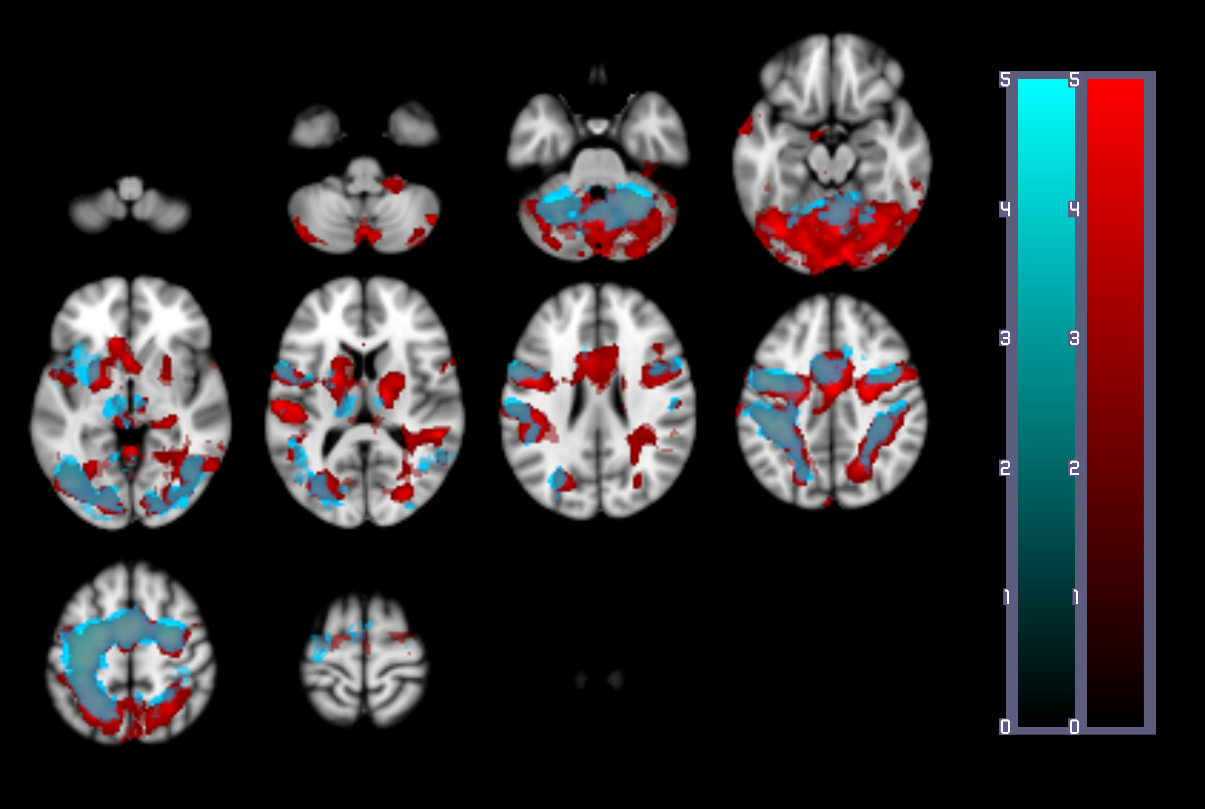
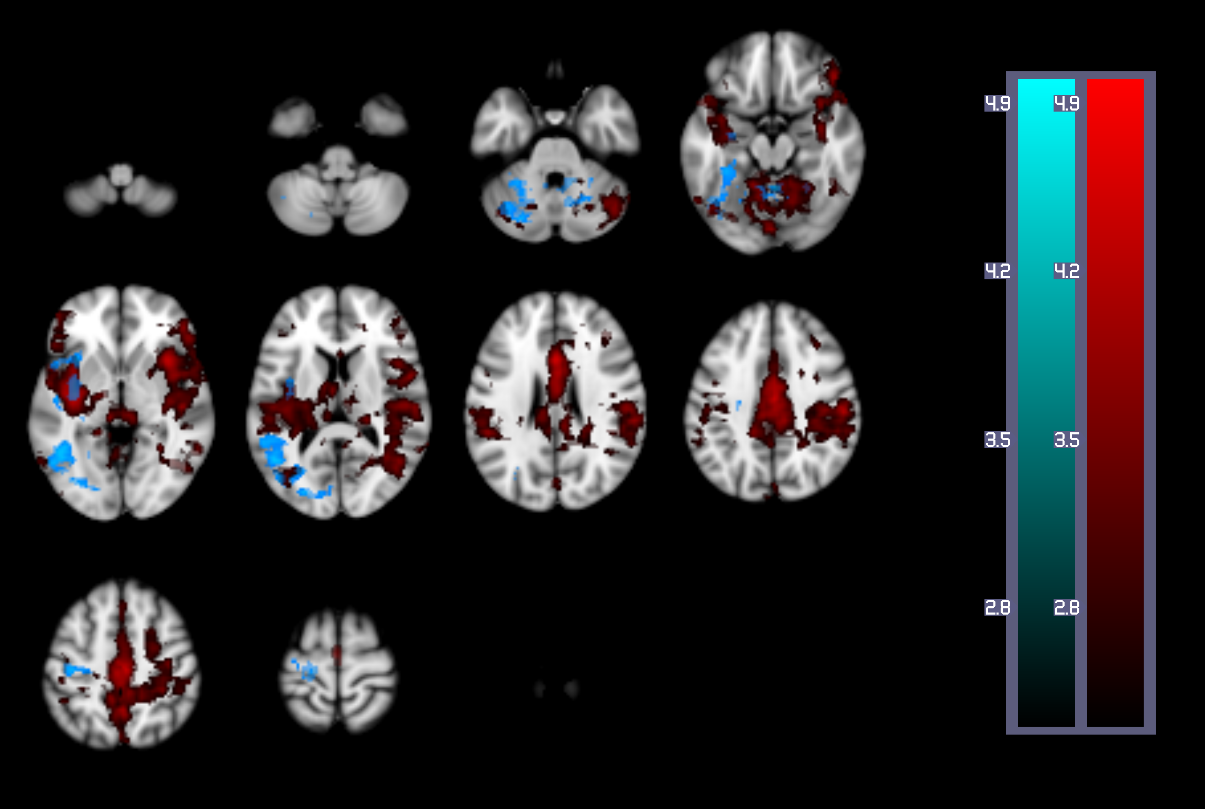
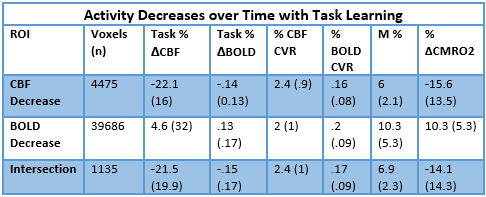
A one-way repeated measures ANOVA showed a significant effect of time on performance; response accuracy improved over time; F(2.2, 38.3) = 12.47, p < 0.001. BOLD and CBF task-related activity increases were observed in regions of the motor and supplementary motor cortices, cerebellum, insula, lateral occipital cortex (LOC) and thalamus; areas previously associated with visuomotor learning. There were no areas where BOLD increased and CBF decreased or vice versa. Paired t-tests showed that the CMRO2 change from baseline was significant across the group for the CBF ROI; t= 6.04, df = 18, p < 0.001, BOLD ROI before corrections; t= 2.3, df = 18, p = 0.034, p’ = 0.1, and the BOLD-CBF intersection ROI, t= 4.39, df = 17, p = 0.001, p’ = 0.003, Bonferroni corrected. Clusters of mean BOLD and CBF signal reductions over task blocks were observed in the cerebellum, insula, inferior temporal gyrus (ITG), temporal fusiform cortex (TFC), and the precentral and postcentral gyri representing decreasing energy demand with task progression. Paired T-tests on the relative CMRO2 changes showed significant CMRO2 decreases for the CBF ROI; t= 4.88, df = 17, p < .001, and the BOLD-CBF intersection ROI; t= 4.05, df= 16, p = 0.001 but not the BOLD ROI; t= 1.5, df = 17, p = .148. High inter-subject variability may explain this result. Variability was highest in the BOLD ROI resulting in a mean positive signal despite a significant decreasing signal trend.
Conclusions
Using calibrated fMRI, we have shown cortical and subcortical increases in BOLD, CBF and relative CMRO2 during performance of a sequence learning task. Secondly, in many of the regions recruited during the task, we have shown statistically significant decreases in BOLD, CBF and oxygen metabolism over time by modelling the signal trend over all task blocks. These decreases could be attributed to increased neural efficiency with task learning, resulting in lower energy demands despite higher response accuracy. High inter-subject variability was observed, especially in the BOLD ROI, and this may be partially due to noise inherent in ASL data. One limitation of the Davis model is that any noise present affects M causing error propagation through the CMRO2 calculation. However, results could also reflect individual differences in functional changes with learning, despite similar performance improvements across the group. The results demonstrate the feasibility of measuring neural energetics during motor learning when considering simple task vs. rest activity. Calibrated fMRI is a promising technique for studying functional neuroplastic changes during learning but follow up studies with longer tasks and a larger sample size are needed to maximise SNR and establish whether changes over time during complex cognitive tasks are repeatable.Acknowledgements
This work was supported by the Wellcome Trust and Cardiff University.References
1. Pelletier, J., Audoin, B., Reuter, F., & Ranjeva, J. P. (2009). Plasticity in MS: from functional imaging to rehabilitation. The International MS Journal, 16(1), 26-32. 2. Davis, T. L., Kwong, K. K., Weisskoff, R. M., & Rosen, B. R. (1998). Calibrated functional MRI: mapping the dynamics of oxidative metabolism. Proceedings of the National Academy of Sciences, 95(4), 1834-1839. 3. Wong, E. C., Buxton, R. B., & Frank, L. R. (1998). Quantitative imaging of perfusion using a single subtraction (QUIPSS and QUIPSS II). Magnetic resonance in medicine, 39(5), 702-708. 4. Liu, T. T., Wong, E. C., Frank, L. R., & Buxton, R. B. (2002). Analysis and design of perfusion-based event-related fMRI experiments. NeuroImage,16(1), 269-282. 5. Nissen, M. J., & Bullemer, P. (1987). Attentional requirements of learning: Evidence from performance measures. Cognitive psychology, 19(1), 1-32. 6. Wong, E. C., Buxton, R. B., & Frank, L. R. (1999). Quantitative perfusion imaging using arterial spin labeling. Neuroimaging Clinics of North America,9(2), 333-342. 7. Murphy, K., Harris, A., & Wise, R. (2013). Measuring the influence of hypercapnia on absolute CMRO2 in humans. In Proc. Intl. Soc. Mag. Reson. Med, Vol. 21, p. 3343 8. Bright, M. G., & Murphy, K. (2013). Reliable quantification of BOLD fMRI cerebrovascular reactivity despite poor breath-hold performance. NeuroImage, 83, 559-568. 9. Bulte, D.P., Kelly, M., Germuska, M., Xie, J., Chappell, M.A., Okell, T.W., Bright, M.G. and Jezzard, P., (2012). Quantitative measurement of cerebral physiology using respiratory-calibrated MRI. Neuroimage, 60(1), pp.582-591.Figures