5306
Comparison of Quantitative Specific Ventilation Imaging in the Lung with Oxygen Enhanced 1H and 3He Multibreath MRI1UT Southwestern Medical Center, Dallas, TX, United States, 2Academic Unit of Radiology, The University of Sheffield, Sheffield, United Kingdom, 3Pulmonary Imaging Laboratory, University of California, San Diego, San Diego, CA, United States
Synopsis
Two multi-breath imaging techniques for quantifying specific ventilation based on oxygen enhanced 1H and hyperpolarized 3He gas MRI were cross-validated with spatially matched data from the same subjects. With a custom RF torso 1H array configured with 3He T-R coil in situ we were able to separately acquire 1H and hyperpolarized 3He MRI during a single scanning session without repositioning the subject. The preliminary study demonstrated qualitative as well as quantitative similarities between the two techniques.
Purpose
Comparison of quantitative measurements of specific ventilation made using (i) oxygen enhanced proton (OE-1H) and (ii) hyperpolarized gas MRI in healthy human subjects. Two functional pulmonary MRI techniques based on OE-1H MRI during washin-washout of oxygen[1] and multiple-breath washout imaging using hyperpolarized 3He (HP-3He)[2] have been introduced in recent years, for quantitative mapping of specific ventilation (SV: local tidal volume/local functional residual capacity). The aim of this work was preliminary cross-validation of the two SVI techniques in spatially matched data. With an in-house RF torso 1H array configured with 3He coil in situ[3] we were able to separately acquire 1H and hyperpolarized 3He MR images during a single scanning session without repositioning of the subjects.Methods
Data were collected from 8 healthy subjects on a GE 1.5-T Signa HDx scanner. A sagittal slice within the right lung with the largest anterior-posterior dimension was selected as a common imaging plane. The pixel resolution of reconstructed images was matched to 0.6 x 0.6 x 1.0 cm. All images were acquired at functional residual capacity (FRC) while the subjects voluntarily synchronized their respiration with the image acquisition.
OE-1H: 220 successive inversion recovery single shot fast spin echo images were acquired at 5 second intervals (IR-HASTE sequence effective TE = 23ms, inter TE = 4.5ms, TI = 1100ms). The inhaled gas was switched every 20 images between air and 100% oxygen, resulting in a change in OE 1H signal from the lungs. The local SV was computed voxel-wise by curve-fitting to a predetermined washin-washout model[1] that calculates SV from the rate of change in OE signal, assuming that all dynamic signal changes are caused by the T1 shortening in direct proportion to the change in local alveolar partial pressure of oxygen.
HP-3He: The same subject inhaled a single 1L mixture of N2 and hyperpolarized 3He (100 ml, 25% polarization). The first two images (TE = 1.0ms, TR = 3.4ms, and flip angle = 4.0˚) were acquired during a breath-hold following the inhalation and used to estimate the contributions of T1 decay and RF depolarization to the inherent MR signal decay. Following the calibration, the image acquisition was performed at end-expiration after each normal breath of air, every 4 seconds to monitor the washout of 3He. The local SV was computed from the signal decay in each voxel[2]. The geometric means of SV within lung region of interest (meanSV) were computed for OE-1H and HP-3He for each subject.
Results
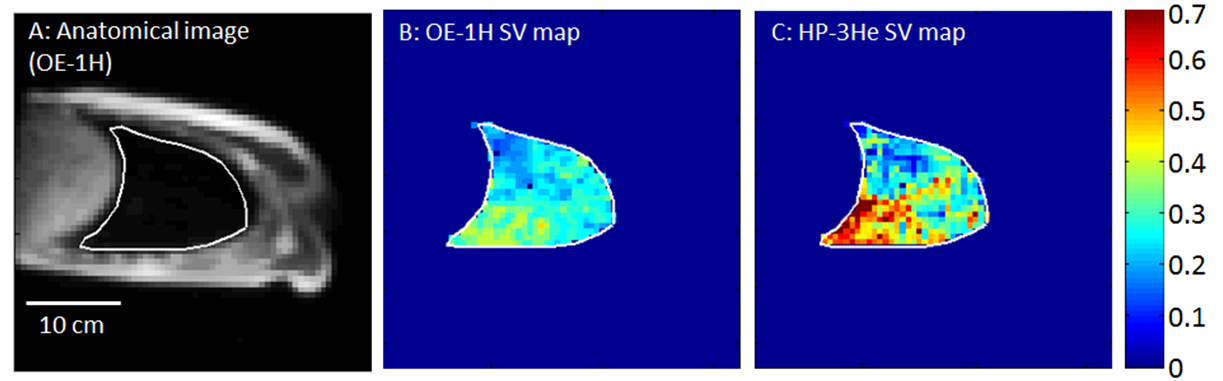
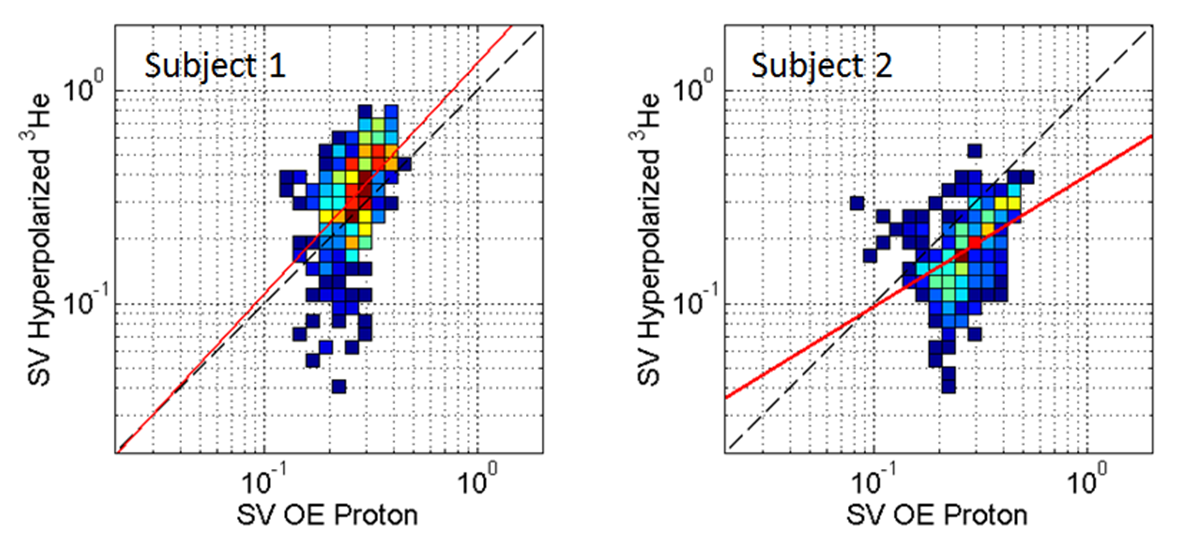
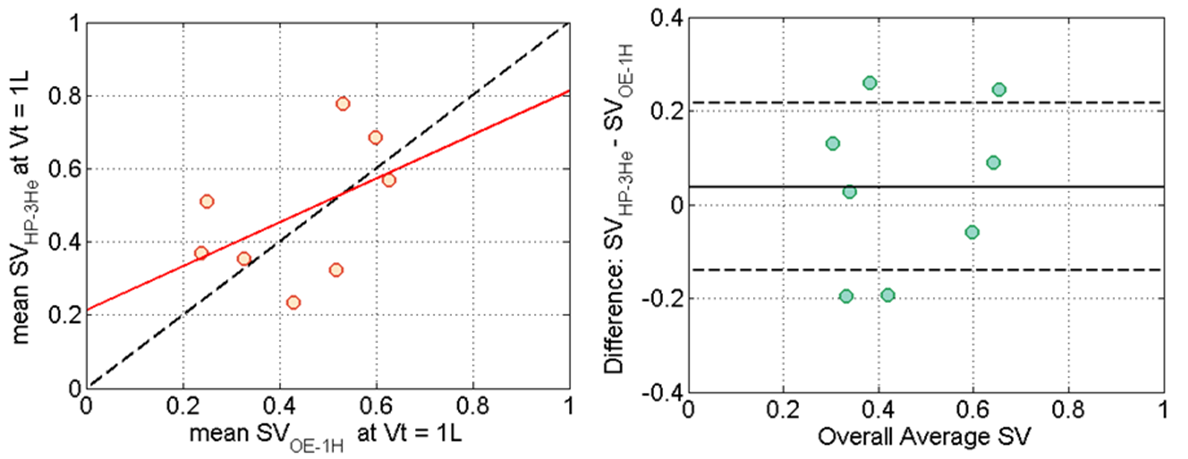
The average tidal volumes (Vt) for 8 subjects were 0.70 ± 0.22 liter/breath and 0.78 ± 0.23 liter/breath during OE-1H and HP-3He scans, respectively. The difference was not statistically significant. Figure 1 shows two SV maps obtained from a single subject in the supine position. Voxel-by-voxel correlation maps obtained from spatially co-registered SV maps are also given in Figure 2 (logarithmic scale) in which the correlation coefficients were 0.51 and 0.45 (p < 0.01), respectively. The average meanSV over 8 subjects were 0.28 ± 0.08 and 0.36 ± 0.20 for OE-1H and HP-3He respectively. There was no statistically significant difference between two meanSV data. Figure 3A shows the pairwise relationship of meanSV data normalized at Vt of 1 liter (R = 0.48) while Figure 3B shows its corresponding Bland-Altman plot (Overall average SV: 0.46, Bias: 0.04, Interval of Agreement: 0.18).Discussion
Spatially co-registered SV maps presented a moderate correlation. The meanSVs shown in the current study were close agreement with previously reported values[1][2]. Although there was no statistically significant difference, meanSV measured using HP-3He was greater than OE-1H by 0.08, accounting for +26.0 % of overall average of meanSV of OE-1H. This is partially explained by elevated tidal volume (+10.6 %) during HP-3He when compared to OE-1H since the elevation in tidal volume directly changes meanSV. The tidal volume matched data demonstrated the population averages were close agreement between two techniques with a small bias. However, the pairwise correlation between the two sets of tidal volume corrected meanSV data was not significant. Bland-Altman plot also showed the interval of agreement of 0.18, which accounts for 38.7 % of overall average. Future work will involve the validation of ventilation heterogeneity (an indicator of gas exchange efficiency as well as small airway obstruction) using the two techniques.Conclusion
Two quantitative specific ventilation imaging techniques based on oxygen enhanced proton and hyperpolarized 3He gas MRI were cross-validated in spatially matched data. The preliminary study demonstrated the feasibility to derive specific ventilation from both methods without moving the subjects. The result showed qualitative as well as quantitative similarities between two techniques.Acknowledgements
Acknowledgements: This work was funded by EU FP7 projects Pinet and AirPROM, and the National Institute of Health Research (NIH).References
[1] Sa et al. Journal of Applied Physiology, vol. 109: 1950-1959, 2010;
[2] Horn et al. Journal of Applied Physiology, vol. 116: 129-139, 2014;
[3] Rao et al. Magnetic Resonance in Medicine, DOI: 10.1002/mrm.25384
Figures