5305
Quantitative Mapping of Cerebrovascular Reactivity using Resting-state BOLD fMRI: A Validation in Healthy Adults1Department of Psychology, University of Toronto, Toronto, ON, Canada, 2Department of Medical Biophysics, University of Toronto, Toronto, ON, Canada, 3Rotman Research Institute at Baycrest, Toronto, ON, Canada
Synopsis
Cerebrovascular reactivity (CVR) is commonly mapped as the response of the blood oxygenation level dependent (BOLD) signal to a hyper/hypocapnic breathing challenge, which might be intolerable for some patients. We proposed a method to estimate quantitative CVR using intrinsic fluctuations of end-tidal CO2 (PETCO2) during resting-state fMRI data acquisition (rs-qCVR). We validated our rs-qCVR method against the “gold-standard” hyper/hypocapnic CVR method, demonstrating significantly association between the two in the majority of the healthy subjects.
Purpose
Cerebrovascular reactivity (CVR) is an important vascular-health indicator, and is commonly measured from the blood-oxygenation level-dependent (BOLD) functional MRI response to a change in the end-tidal CO2 (PETCO2) level, induced by a breathing challenge1. Typically, CVR is measured as the ratio between changes in the BOLD signal and in PETCO2. The breathing challenge, however, is not tolerable by all patients2, significantly limiting the clinical applicability of conventional CVR techniques. The rs-fMRI signal encompasses not only neuronal information but also substantial non-neural contributions through intrinsic physiological processes3. In this study, we exploit the vascular nature of physiological rs-fMRI to achieve quantitative CVR mapping using the resting-state BOLD signal (rs-CVR)4. We validated rs-CVR against CVR calculated from the conventional hyper/hypocapnia method.Method
16 healthy subjects (age = 26.5 ± 6.5 years) were scanned using a Siemens TIM Trio 3T MRI scanner with a 32-channel head coil. Resting-state BOLD scans were collected using the simultaneous multi-slice GE-EPI BOLD technique5. (TR/TE = 380/30 ms, flip angle = 40°, 20 5-mm slices, 64x64 matrix, 4x4x5 mm voxels, 1900 volumes). During the resting-state functional imaging sessions, we recorded heart rate using the scanner’s built-in finger oximeter, attached to the left index finger. We also recorded respiration using a pressure-sensitive respiration belt, connected to the BiopacTM (Biopac Systems, California). PETCO2 measurements were passively monitored using a breathing circuit connected to a RespirActTM system (Thornhill Research, Toronto, Canada). For cross-validation of our proposed method, we modulated PETCO2 sinusoidally (period = 120 s, baseline-to-peak amplitude = ±4mmHg)6 using the RespirActTM breathing circuit, and measured the BOLD signal using the second echo of a dual-echo pseudo-continuous ASL (pCASL) sequence (TR = 3500 ms, TEBOLD = 25 ms, FA = 90°, 20 slices, 3.44´3.44x6 m3, 120 volumes). rs-fMRI processing includes: motion correction, spatial smoothing, de-trending, and removing time-locked cardiac and respiratory effect using RETROICOR method. Respiratory-volume variability (RVT) and cardiac rate variability (CRV) were calculated from recordings7 and orthogonalized with respect to PETCO2 signal. Subsequently, CRV and RVT response functions were estimated7 and their effect on the BOLD signal were regressed out. The voxel-wise rs-fMRI response to PETCO2 changes (HRFCO2) was then estimated using canonical response estimation, implemented in SPM (UCL). The estimated HRFCO2 was convolved with the PETCO2 time course and the result was regressed against the preprocessed BOLD signal at each voxel, with the slope of this regression taken as the qCVR (rs-qCVR). The pseudo gold standard CVR was calculated using the BOLD response to sinusoidally modulated PETCO2 8.Results
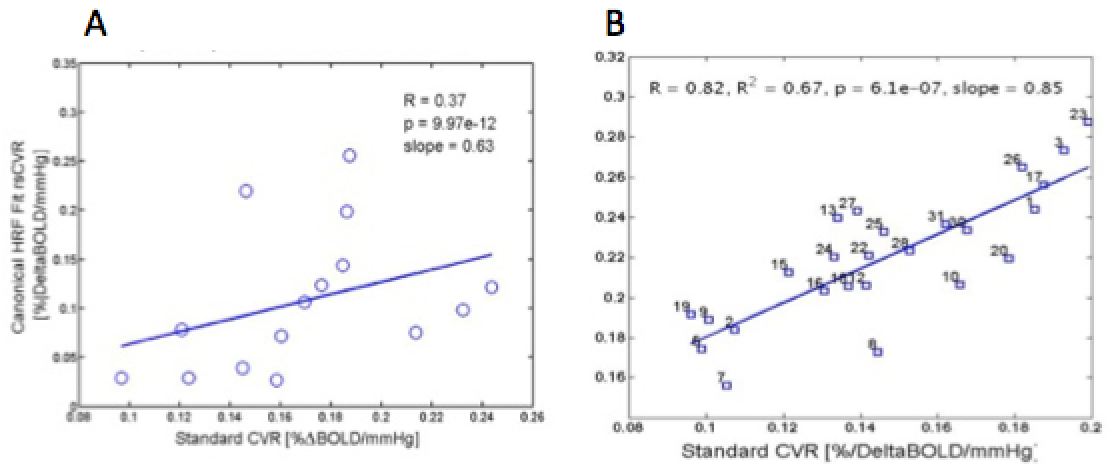
Three subjects had excessive head motion during the scans and were excluded from the study, resulting in 13 datasets. Shown in Figure A is the association between rs-qCVR and standard qCVR measurements across these subjects. To investigate rs-qCVR estimation accuracy in terms of its spatial variations, 32 anatomical regions of interest (ROI) maps were generated by FreeSurfer, within which the gold standard and rs-CVR values were averaged. Correlation between the two CVR measures for a representative subject is shown in Figure B. Overall, 10 out of 13 subjects had significant (p<0.05), and the remaining 3 subjects had close to significant (p<0.1) correlation between conventional and rs-CVR4.Discussion and Conclusion
We showed that it is feasible to estimate quantitative CVR from rs-fMRI data with the aid of passive end-tidal CO2 recording. Our rs-qCVR estimates provide good representations of the spatial CVR variability found in standard qCVR maps. Our rs-fMRI based method is non-invasive, and safe even for those with severe vascular-risk factors. Moreover, it is much less demanding in terms of instrumentation and requires minimum cooperation from the subject. Therefore our method can potentially have immediate impact for studying various clinical populations.Acknowledgements
No acknowledgement found.References
1- Bright, M.G., Bulte, D.P., Jezzard, P., Duyn, J.H., 2009. Characterization of regional heterogeneity in cerebrovascular reactivity dynamics using novel hypocapnia task and BOLD fMRI. NeuroImage 48, 166–175.
2- Spano, V.R., Mandell, D.M., Poublanc, J., Sam, K., Battisti-Charbonney, A., Pucci, O., et al., 2013. CO2 Blood Oxygen Level-dependent MR Mapping of Cerebrovascular Reserve in a Clinical Population: Safety, Tolerability, and Technical Feasibility. Radiology 266, 592–598.
3- Biswal, B.B., Kannurpatti, S.S., 2009. Resting-state functional connectivity in animal models: modulations by exsanguination. Methods in Molecular Biology 489, 255-274.
4- Golestani, A.M., Wei, L.L., Chen, J.J., 2016. Quantitative Mapping of Cerebrovascular Reactivity using Resting-state BOLD fMRI: Validation in Healthy Adults. Neuroimage 138, 147-163.
5- Setsompop, K., Gagoski, B.A., Polimeni, J.R., Witzel, T., Wedeen, V.J., Wald, L.L., 2011. Blipped-controlled aliasing in parallel imaging for simultaneous multislice echo planer imaging with reduced g-factor penalty. Magn Reson Med doi: 10.1002/mrm.23097.
6- Blockley, N.P., Driver, I.D., Francis, S.T., Fisher, J.A., Gowland, P.A., 2011. An improved method for acquiring cerebrovascular reactivity maps. Magn Reson Med 65, 1278–1286.
7- Golestani, A.M., Chang, C., Kwinta, J.B., Khatamian, Y.B., Chen, J.J., 2015. Mapping the end-tidal CO2 response function in the resting-state BOLD fMRI signal: Spatial specificity, test–retest reliability and effect of fMRI sampling rate. NeuroImage 104, 266 – 277.
8- Blockley, N.P., Driver, I.D., Francis, S.T., Fisher, J.A., Gowland, P.A., 2011. An improved method for acquiring cerebrovascular reactivity maps. Magn Reson Med 65, 1278–1286.
Figures