5303
The effect of low-level carbon monoxide exposure on BOLD FMRI1Biological and Medical Sciences, Oxford Brookes University, Oxford, United Kingdom, 2Academic Unit of Radiology, University of Sheffield, Sheffield, United Kingdom
Synopsis
Carbon monoxide (CO) is a cerebral vasodilator, yet effects of low-level CO exposure (from e.g. smoking) on BOLD FMRI remain unknown. We scanned 12 never-smokers at 3T before and after inhaling low-level CO (or air as a control). CO significantly reduced BOLD response to carbon dioxide during breath holds and attenuated visual cortex activation during visual stimulation and fingertapping, but also increased premotor cortex activation during fingertapping. This indicates that CO generally dampens BOLD signal (possibly through elevated baseline CBF), but that the effect may be task- and/or region-dependent. Caution should be exercised when comparing populations with different CO levels.
Introduction
Carbon monoxide (CO) is a cerebral vasodilator, and elevations in hemoglobin-bound CO (carboxyhemoglobin) has been shown to increase cerebral blood flow (CBF)1,2. Blood-oxygen level dependent (BOLD) FMRI signal is CBF dependent. Elevated baseline CBF may impair the capacity for further local vasodilation and thus reduce task-related BOLD signal3-5. CO binds to hemoglobin with a greater affinity than oxygen, and carboxyhemoglobin levels may be increased by exposure to environmental factors such as smoke or exhaust fumes. For example, smokers typically exhibit elevated exhaled CO (≥6 ppm) compared to non-smokers (≤ 6ppm). Effects of low-level CO exposure on BOLD signal in humans have not yet been explored. The purpose of this study was therefore to investigate how low-level CO inhalation affects BOLD FMRI activation in healthy individuals.Methods
12 healthy never-smokers (8F, 25.3±4.3 years) were scanned on two occasions in a Siemens 3T TIM-Trio scanner, with a 12-channel head coil using BOLD EPI acquisitions (TR=3000ms, TE=30ms, FOV=192x192mm, voxel-size=3x3x3mm, 45 slices). FMRI tasks included breath-holds (end-exhalation), visual stimulation (8Hz flashing checkerboard) and a (right hand) fingertapping task. A structural T1-weighted scan (MPRAGE, TR=2040ms, TE=4.7ms, flip angle=8°, voxel-size=1x1x1mm) was used for image registration to MNI152 standard space. Baseline and post-intervention BOLD scans were obtained on each experimental day, separated by a 5 min breathing intervention (air or CO, order randomized and counterbalanced). CO was elevated from baseline to 6ppm exhaled. Heart rate, pulse oximetry, respiration (bellows) and end-tidal partial pressures of oxygen (PETO2) and carbon dioxide (PETCO2) were continuously sampled. Two simple reaction time tasks were conducted in the scanner (baseline and post-intervention). FMRI data processing was carried out within FSL using FEAT (v5.98). Pre-processing of the data included MCFLIRT motion correction, spatial smoothing with a full-width-half-maximum Gaussian kernel (5mm) and high-pass temporal filtering (60s). Large motion artefacts were excluded using FSL motion outliers. Data was modelled using FILM with local autocorrelation correction. Physiological noise effects were regressed out, CO2 included separately as a regressor and a 6s hemodynamic delay assumed. A middle-level fixed-effects model generated individual COPE images for each experimental day. Group analyses compared COPE images (baseline vs post-intervention) between protocols for each task. For breath holds, the explanatory variable of interest was variation in PETCO2. Cluster Z threshold was 2.3 and corrected cluster significance threshold p=0.05.
Results
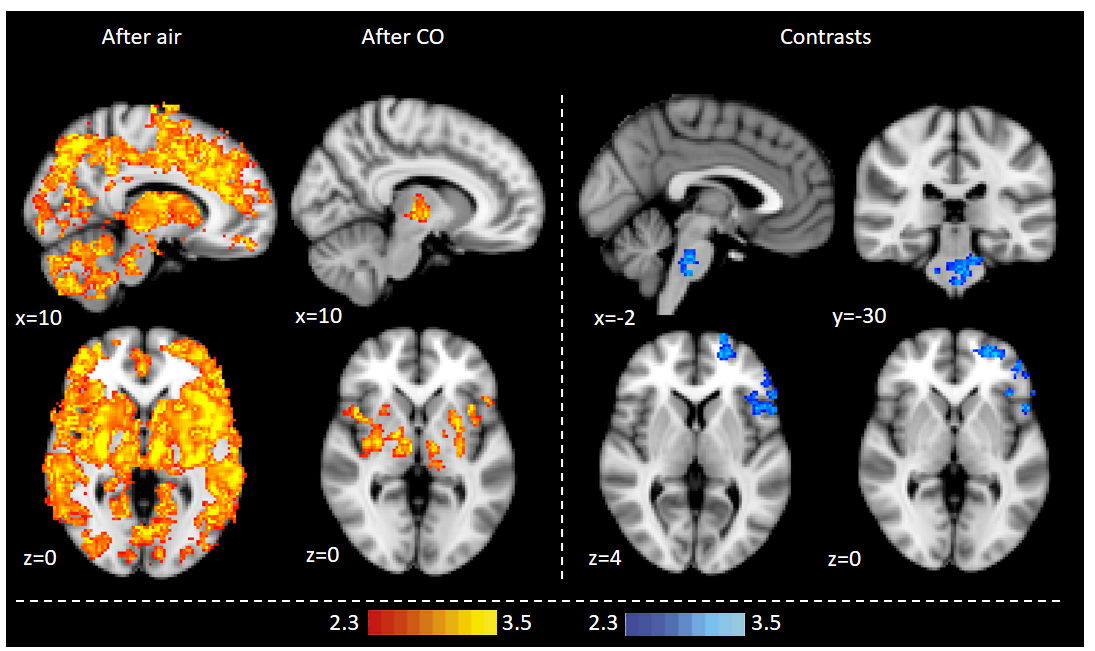
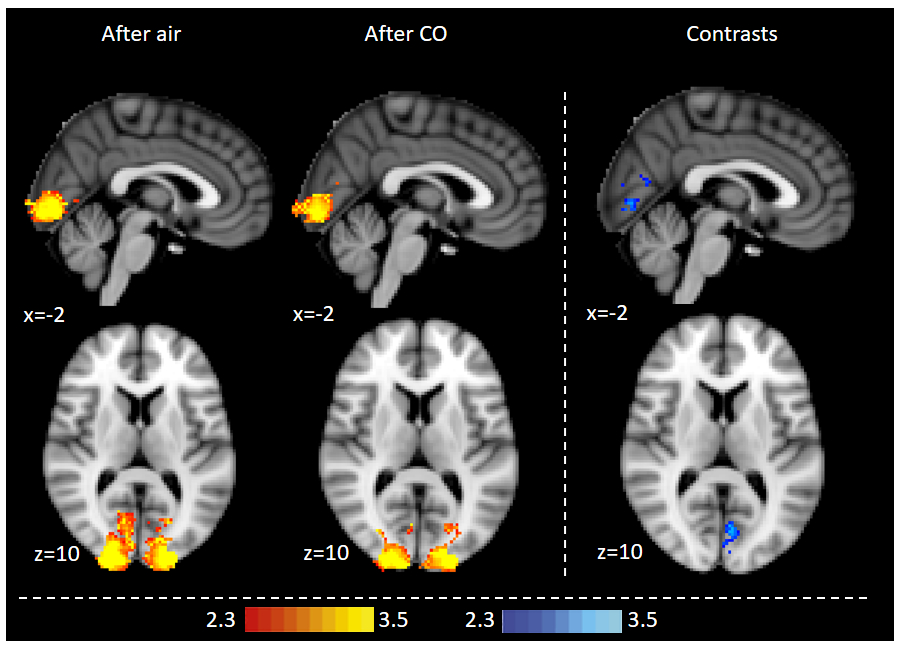
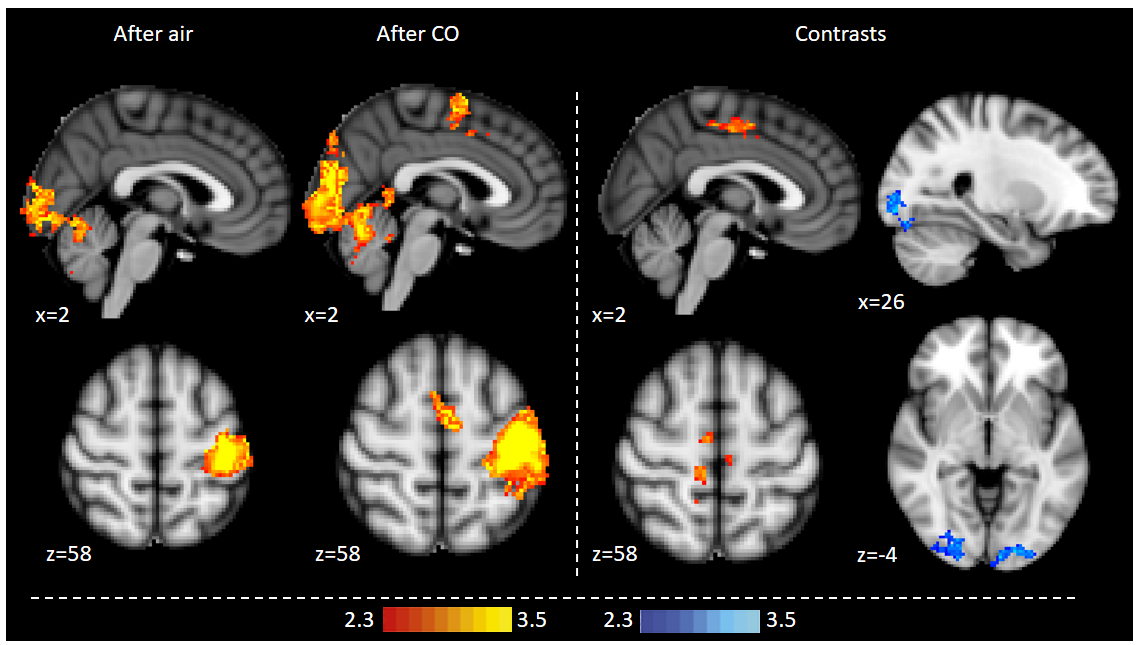
Exhaled CO values increased significantly in the CO protocol (mean baseline 2.9±1.0ppm, mean post-intervention 5.7±1.0ppm, p<0.0001), but not with air. When prompted, participants were not able to discern between the CO and air protocol. CO reduced BOLD FMRI signal with CO2 accumulation during breath holds in the left operculum, middle/inferior frontal gyrus, dorsolateral prefrontal cortex and the brainstem (Fig 1). CO reduced BOLD activation during visual stimulation in the visual cortex (Fig 2). CO reduced visual cortex activation and increased premotor cortex activation during the fingertapping task (Fig 3). Reaction time responses showed no significant difference between protocols (p=0.29). PETO2 was reduced post-intervention in both protocols, but no significant difference was found between protocols (p=0.57). PETCO2 and heart rate did not change during the study.Discussion
This study demonstrates that low-level CO exposure on par with light smoking significantly alters BOLD FMRI signal, and might significantly and differentially affect different types of FMRI tasks. Overall, we observe a dampening of the BOLD signal with CO, which could be caused by baseline CBF increases. During fingertapping, the air protocol showed reduced activation post-intervention in the premotor cortex, possibly due to habituation6, which was not observed in the CO protocol. This contrast was reflected in the group analysis, where the CO protocol showed higher motor cortex activation than air, but also dampened visual activation similar to the visual task. This indicates that CO does not have a simple, uniform effect on BOLD signal, but rather may depend on the type of task and activated brain regions. These findings suggest that caution should be exercised when comparing populations with different carboxyhemoglobin levels.Acknowledgements
We would like to thank Dr Olivia Faull and Dr Anja Hayen for their generous feedback on the abstract.References
1. Meilin S, Rogatsky GG, Thom SR, et al. Effects of carbon monoxide on the brain may be mediated by nitric oxide. J Appl Physiol. 1996;81(3):1078-83.
2. Benignus VA, Petrovick MK, Newlin-Clapp L, et al. Carboxyhemoglobin and brain blood flow in humans. Neurotoxicol Teratol. 1992;14(4):285-90.
3. Cohen ER, Ugurbil K and Kim SG. Effect of basal conditions on the magnitude and dynamics of the blood oxygenation level-dependent fMRI response. J Cereb Blood Flow Metab. 2002;22(9):1042-53.
4. Brown GG, Eyler Zorrilla LT, Georgy B, et al. BOLD and perfusion response to finger-thumb apposition after acetazolamide administration: differential relationship to global perfusion. J Cereb Blood Flow Metab. 2003;23(7):829-37.
5. Harris AD, Murphy K and Wise R. CBF modulation of task-positive and task-negative BOLD responses to a cognitive task: differential effects in the default mode network. Proc ISMRM Annual Meeting, Salt Lake City, 2013. Abstract no 3342.
6. Loubinoux I, Carel C, Alary F, et al. Within-session and between-session reproducibility of cerebral sensorimotor activation: A test-retest effect evidenced with functional magnetic resonance imaging. J Cereb Blood Flow Metab. 2001;21(5):592-607.
Figures