5301
Measuring cerebrovascular reactivity in terms of resistance1Anaesthesia, University of Toronto, Toronto, ON, Canada
Synopsis
Conventional measurements of cerebrovascular reactivity (CVR) are often based on the BOLD changes in response to a ramp CO2 stimulus ranging from hypo- to hypercapnia. Using a simple model of two vascular beds, one with a healthy standard reference resistance, competing for the same limited blood supply, we derive the sigmoidal relative resistance changes in the other branch of the model from measured BOLD responses. Maps displaying the spatial pattern of the relative resistance sigmoid parameters describe the physiology and pathophysiology of the vessels themselves and thus may provide more clinically useful insight.
Purpose
To measure the relative resistance responses to progressive hypercapnia in normal individuals and patients with known cerebrovascular disease.Introduction
The cerebral blood flow (CBF) response to a ramp increase in the end-tidal partial pressure of CO2 (PetCO2) differs between brain regions partly because of differing resistance responses and partly because of changes in perfusion pressure induced by other brain regions competing for a blood flow supply limited by the significant resistance of the major cerebral arteries (Sobczyk et al., 2014; Bhogal et al., 2015). Consequently, CVR measurements reflect both of these aspects. We introduce a method to estimate the underlying relative vascular resistance responses using a simple model, and show maps displaying the spatial pattern of the resistance parameters.Methods
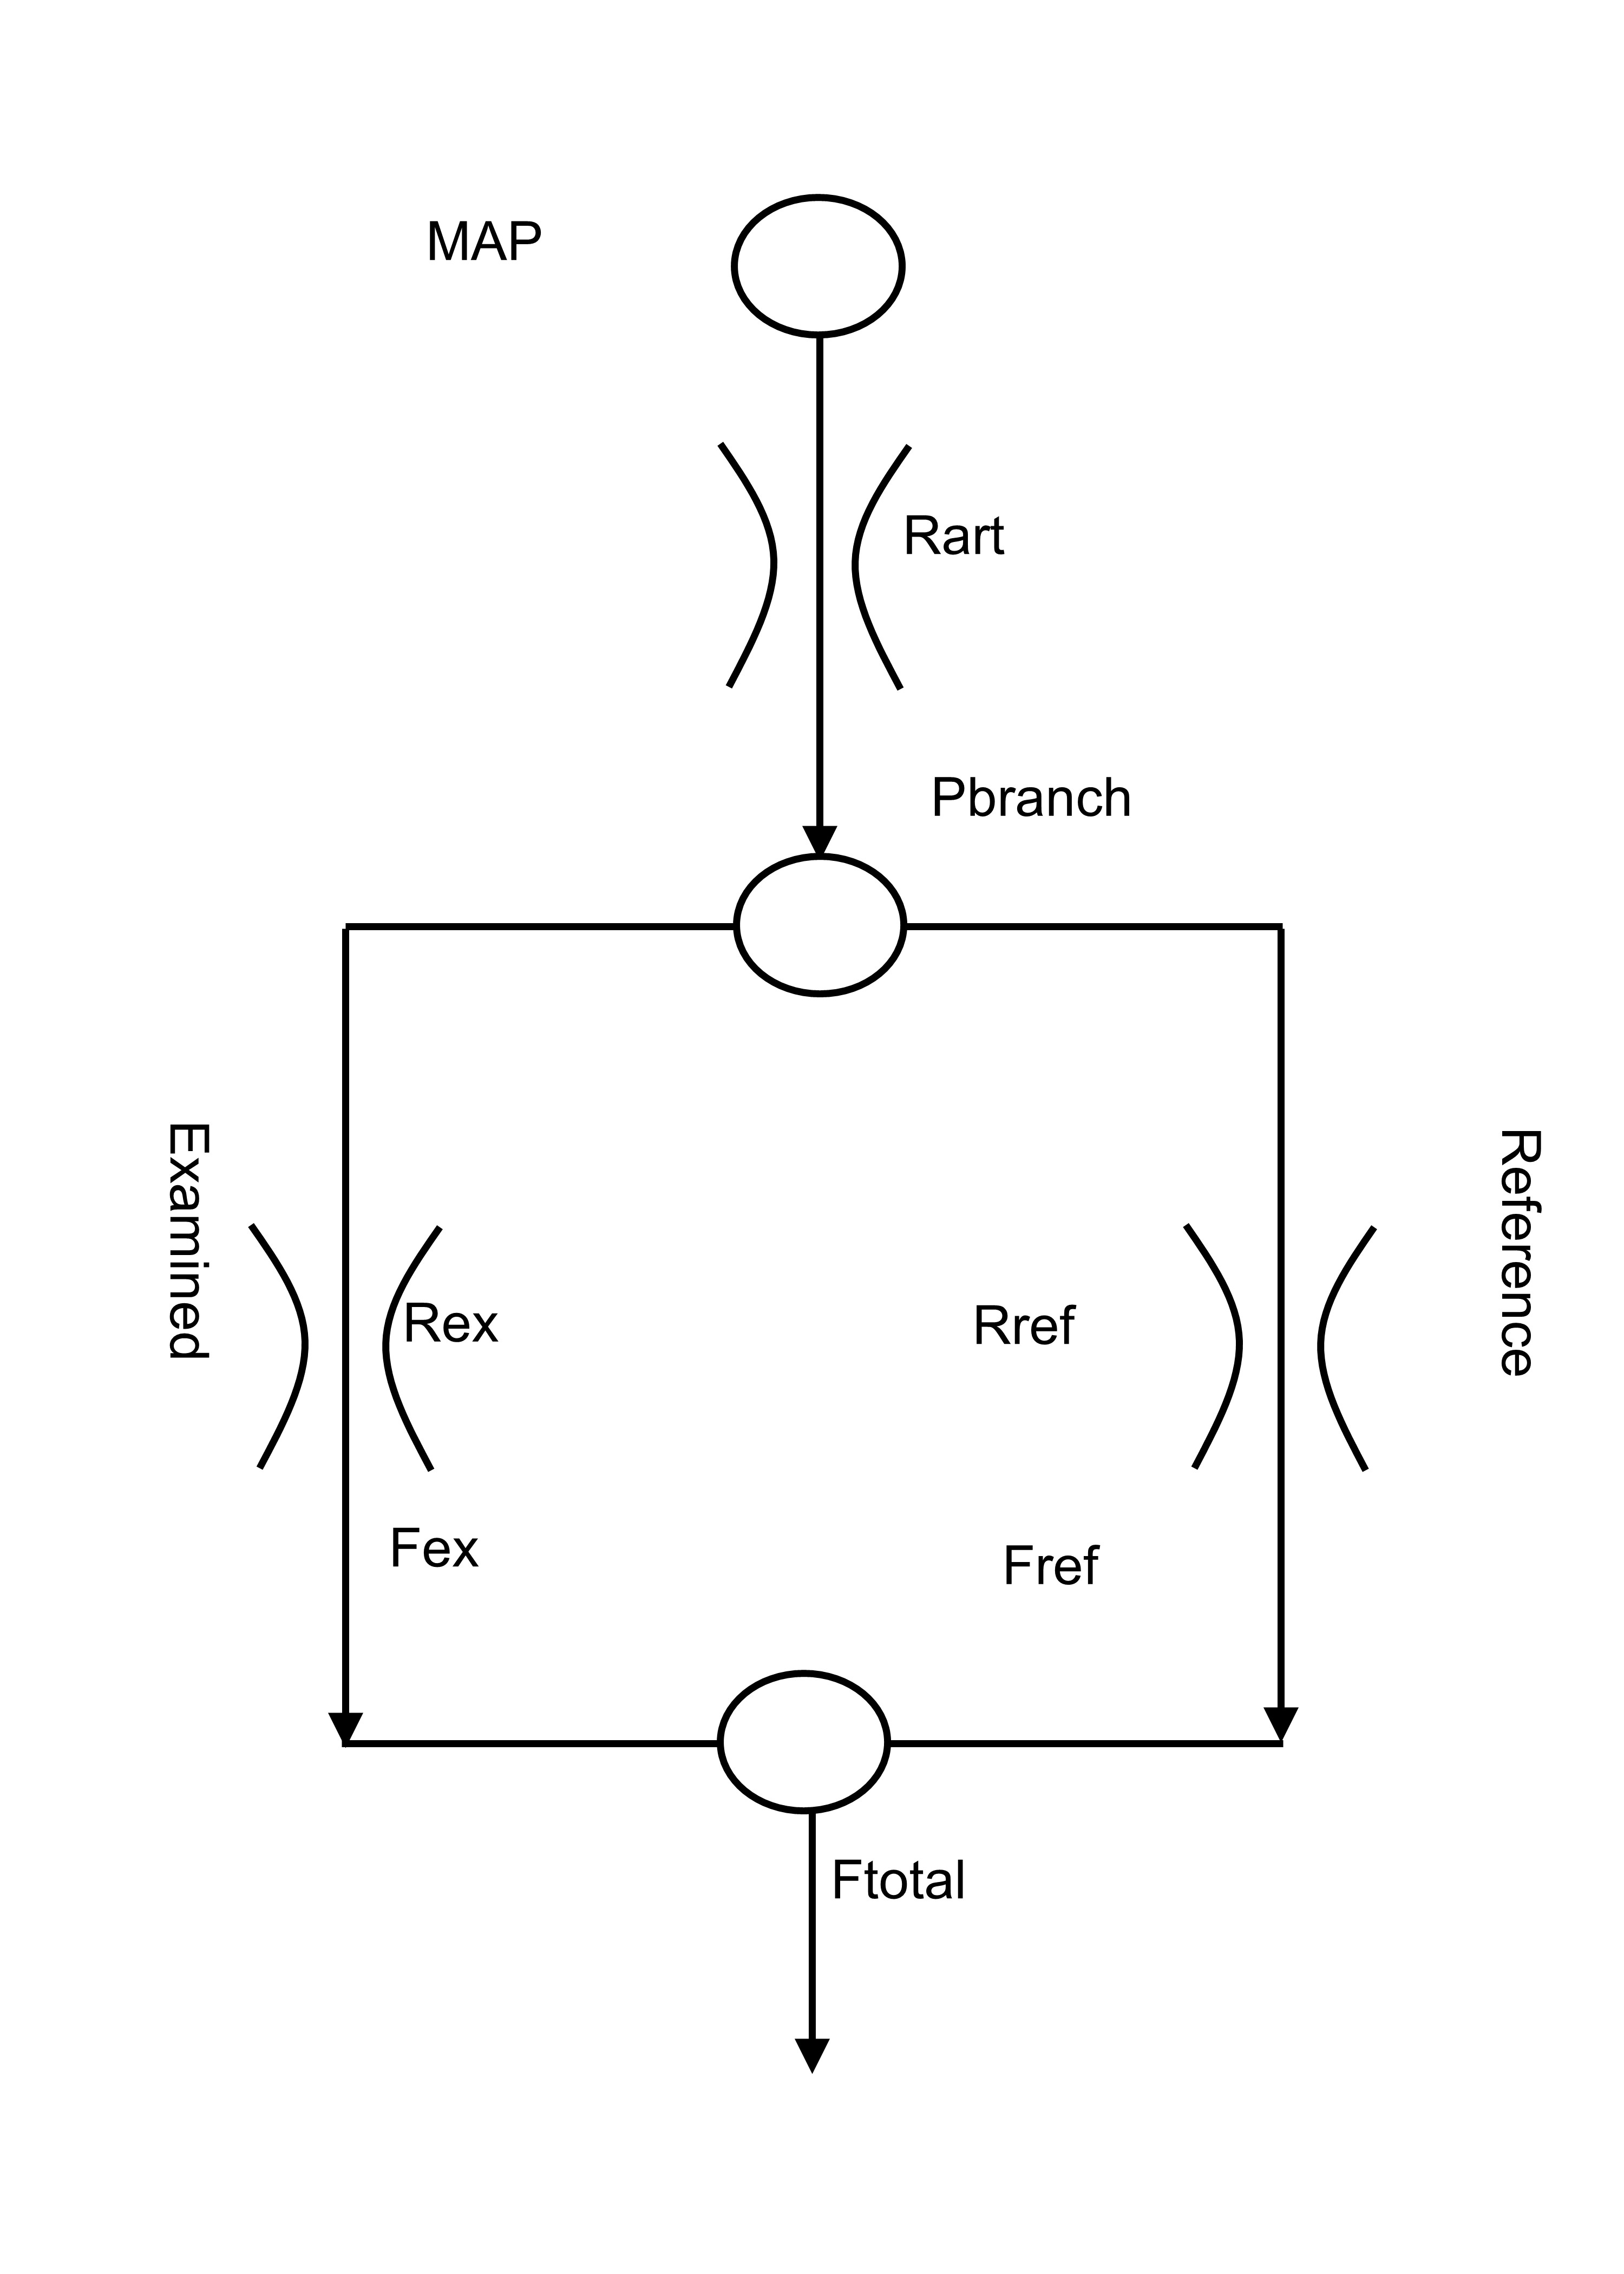
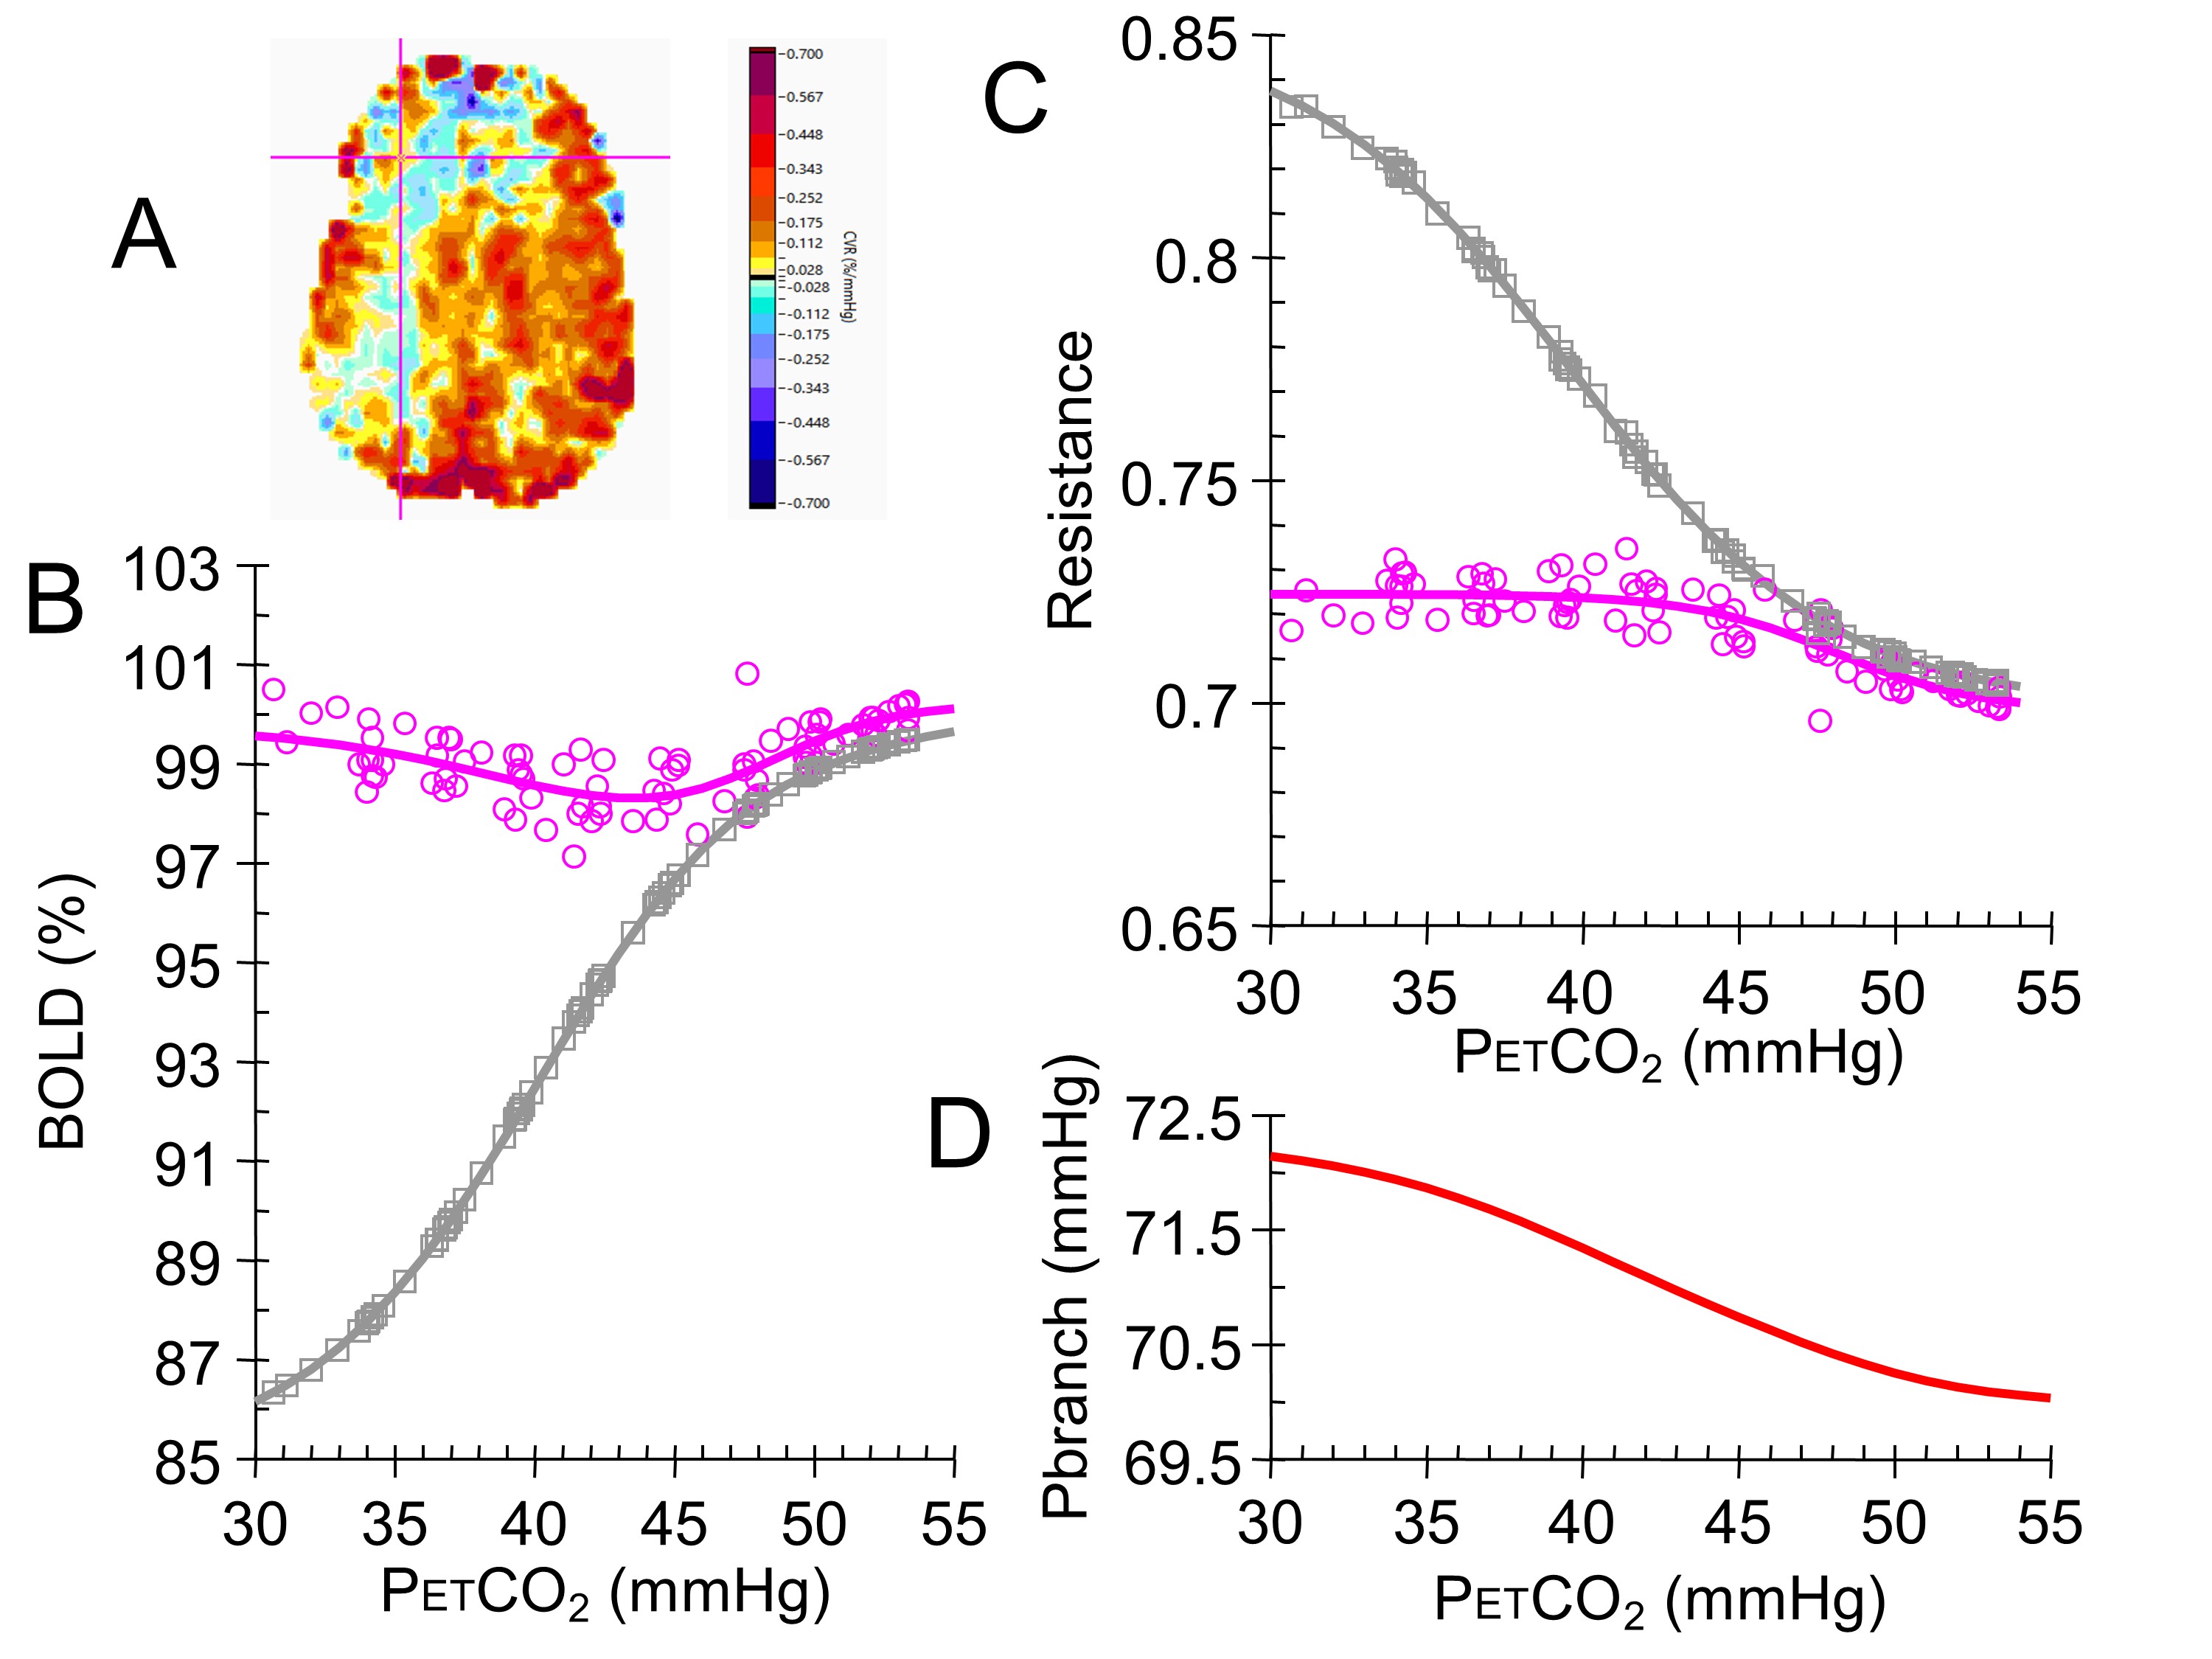
Figure 1 shows the model, which consists of two vessels (fractally scaled from vascular beds in single voxels to cerebral hemispheres) competing for a limited blood supply via a fixed arterial flow resistance. By assigning one branch of the model to a standard healthy reference resistance with a sigmoidal response, the derived competing branch resistances may be compared. BOLD responses to a ramp increase in PetCO2 from hypo- to hypercapnia were a surrogate measure of CBF and used to calculate the relative resistance responses. These resistance responses were fitted with sigmoids, and then used to calculate model BOLD response patterns, which were compared to the measured BOLD responses (Figure 2) as a check on the calculations, and permit the calculation of a relative vasodilatory reserve. The quality of fit for the resistance sigmoids was assessed by r2 values, which were also mapped.Results
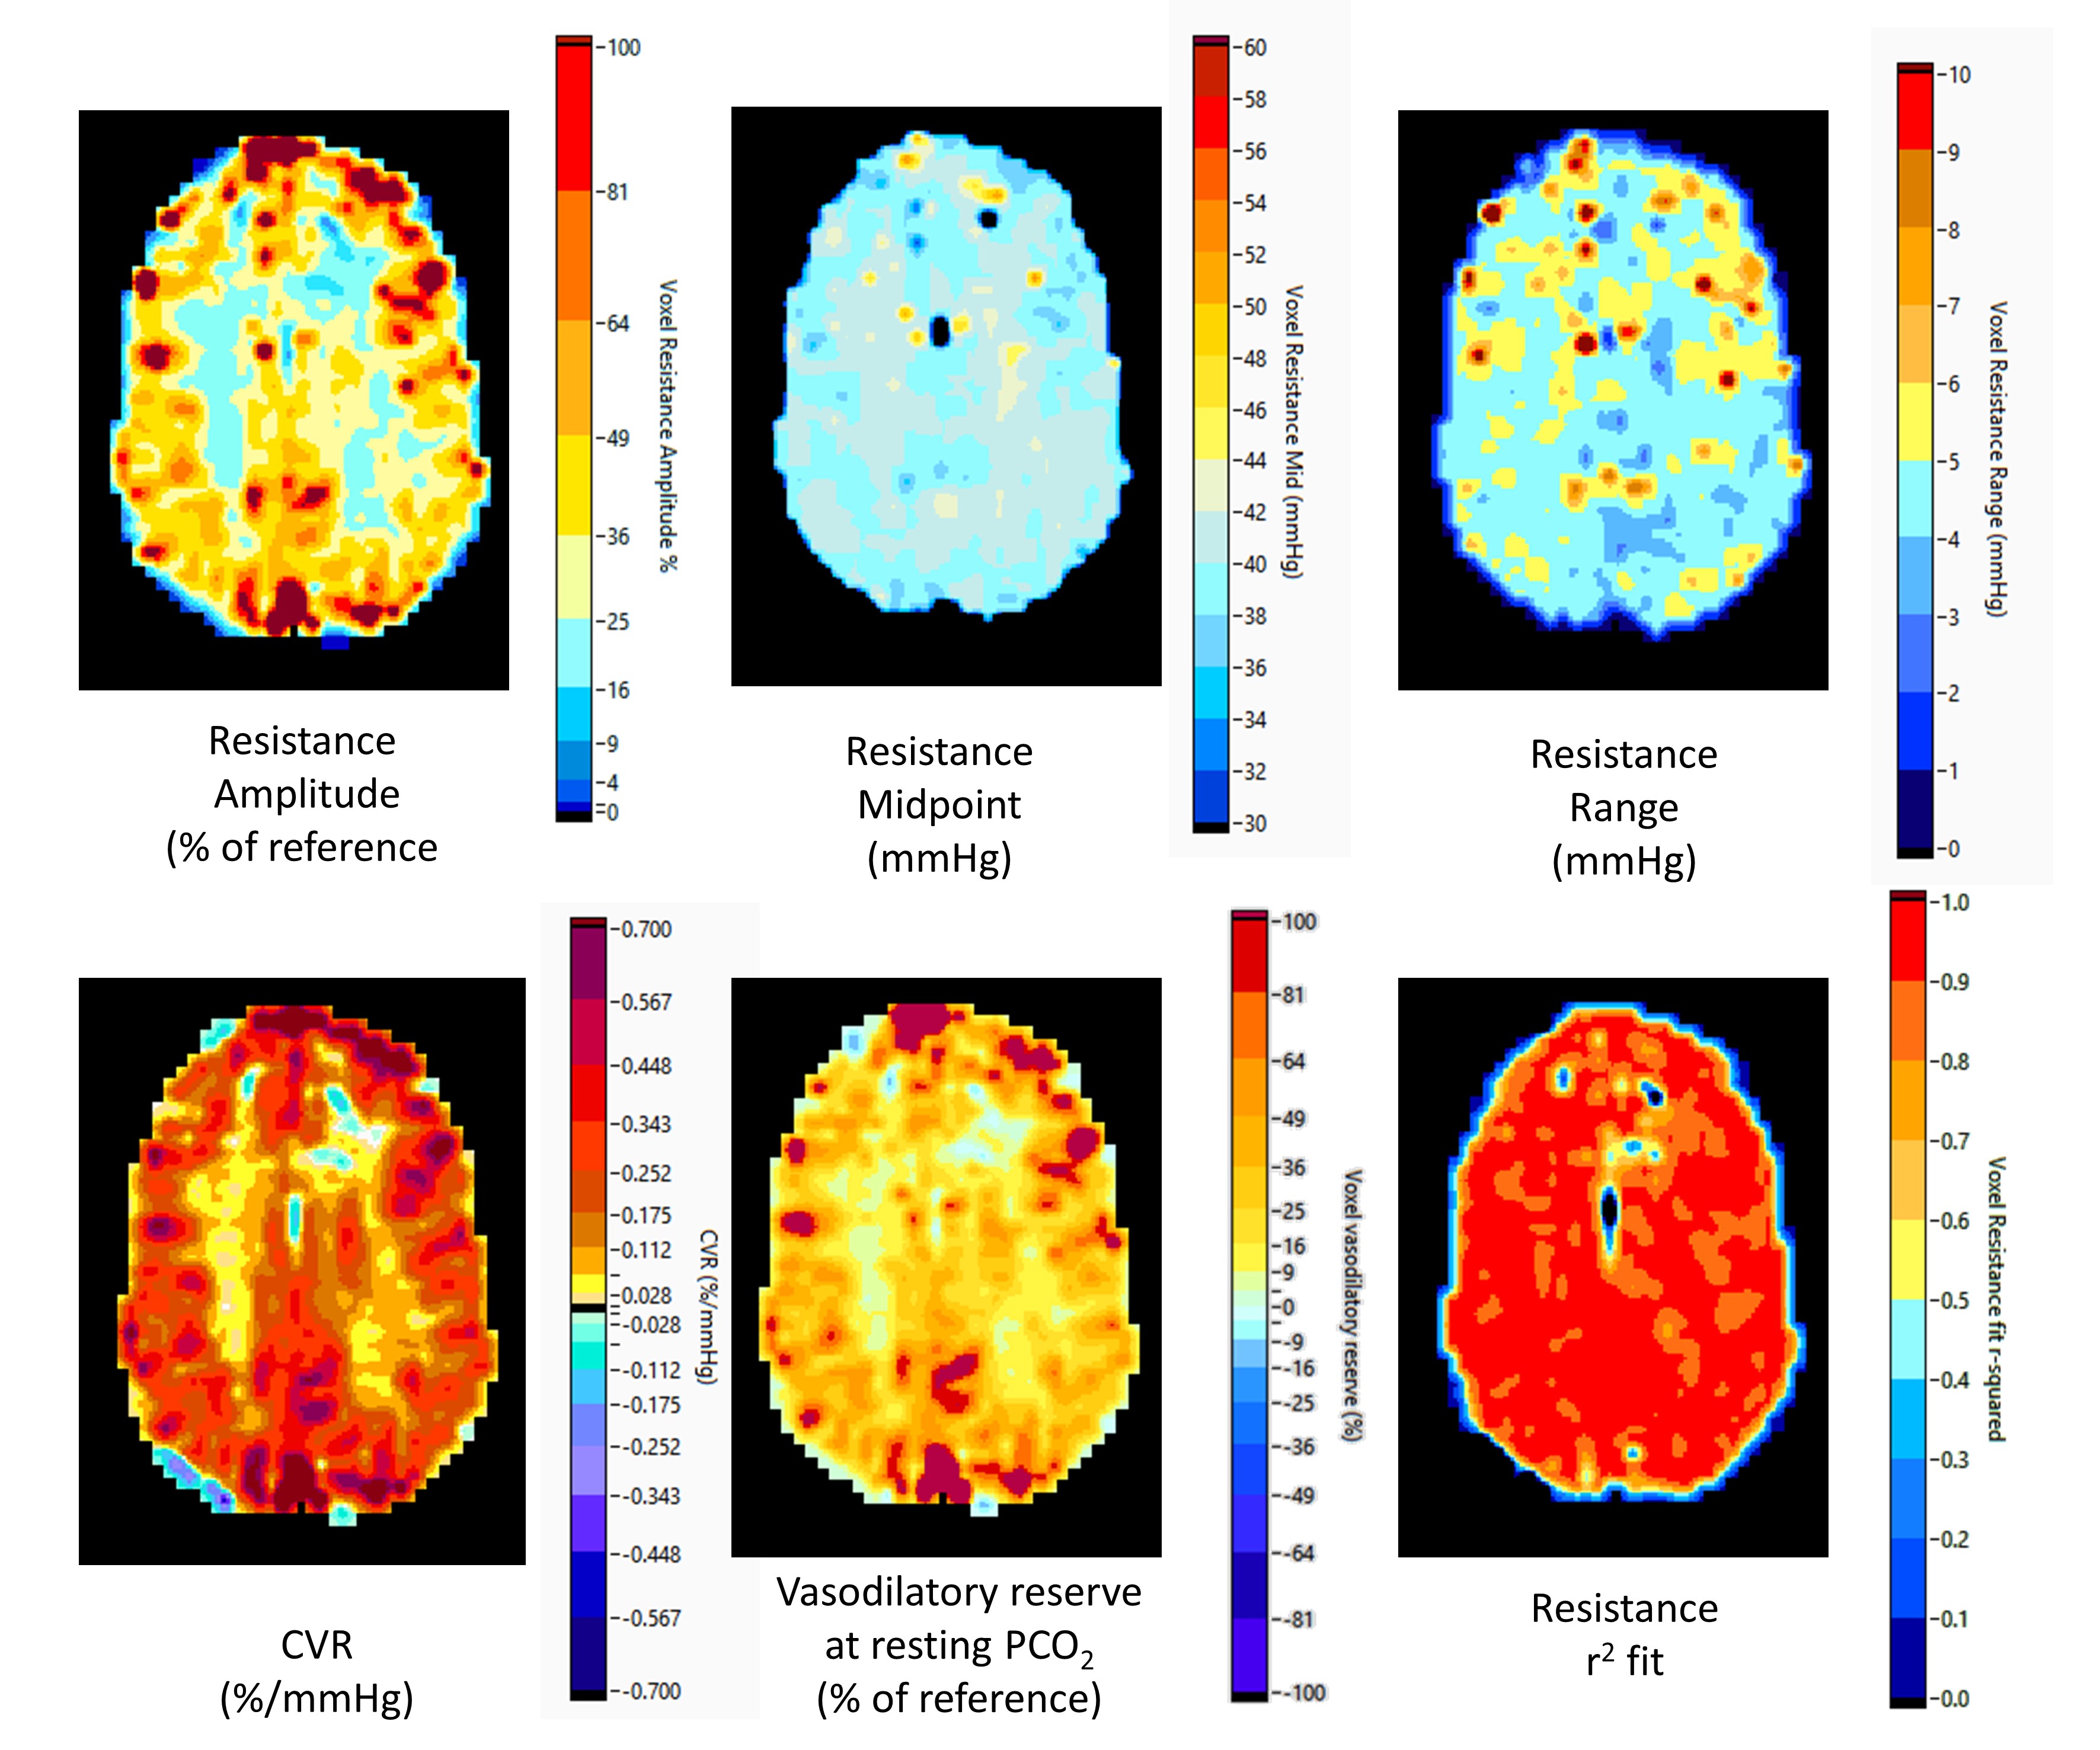
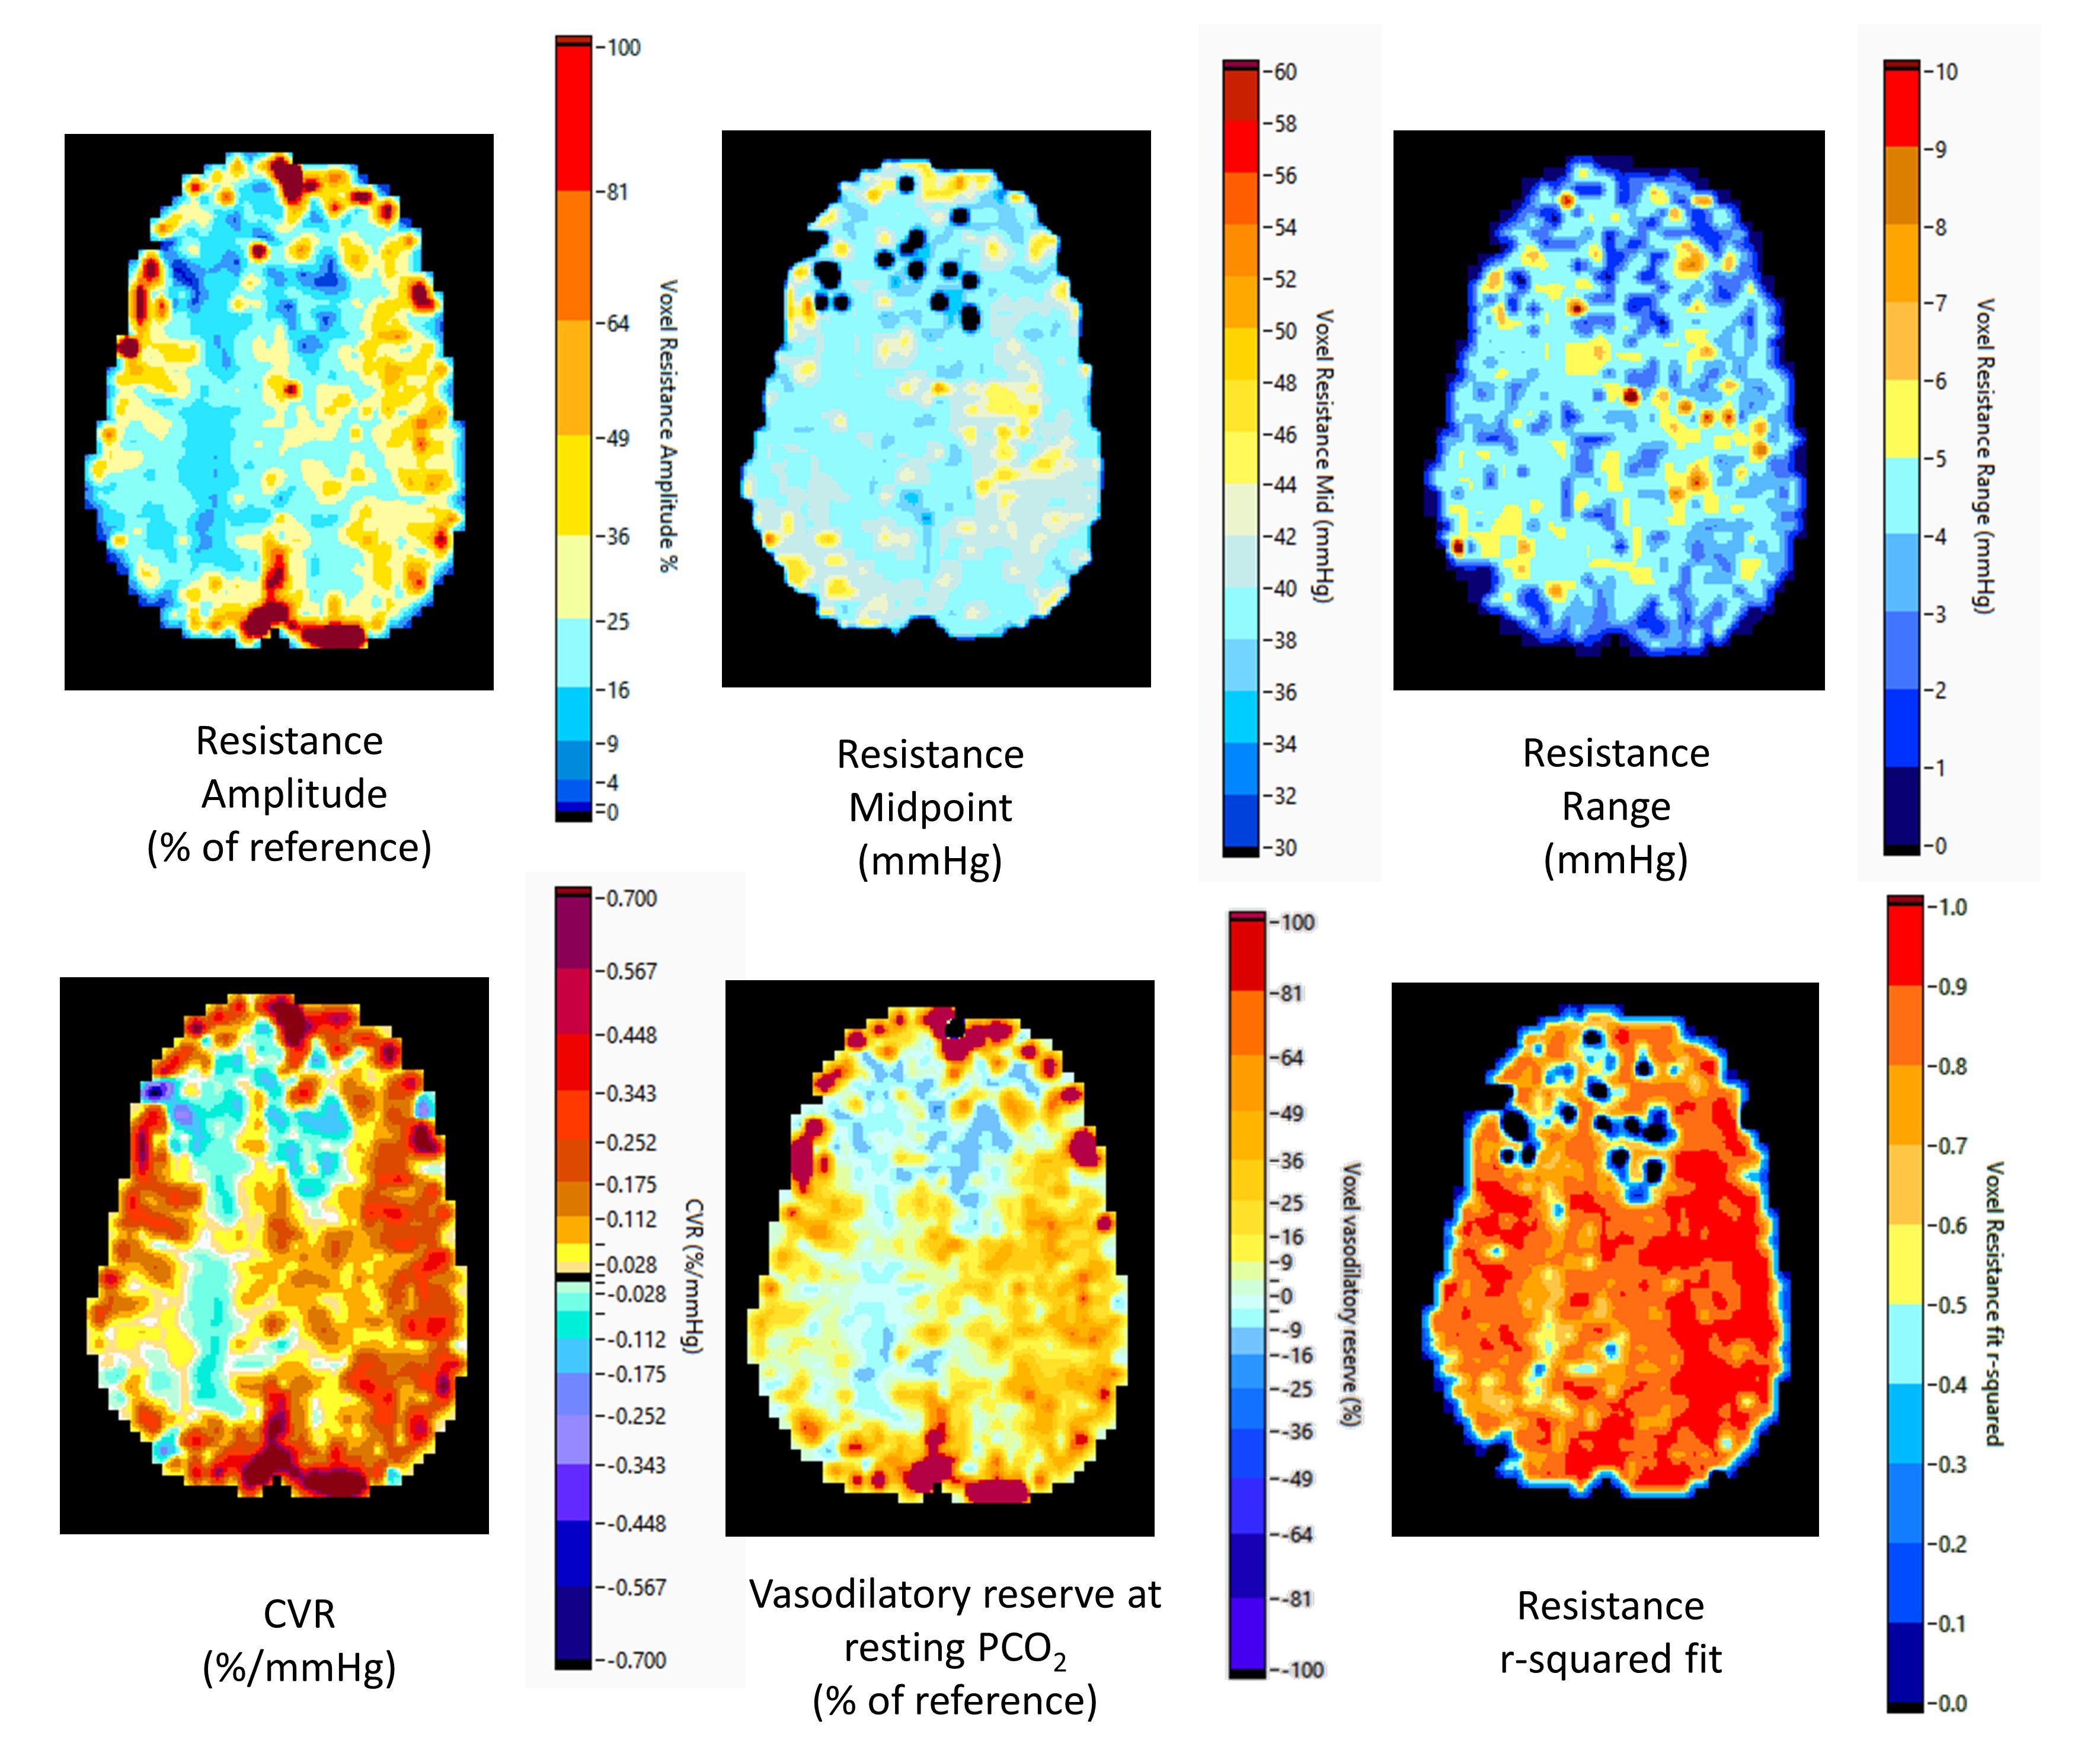
Illustrations of the relative resistance parameter maps for a normal individual and a patient with Moyamoya disease are shown in Figures 3 and 4. Conventional CVR maps calculated as the slope of the linear fit to the ramp data as well as maps of the r2 values of the sigmoidal fits to the resistances are also shown. The amplitude and relative vasodilatory reserve maps are scored as % relative to the reference resistance amplitude and reserve. The amplitude maps display the range of vascular resistance when stressed from hypo- to hypercapnia, and the vasodilatory reserve maps show the relative ability to vasodilate. The midpoint maps show the PetCO2 at which the response is most sensitive, and show that much of the brain is most sensitive at resting PetCO2, where pH is normal as expected. Areas with a higher midpoint PetCO2 may indicate areas where the regulation of resistance has adapted to maintain maximum sensitivity at the higher PetCO2. Finally, the range maps show where the shape of the resistance response sigmoid differs by indicating the range of PetCO2 over which the response is linear. An increased range indicates a flattened response pattern, reaching its limits farther from the midpoint, while a shorter range indicates a sharp response pattern, reaching its limits close to the midpoint.Discussion and Conclusions
This is the first report providing a physiologically based explanation of the BOLD response patterns to a ramp PetCO2 stimulus in terms of the underlying changes in resistance. That the resistance responses were sigmoidal, regardless of the measured BOLD responses (e.g. figure 2), is expected on physiologic principles and is verified by the high r2 fit values. We interpret high amplitude responses with midpoints close to resting PetCO2 as indicating highly responsive cerebral vasculature. Negative amplitudes signify the presence of steal where the reductions in resistance in the examined voxel is insufficient to counteract the decrease in local perfusion pressure caused by the vasodilation in healthy competing regions. When the midpoint of a region is lower than resting PetCO2 the resistance response reaches its minimum at a lower PetCO2 than the competing regions and so may be unable to vasodilate further as the CO2 stress increases. As a result the flow to this region may fall at the higher PetCO2. When the midpoint of a region is higher than the resting PetCO2 the resistance response may not initially decrease as CO2 stress increases and the resistance of the competing regions falls. With the resistance decreasing only at the higher PetCO2 stress, flow to these regions may fall initially and then rise as the CO2 stress increases further (see Figure 2). We concluded that this model approach provides a physiological explanation in terms of the differences in amplitude and midpoint of the sigmoidal resistance dependence on CO2 of a particular region compared to competing regions, thereby providing insight into regional pathophysiology.Acknowledgements
No acknowledgement found.References
Sobczyk O, Battisti-Charbonney A, Fierstra J, Mandell DM, Poublanc J, Crawley AP, Mikulis DJ, Duffin J & Fisher JA. (2014). A conceptual model for CO2-induced redistribution of cerebral blood flow with experimental confirmation using BOLD MRI. NeuroImage 92, 56-68.
Bhogal AA, Philippens ME, Siero JC, Fisher JA, Petersen ET, Luijten PR & Hoogduin H. (2015). Examining the regional and cerebral depth-dependent BOLD cerebrovascular reactivity response at 7T. Neuroimage 114, 239-248.
Figures