5300
Where is Physiological Noise Lurking in $$$k$$$-Space?1Department of Electrical Engineering and Automation, Aalto University, Espoo, Finland, 2Aalto NeuroImaging, Aalto University, Espoo, Finland, 3IndoorAtlas Ltd., Helsinki, Finland, 4Institute of Biomedical Engineering, National Taiwan University, Taipei, Taiwan, 5Department of Neuroscience and Biomedical Engineering, Aalto University, Espoo, Finland
Synopsis
We analyze the structure of physiological noise in the $$$k$$$-space of BOLD fMRI. We use DRIFTER which is an algorithm based on optimal Bayesian smoothing techniques for separation of the fMRI signal to a BOLD signal component and physiological noises. DRIFTER is run independently for each spatial frequency and it is shown that the physiological noise lies in the $$$k$$$-space points with low spatial frequency and that its amplitude is proportional to the BOLD signal. This result suggests that we can lower the computational burden without losing estimation accuracy by running DRIFTER only on a subset of $$$k$$$-space points.
Purpose
Structured non-white noise resulting from cardiac and respiratory activity can account for over a third of the total standard deviation in BOLD fMRI1, making proper treatment of these noise sources an essential part in enhancing the signal-to-noise ratio2. Removal of the structural noise is typically done retrospectively from the reconstructed images3,4, but it has been demonstrated5 that working directly with the raw $$$k$$$-space data is possible and can result to more accurate noise estimates. In this work, we investigate the $$$k$$$-space structure of the physiological noise, as estimated by the DRIFTER algorithm3. Knowing this spatial distribution is important as such, but it can also be used for reducing the computational burden of the DRIFTER algorithm—as the DRIFTER processes each spatial frequency independently and most of the energy is concentrated to low frequencies, we can save computations by only processing a subset of the $$$k$$$-space.
Methods
The DRIFTER algorithm is a retrospective estimation scheme for identification and removal of physiological noise in fMRI data. It is based on Bayesian optimal filtering and smoothing methods from signal processing. The algorithm decomposes the data into different noise components and the “cleaned” BOLD signal. In this work we apply DRIFTER to raw $$$k$$$-space data. After this we select spatial frequencies that contain most of the energy and process only these. This kind of subset processing is only possible in $$$k$$$-space whereas processing only some of the image space voxels would make little sense. Specifically, we use DRIFTER to compute the overall physiological noise distribution in the $$$k$$$-space and then investigate how the reconstructed images are affected if only the those spatial frequencies containing 90% or 50% of the total physiological noise energy are processed further. The actual image reconstruction is done with Kaiser–Bessel regridding6 and by weighting by the complete coil images when summing over the coil channels.
The test data consists of a 27-run set of raw resting state fMRI data and accompanying anatomical images of one volunteer. The data was obtained at Aalto AMI Centre of Aalto NeuroImaging, part of Aalto University School of Science, with a 3 T Siemens Skyra scanner using a 32-channel receive-only head-coil array. Parameters of the EPI sequence were TR: 77 ms; TE: 21 ms; FA: 60 degrees; FOV: 224 mm; matrix size: 64$$$\times$$$64; voxel size: 3.5$$$\times$$$3.5$$$\times$$$6 mm, and those of the EPI trajectory were ramp times: 140 $$$\mu$$$s; flat-top: 220 $$$\mu$$$s; ADC readout time: 409.6 $$$\mu$$$s. Each run had a length of approximately 30 seconds and consisted of a fixed reference slice and a second slice with the gap size between them advancing on each run. The reference cardiac and respiration signals were time-locked to the fMRI data with a peripheral (BIOPAC) pulse measure and a respiratory belt, respectively. The physiological signals were sampled with a frequency of 1 kHz. For the DRIFTER algorithm, two harmonic resonators were used with their frequencies for each run estimated from external cardiac and respiration signals.
Results
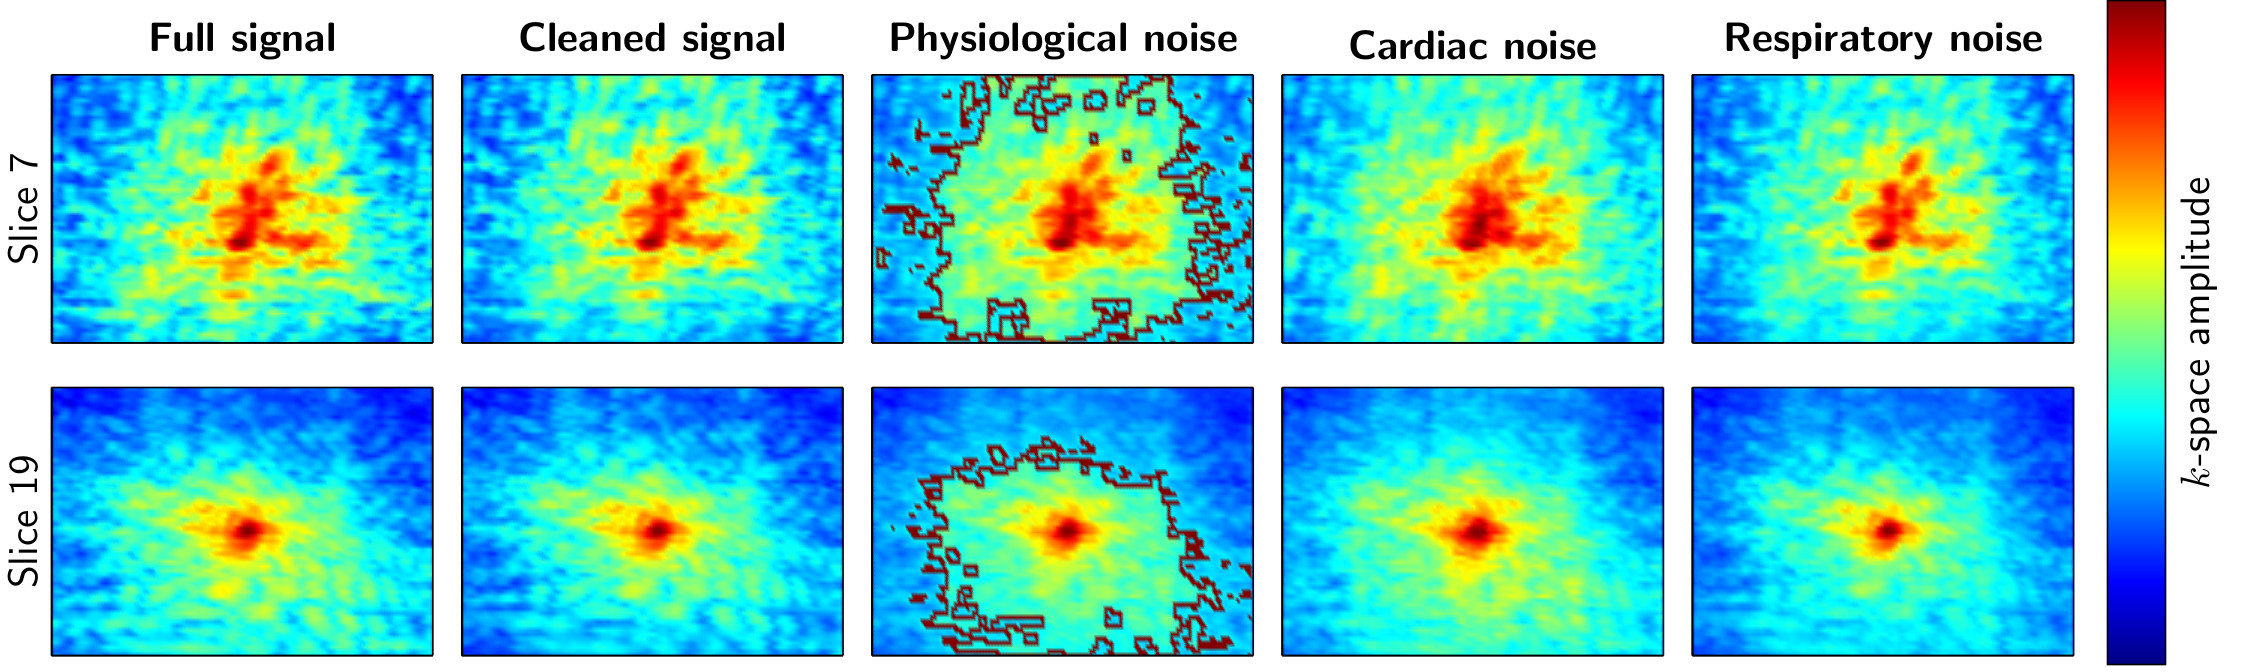
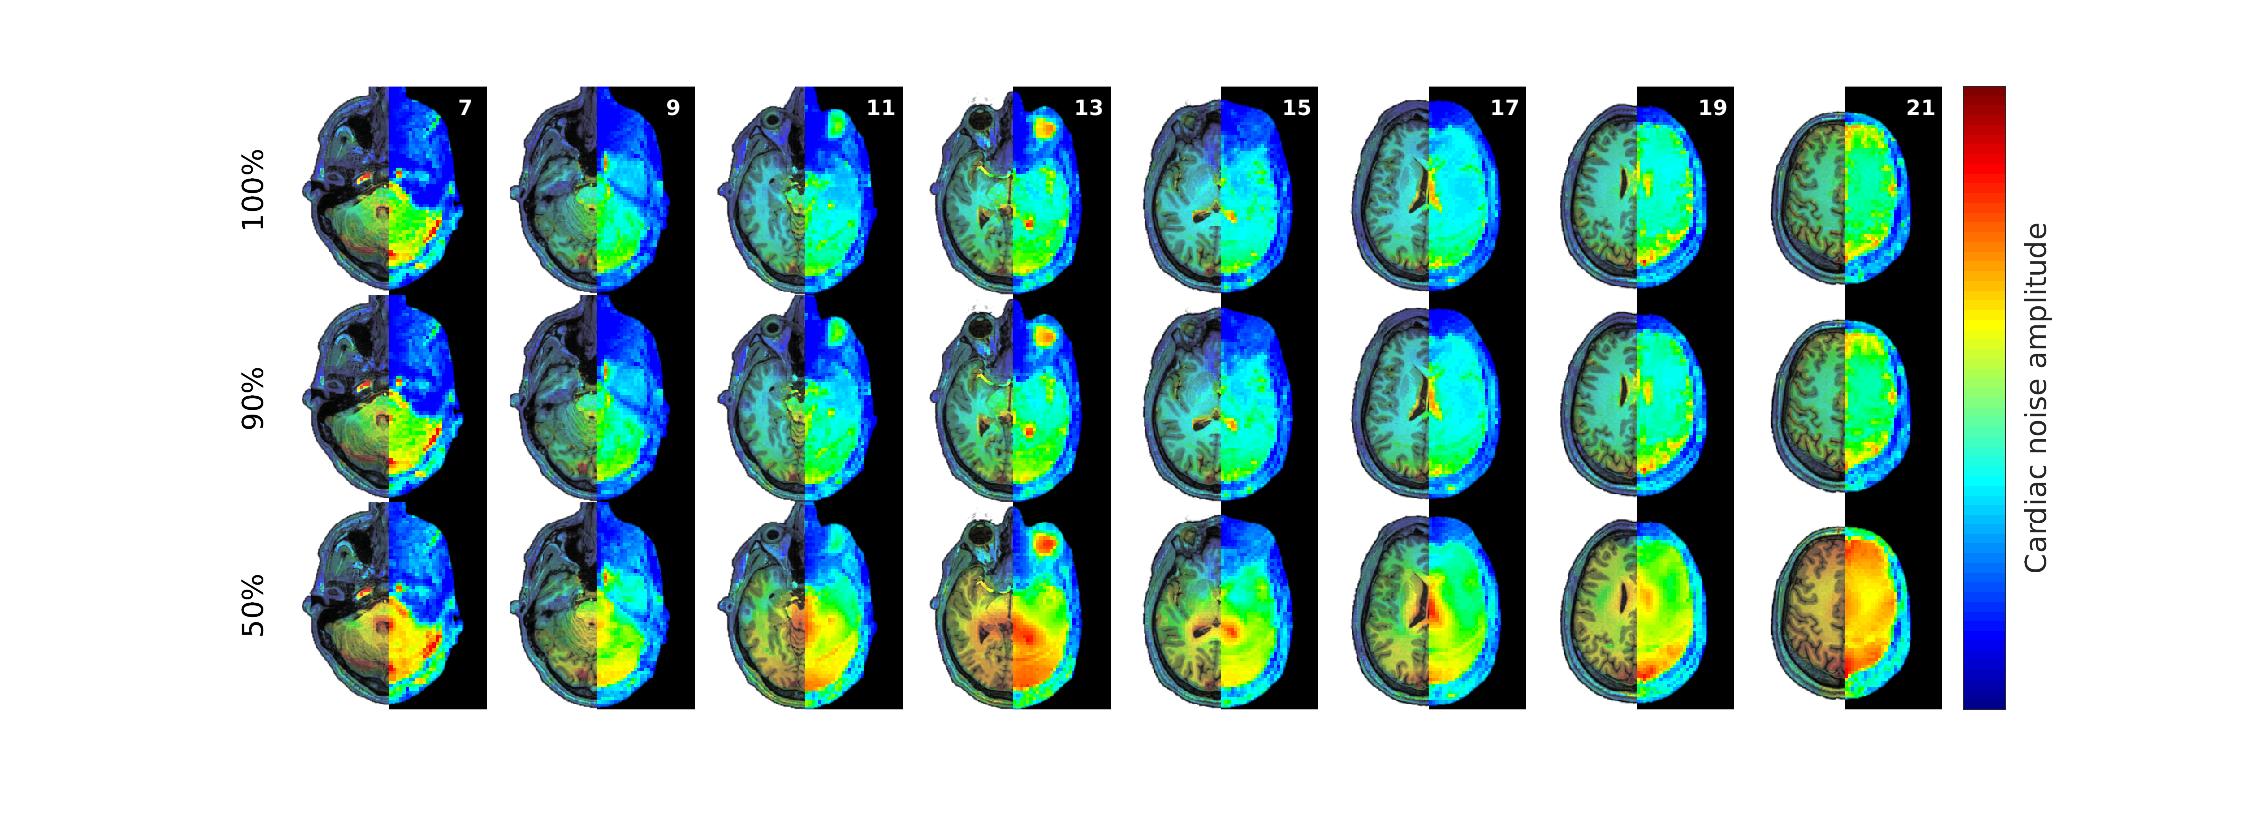
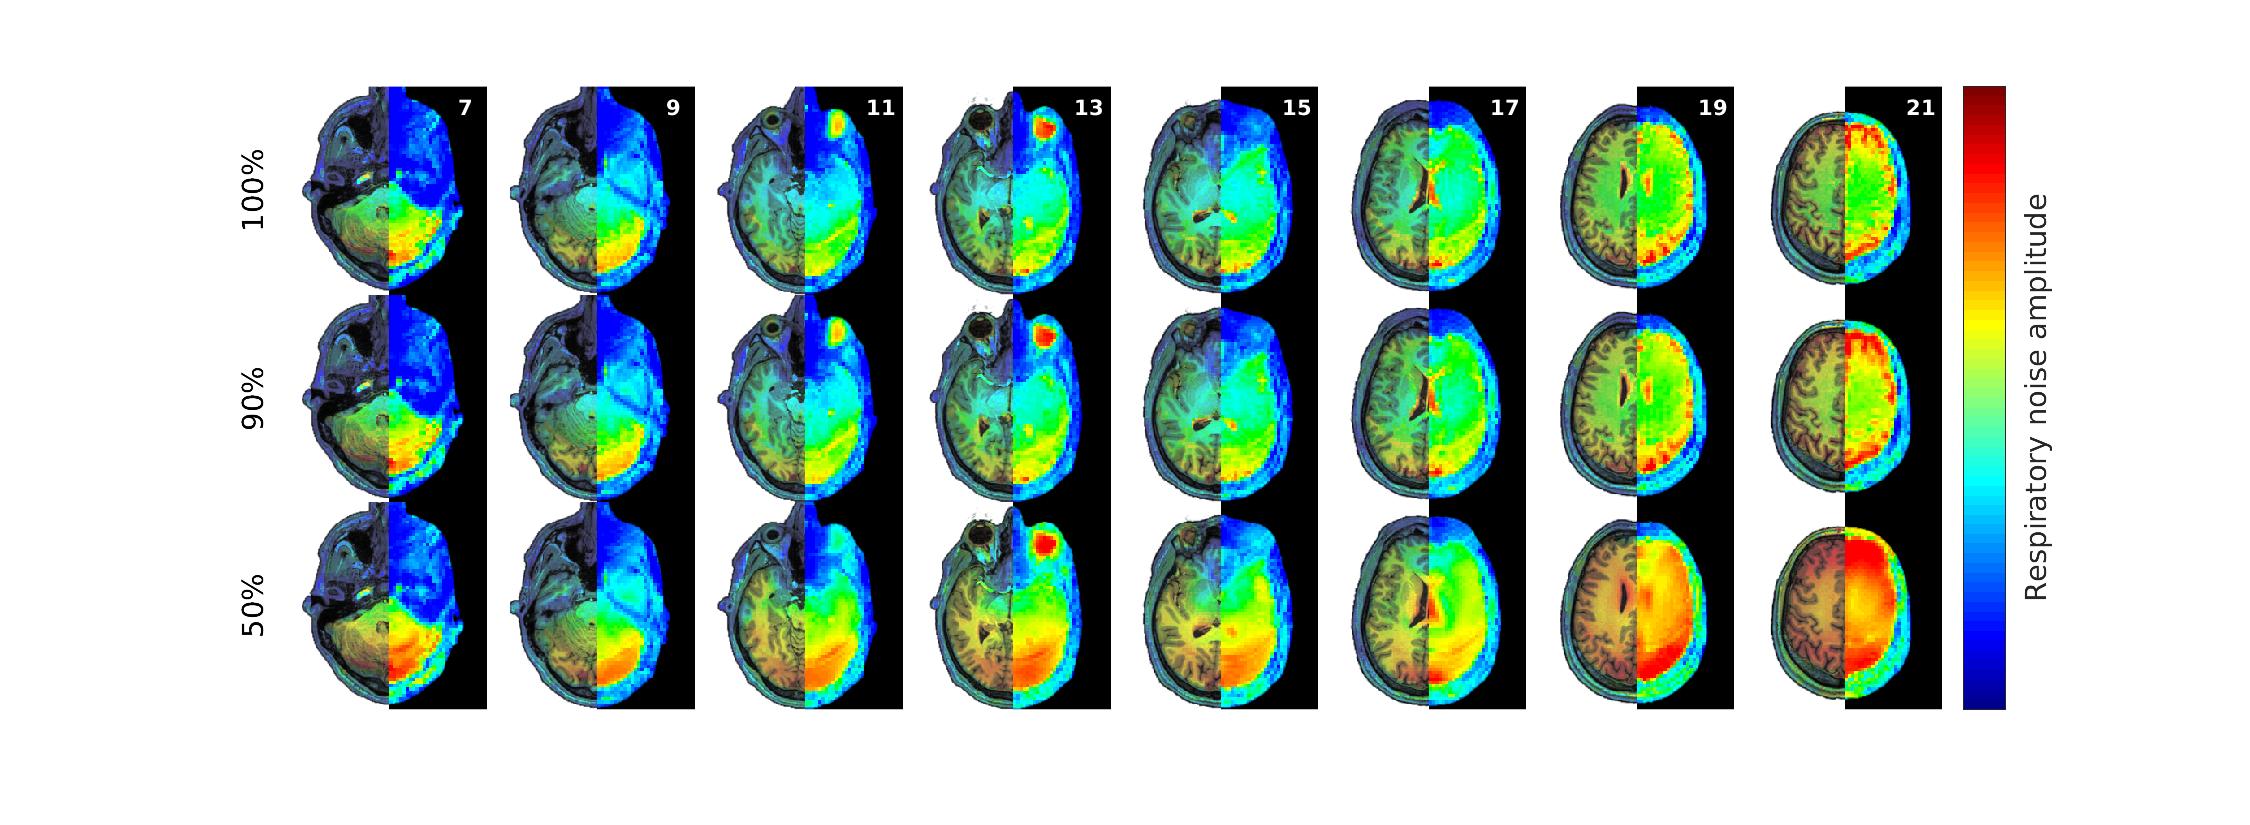
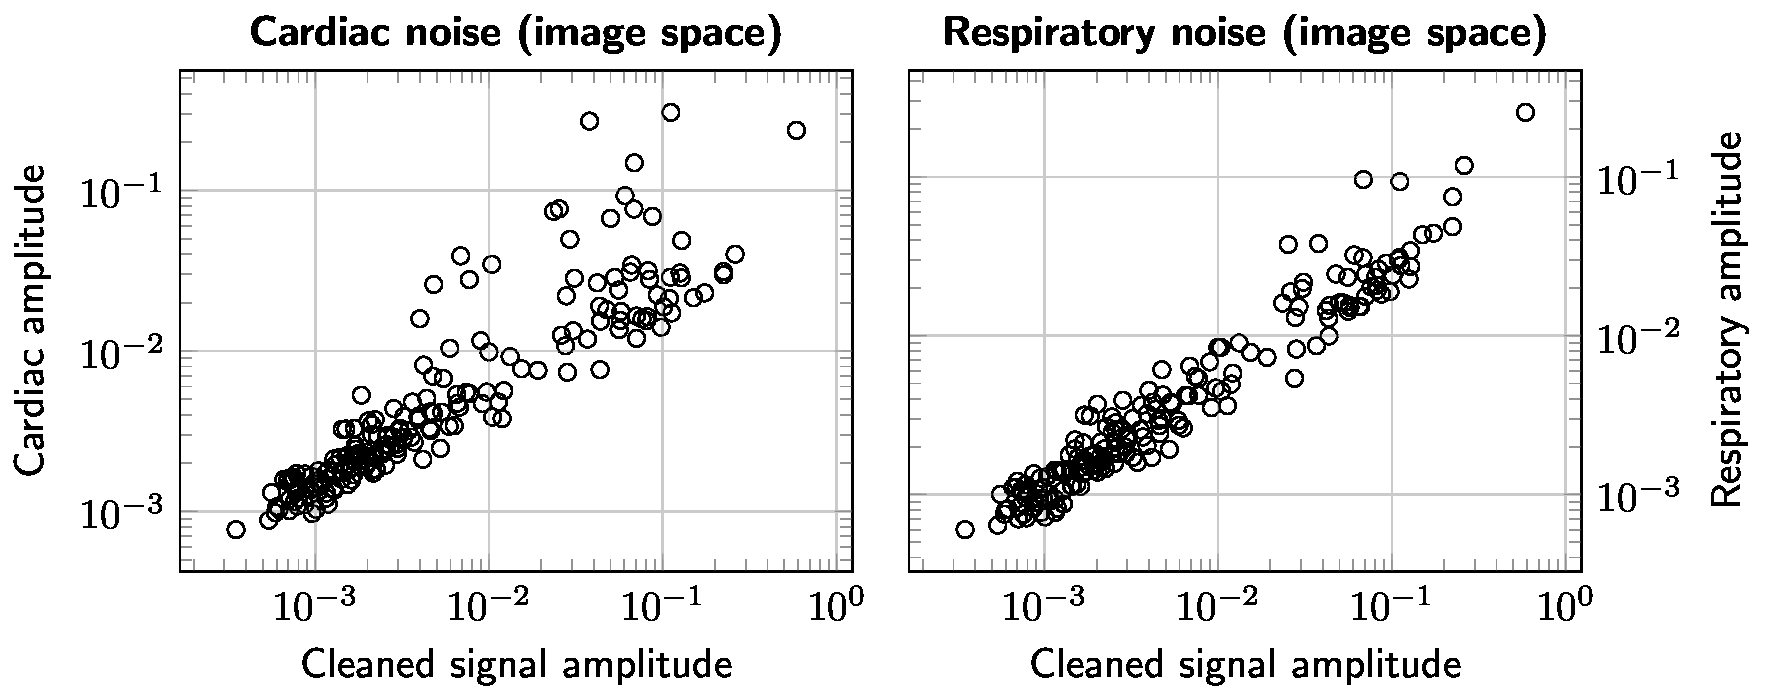
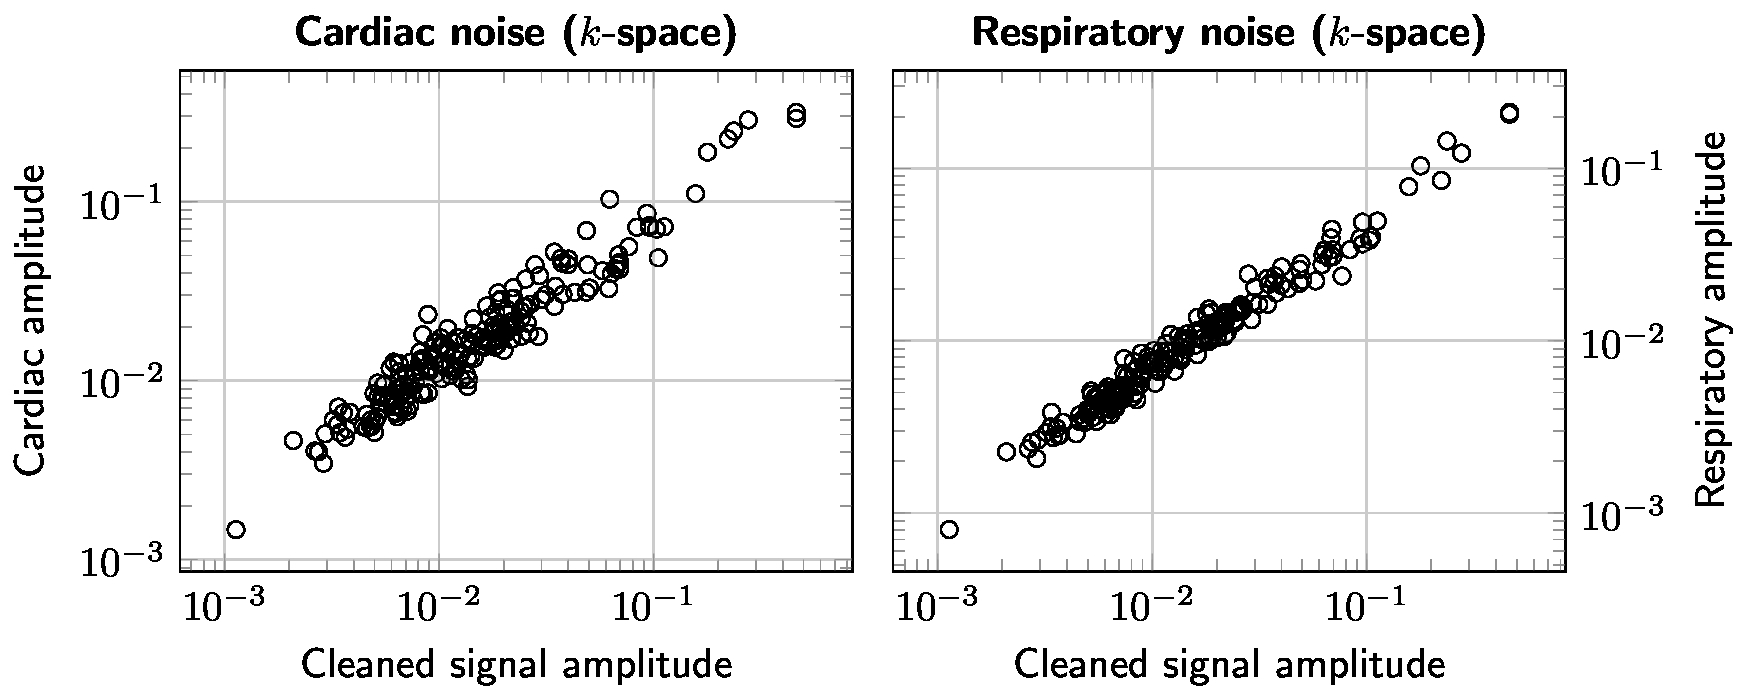
The results are summarized in Figures 1–5. Figure 1 is instrumental and shows amplitude maps of the physiological noises in $$$k$$$-space for two selected slices. Figures 2 and 3 display how processing fewer spatial frequencies affects the reconstructed image space noise estimates. With 90% coverage there is little degradation but if half of the energy is discarded the estimates become markedly more blurred. Figures 4 and 5 demonstrate that there is, as has been suggested1, a linear relationship between cleaned signal and physiological noise magnituges.Discussion
The results reveal that the physiological noise is heavily concentrated to low spatial frequencies and its distributions roughly coincides with that of the total signal. The number of spatial frequencies required to contain most of physiological noise energy decreases fast: in the case of covering 90% of energy the numbers of spatial frequencies required were (the total number is 8192) 5212, 5115, 3839, 3610, 3896, 3700, 3813 and 3086 for the slices in Figures 2 and 3. That is, around half of the frequencies can be discarded with little degradation of image space noise estimates. These findings support the goal of reducing the computational cost by only considering a subset of the frequencies.Conclusions
We have presented how physiological noise in fMRI is structured in the $$$k$$$-space and shown that DRIFTER algorithm (available for download7) can be applied to only a subset of spatial frequencies with little degradation of the noise estimates and that this approach can considerably improve the practical computational efficiency of physiological noise removal in fMRI.Acknowledgements
This work was supported by the Academy of Finland projects 266940 and 298131 as well as Aalto ELEC Doctoral School.References
1. Krüger G, Glover GH. Physiological noise in oxygenation-sensitive magnetic resonance imaging. Magn. Reson. Med. 2001;46(4):631–637.
2. Triantafyllou C, Hoge RD, Krueger G, et al. Comparison of physiological noise at 1.5 T, 3 T and 7 T and optimization of fMRI acquisition parameters. NeuroImage. 2005;26(1):243–250.
3. Särkkä S, Solin A, Nummenmaa A, et al. Dynamic retrospective filtering of physiological noise in BOLD fMRI: DRIFTER. NeuroImage. 2012;60(2):1517–1527.
4. Glover GH, Li T-Q, Ress D. Image-based method for retrospective correction of physiological motion effects in fMRI: RETROICOR. Magn. Reson. Med. 2000;44(1):162–167.
5. Solin A, Särkkä S, Nummenmaa A, et al. Catching physiological noise: comparison of DRIFTER in image and $$$k$$$-space. Proc. Intl. Soc. Mag. Reson. Med. 2014;22:3068.
6. Beatty PJ, Nishimura DG, Pauly JM. Rapid gridding reconstruction with a minimal oversampling ratio. IEEE Trans. Med. Imaging. 2005;24(6):799–808.
7. DRIFTER TOOLBOX: An SPM toolbox for removing periodic noise in fMRI data. http://becs.aalto.fi/en/research/bayes/drifter/. Accessed November 4, 2016.
Figures