5293
Differential changes in functional connectivity of fronto-striatal and motor-striatal circuits in early and premanifest Huntington’s Disease measured by ultra-high field (7T) resting state BOLD fMRI1Dept. of Radiology, Johns Hopkins University School of Medicine, Baltimore, MD, United States, 2F.M. Kirby Research Center for Functional Brain Imaging, Kennedy Krieger Institute, Baltimore, MD, United States, 3Department of Neurology, Johns Hopkins University School of Medicine, Baltimore, MD, United States, 4Department of Psychiatry and Behavioral Sciences, Johns Hopkins University School of Medicine, Baltimore, MD, United States, 5Department of Neuroscience and Pharmacology, Johns Hopkins University School of Medicine, Baltimore, MD, United States
Synopsis
Huntington’s disease (HD) is a neurodegenerative disorder characterized by motor, cognitive and behavioral deficits. The striatum is one of the first brain regions that show detectable atrophy in HD. Reduced functional connectivity between striatum and motor cortex has been reported. Here, we report decreased motor-striatal connectivity but increased
PURPOSE
Huntington’s disease (HD) is a progressive neurodegenerative disorder caused by a CAG expansion in the Huntingtin gene1. The clinical diagnosis of manifest HD is made on the basis of motor deficits2,3. The natural history of HD can be divided into premanifest and manifest periods. The approximate time-to-onset can be predicted from the length of CAG repeats in patients. The striatum is an important subcortical structure that is associated with motor planning and multiple aspects of cognition. Striatal atrophy is a hallmark of structural changes in HD brains. Impaired functional connectivity between striatum and motor cortex has been reported by us4 and many other groups5-9. Here, we investigated possible occurrence of changes in functional connectivity between striatum and cortical regions other than the motor cortex in HD. We used ultra-high field (7T) resting state BOLD fMRI to measure functional connectivity in early and premanifest HD patients and controls. We hypothesized that functional connectivity between striatum and different cortical regions may be affected differentially by HD pathology, which may imply a compensatory mechanism in the brain.METHODS
12 early manifest HD subjects, 10 premanifest HD subjects with <8 years before projected onset (estimated years-to-onset(YTO)10=4.2±3yr), 12 premanifest HD subjects with >8 years before projected onset (YTO=20±10yr), and 16 healthy controls were studied. Experiments were performed on a 7T Philips scanner. A resting state fMRI scan was performed with gradient-echo echo-planar-imaging (TR/TE/FA=2000/22ms/60º, voxel=2.5mm isotropic, 7 minutes). Anatomical images were acquired with MPRAGE (voxel=1mm isotropic). Data analysis was performed using a pipeline implemented for functional connectivity analysis in our group11. Seed-based analysis was conducted to compute whole brain connectivity maps (z-values) to the striatum. T-tests were performed to examine differential connectivity between HD patients and controls. Correlations between functional connectivity and genetic measures were calculated using multiple regression. Age, sex, brain atrophy and residual motion were all accounted for as covariates. Multiple comparisons were corrected with the false-discovery rate (adjusted P < 0.05). The IBASPM116 atlas (PickAtlas, WFU) was used to identify anatomical regions.RESULTS
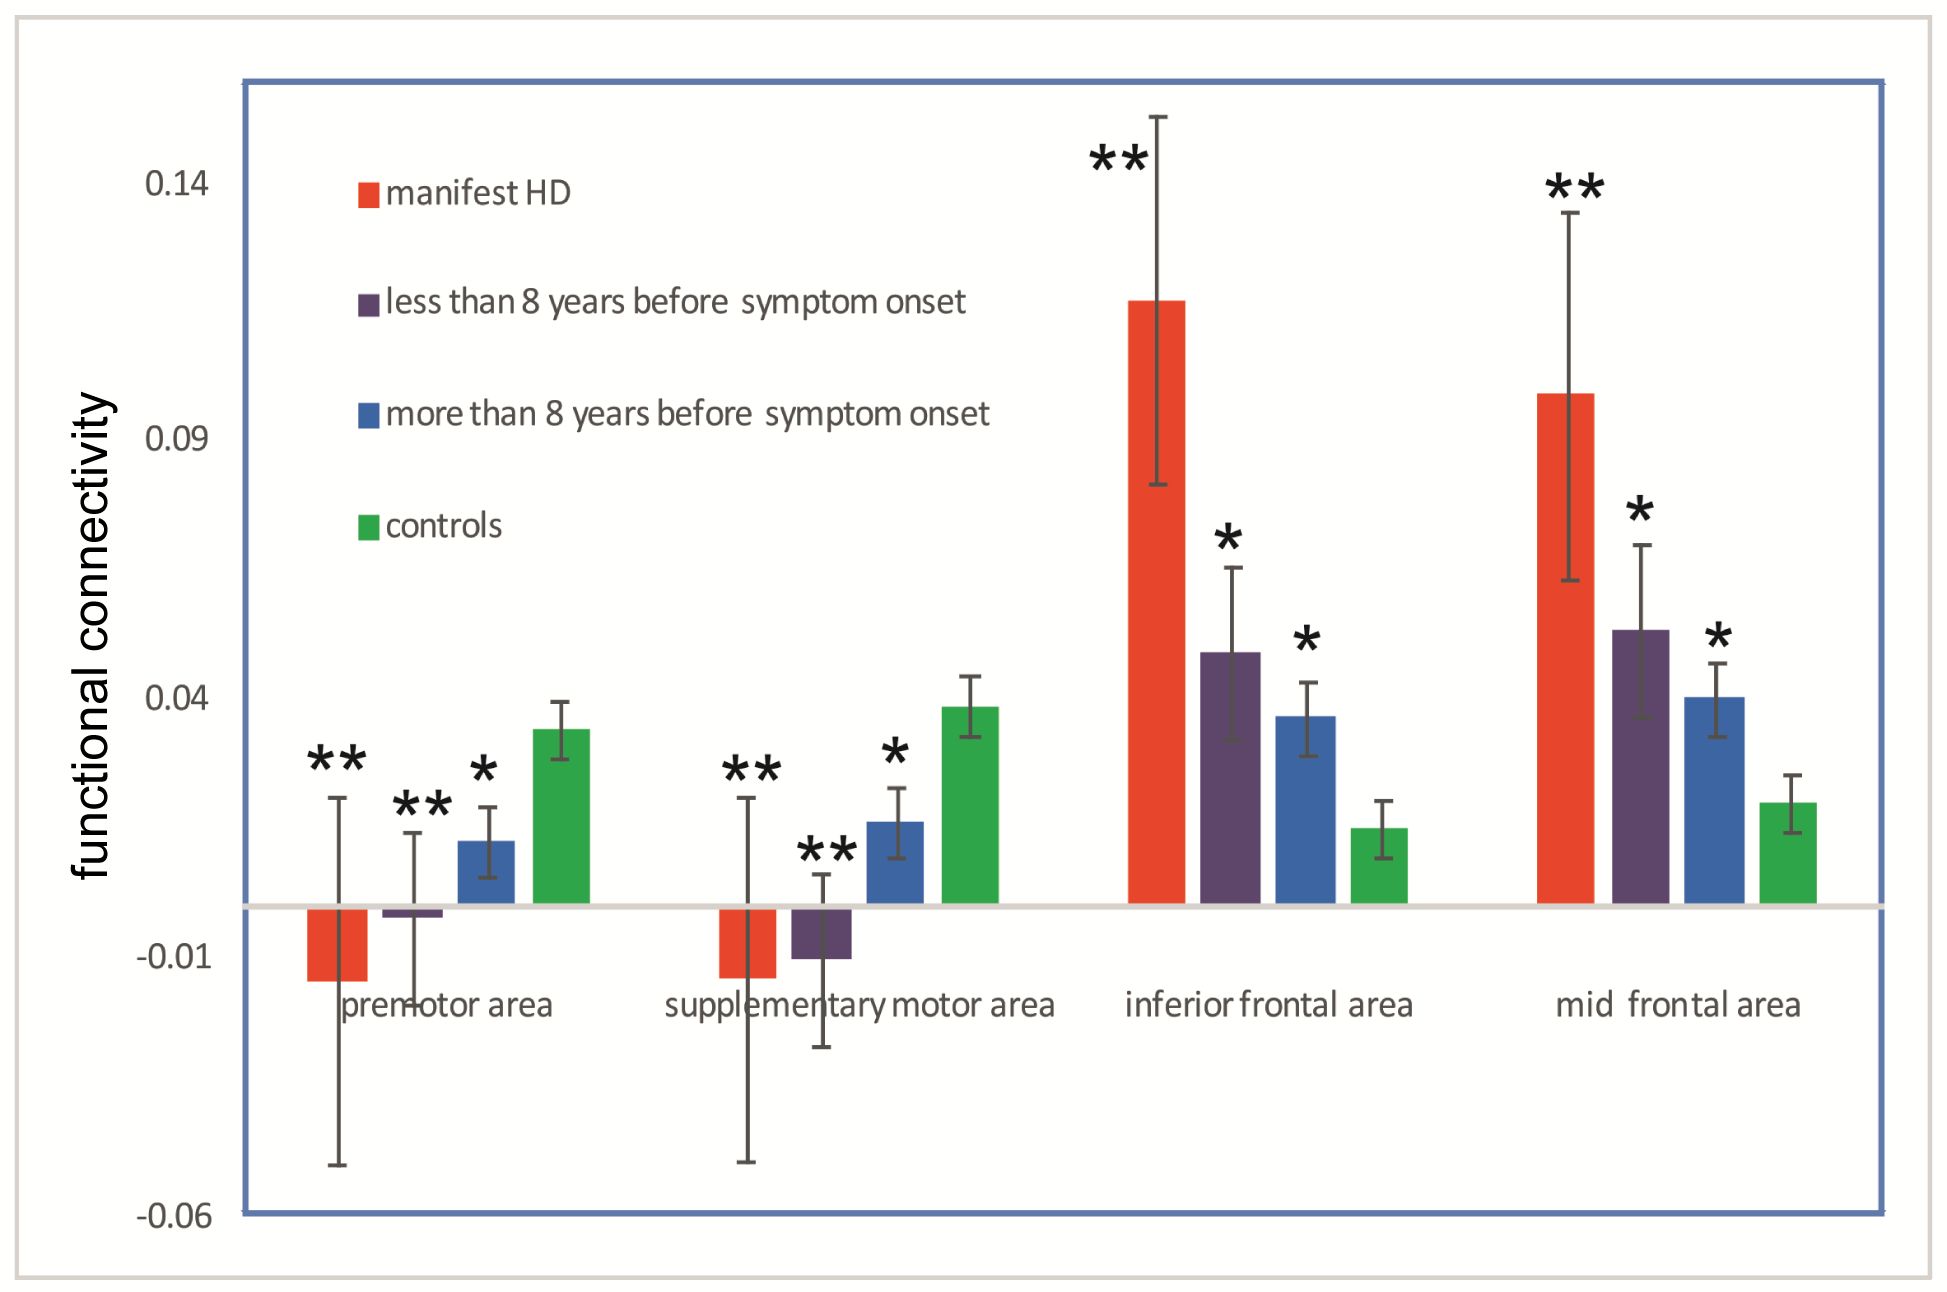
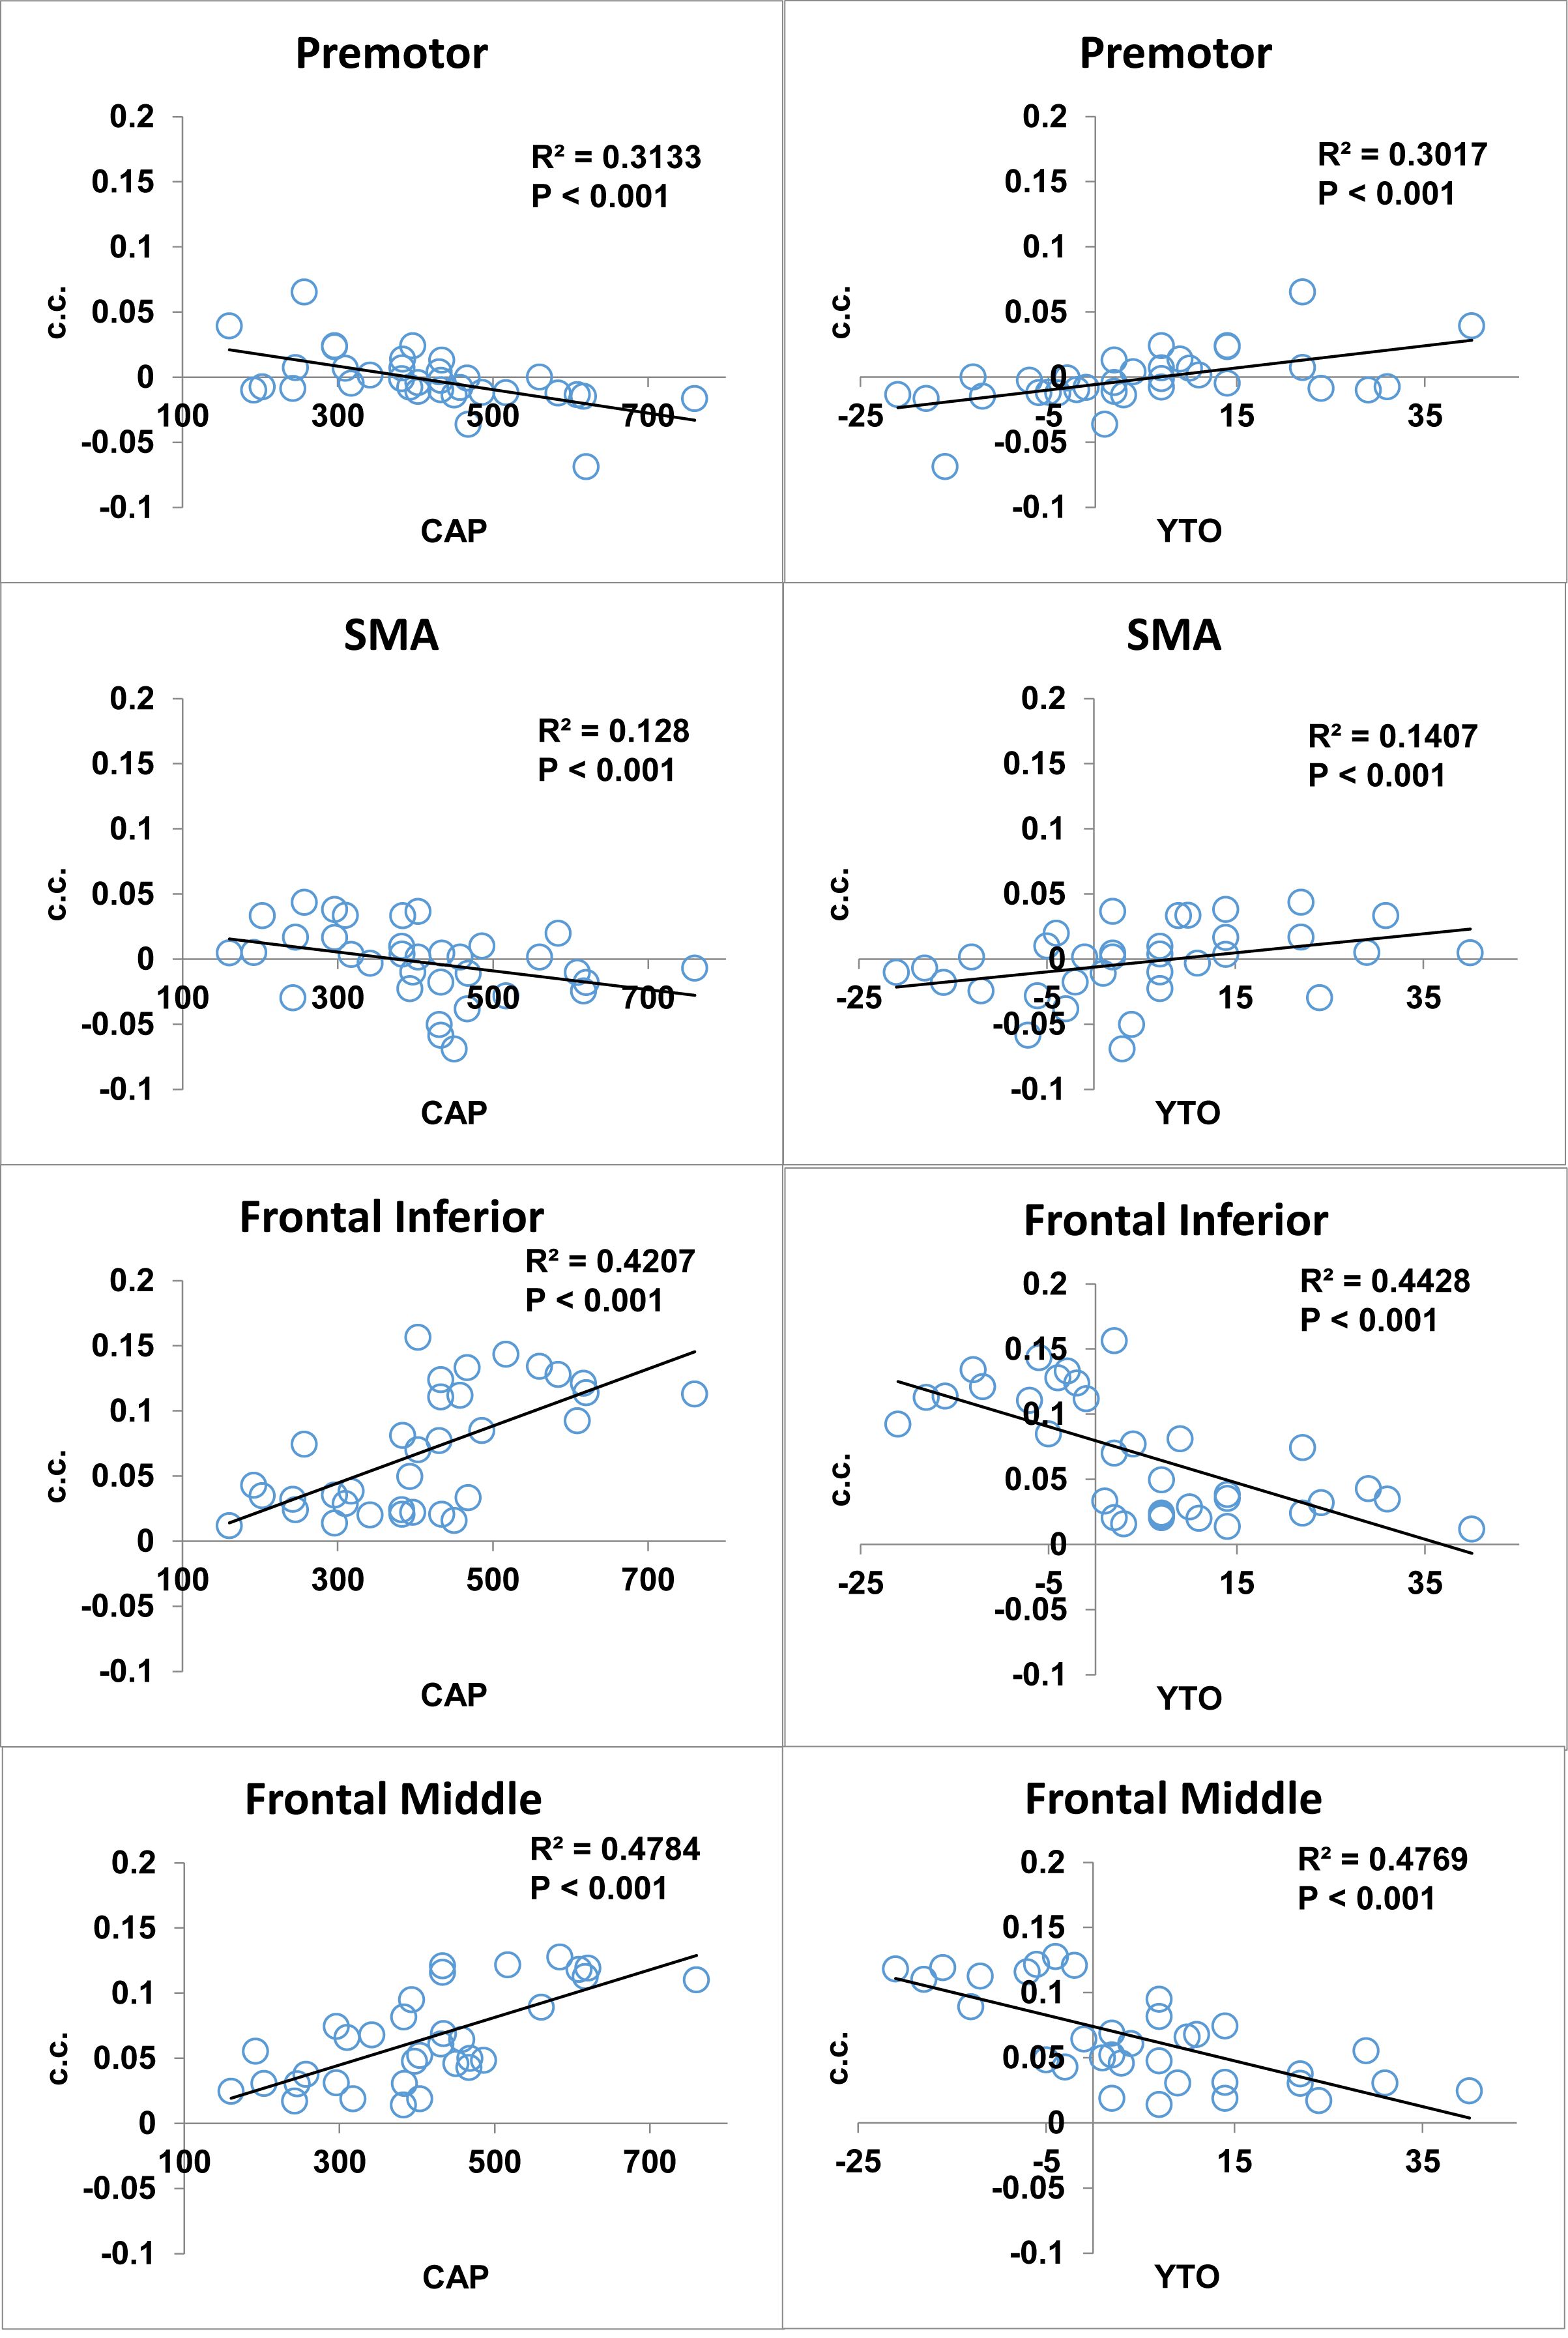
No substantial artifacts were observed on the fMRI images in all regions involved in the analysis. Reduced functional connectivity in all three HD groups compared to controls (Fig.1) was detected between striatum and motor regions in the brain, including the premotor and sensorimotor areas (SMA). Interestingly, we also found a significant increase of connectivity (Fig.1) between striatum and frontal regions, including inferior and middle frontal cortex in all three groups. The CAG-Age Product or “CAP-score” can be used to estimate the degree of genetic exposure to the HD mutation in patients12. Fig. 2 shows significant correlations between functional connectivity and CAP-score and YTO in all HD patients (n=34). In line with the group comparison results, functional connectivity between the striatum and motor regions showed negative correlation with genetic exposure, whereas fronto-striatal functional connectivity showed the opposite.DISCUSSION & CONCLUSION
The reduction in functional connectivity of the motor-striatal circuit in HD patients is consistent with previous studies at 3T and lower fields4-9. We speculate that the enhanced functional connectivity of the fronto-striatal circuit in HD may imply a compensatory mechanism, in which cortical regions other than motor areas are recruited to subserve functions that have been impaired due to pathological changes in HD13. The correlations between functional connectivity and genetic measures (CAP and YTO) suggest its potential value as a biomarker for tracking disease progression in HD.Acknowledgements
Funding through the Huntington’s Society of America (HDSA) and the Dana Foundation, NCRR NIBIB P41 RR15241.References
1. Group, T.H.s.D.C.R. A novel gene containing a trinucleotide repeat that is expanded and unstable on Huntington's disease chromosomes. Cell 72, 971-983 (1993).
2. Ross, C.A., et al. Huntington disease: natural history, biomarkers and prospects for therapeutics. Nat Rev Neurol 10, 204-216 (2014).
3. Reilmann, R., Leavitt, B.R. & Ross, C.A. Diagnostic criteria for Huntington's disease based on natural history. Mov Disord 29, 1335-1341 (2014).
4. Unschuld, P.G., et al. Impaired cortico-striatal functional connectivity in prodromal Huntington's Disease. Neurosci Lett 514, 204-209 (2012).
5. Werner, C.J., et al. Altered resting-state connectivity in Huntington's disease. Hum Brain Mapp 35, 2582-2593 (2014).
6. Poudel, G.R., et al. Functional changes during working memory in Huntington's disease: 30-month longitudinal data from the IMAGE-HD study. Brain structure & function (2013).
7. Seibert, T.M., Majid, D.S., Aron, A.R., Corey-Bloom, J. & Brewer, J.B. Stability of resting fMRI interregional correlations analyzed in subject-native space: a one-year longitudinal study in healthy adults and premanifest Huntington's disease. Neuroimage 59, 2452-2463 (2012).
8. Odish, O.F., et al. Longitudinal resting state fMRI analysis in healthy controls and premanifest Huntington's disease gene carriers: A three-year follow-up study. Hum Brain Mapp (2014).
9. Dumas, E.M., et al. Reduced functional brain connectivity prior to and after disease onset in Huntington's disease. NeuroImage. Clinical 2, 377-384 (2013).
10.Langbehn, D.R., Brinkman, R.R., Falush, D., Paulsen, J.S. & Hayden, M.R. A new model for prediction of the age of onset and penetrance for Huntington's disease based on CAG length. Clin Genet 65, 267-277 (2004).
11.Choe, A.S., et al. Reproducibility and Temporal Structure in Weekly Resting-State fMRI over a Period of 3.5 Years. PLoS One 10, e0140134 (2015).
12.Zhang, Y., et al. Indexing disease progression at study entry with individuals at-risk for Huntington disease. Am J Med Genet B Neuropsychiatr Genet 156B, 751-763 (2011).
13.Paulsen, J.S. Functional imaging in Huntington's disease. Exp Neurol 216, 272-277 (2009).
Figures