5292
Effects of motor dysfunction on functional connectivity and network topology in Parkinson’s disease1Cleveland Clinic Lou Ruvo Center for Brain Health, Las Vegas, NV, United States, 2University of Colorado Boulder, Boulder, CO, United States
Synopsis
The objective of this study was to use resting-state functional connectivity and graph theory to determine how the topology of the network is altered in PD with respect to severity of motor dysfunction. The current study revealed altered functional connectivity and topological properties of networks in PD with respect to severity of motor dysfunction. Our results point to a shift towards a less efficient network topology with altered integration and segregation in more motorically affected patients.
Introduction
Parkinson's disease (PD) is a progressive movement disorder of the central nervous system, which is characterized by altered motor (akinesia, tremors, etc), and non-motor aspects (olfactory, sleep, etc) of functioning. Several studies have reported altered topology of brain function in patients with PD1,2. How the severity (in terms of motor dysfunction) of the disease modulates the functional topological organization of the brain, however, remains poorly understood. The objective of this study was to use resting-state functional connectivity and graph theory to determine how the topology of the network is altered in PD with respect to severity of motor dysfunction.Methods
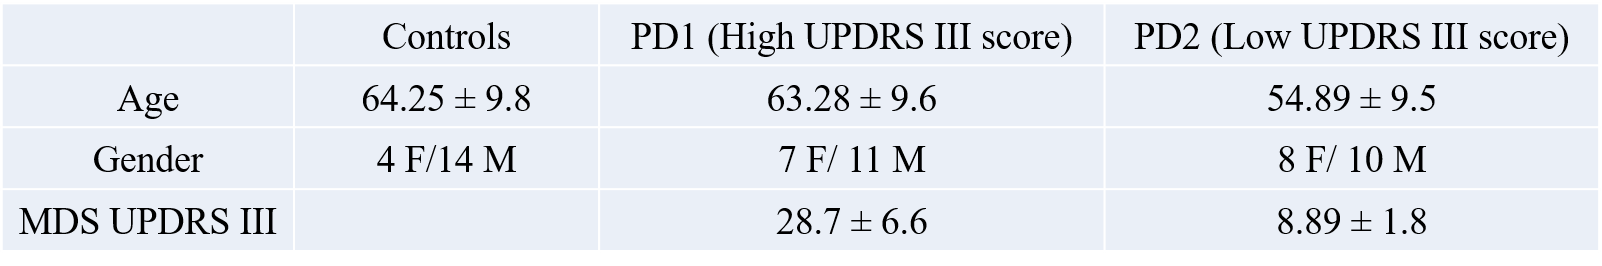
The data used in the preparation of this article were obtained from the Parkinson’s Progression Markers Initiative (PPMI) database (www.ppmi-info.org/data). For up-to-date information on the study, visit www.ppmi-info.org. Functional-MRI data for 18 healthy controls and two groups of 18 PD-subjects (PD1 and PD2) were obtained from the PPMI database (see Table 1 for demographics). The two PD groups differed in disease severity (in terms of motor dysfunction; PD1 high MDS UPDRS III score ; PD2 low MDS UPDRS III score) as determined by MDS-UPDRS III scores. Imaging parameters are described in detail at http://www.ppmi-info.org/. After standard preprocessing, mean time series were obtained from 90 ROIs based on the AAL atlas (excluding cerebellum and vermis). The connectivity between two ROIs was estimated using Pearson’s correlation between their averaged time-series, and subsequently a connectivity matrix (90 x 90) was obtained for each subject. Network-based statistic (NBS) was used to evaluate functional connectivity differences between the groups (Control vs PD1 & Control vs PD2). A linear regression between connectivity values and MDS UPDRS II scores was performed for paths significantly different between the groups, after controlling for age and gender. In addition, these connectivity matrices were used to study the topological properties of the brain functional networks. Graph theory measures were obtained using GRETNA toolbox3. Small worldness (γ), pathlength (Lp), clustering coefficient (Cp), Global (GE) and local efficiency (LE), were computed for each subject at various sparsity thresholds (S 0.05-0.4, ∆S=0.01). Two-sample t-tests were used to see if any of the above metrics were significantly different between the groups at all sparsity thresholds.Results
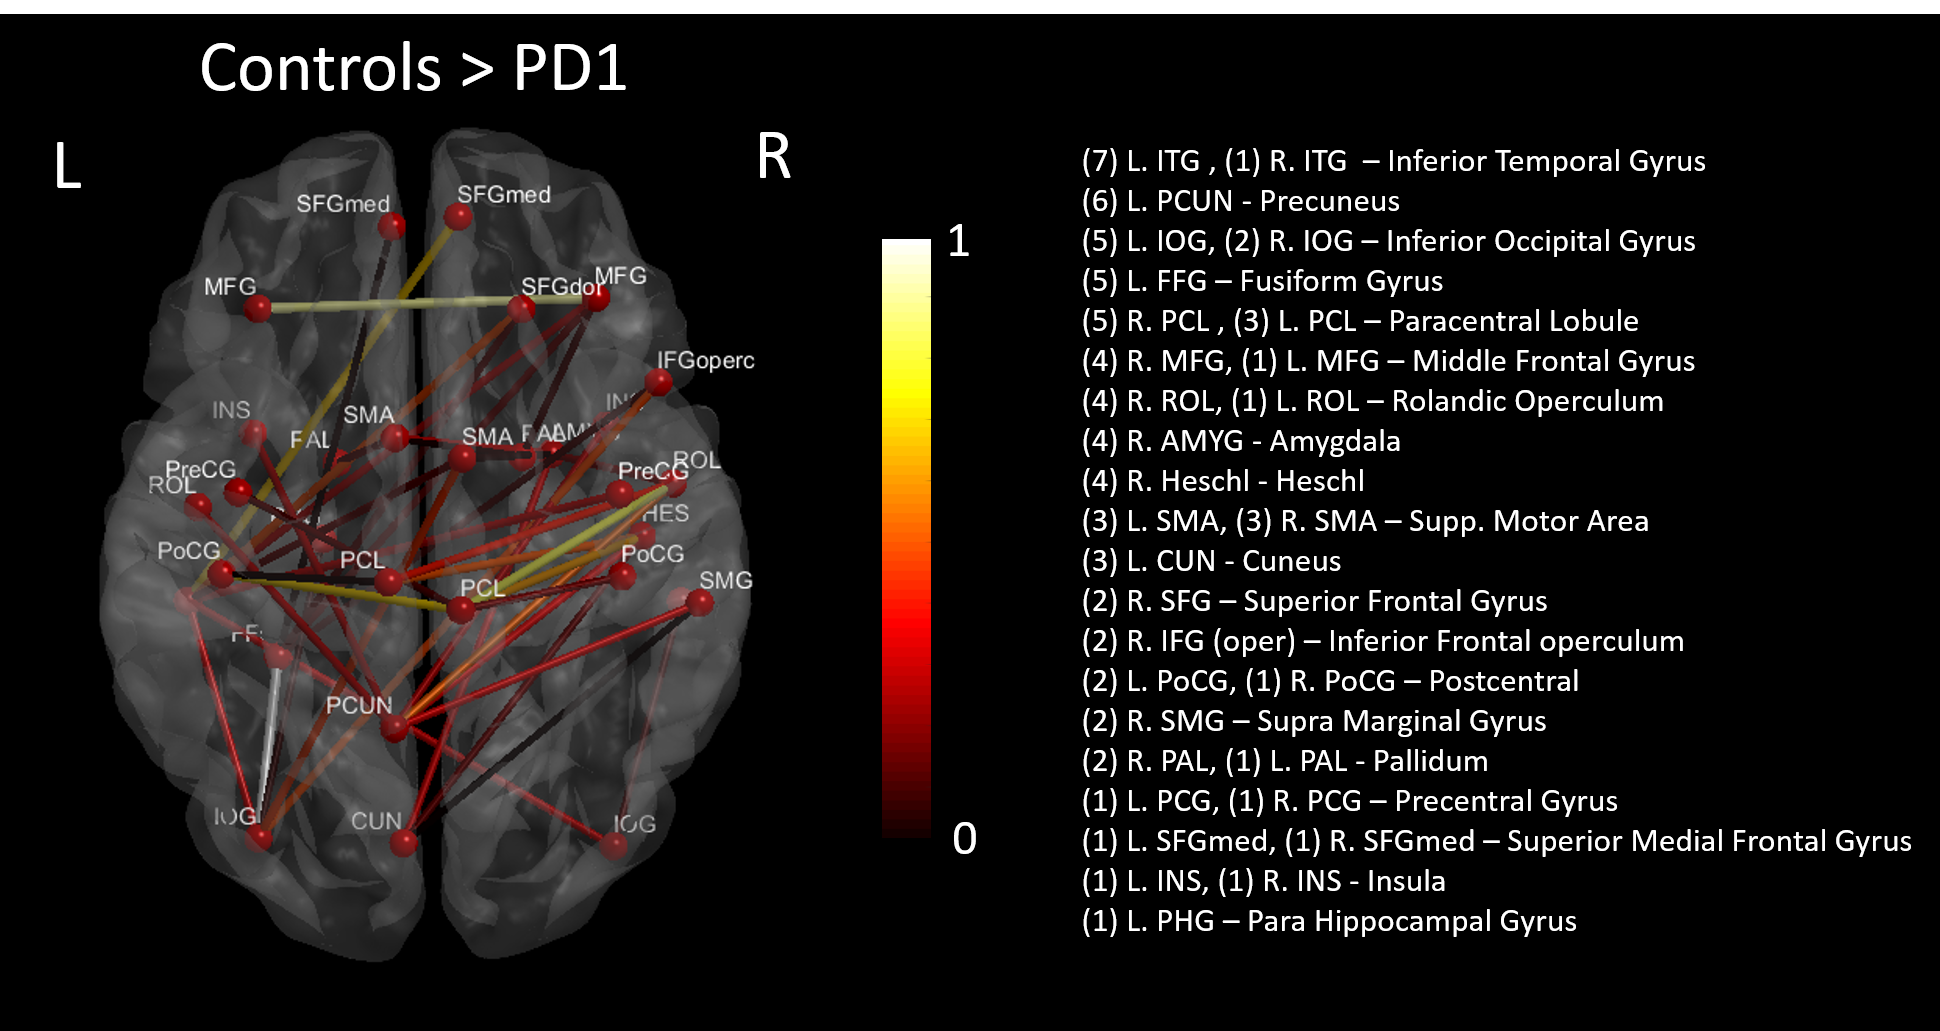
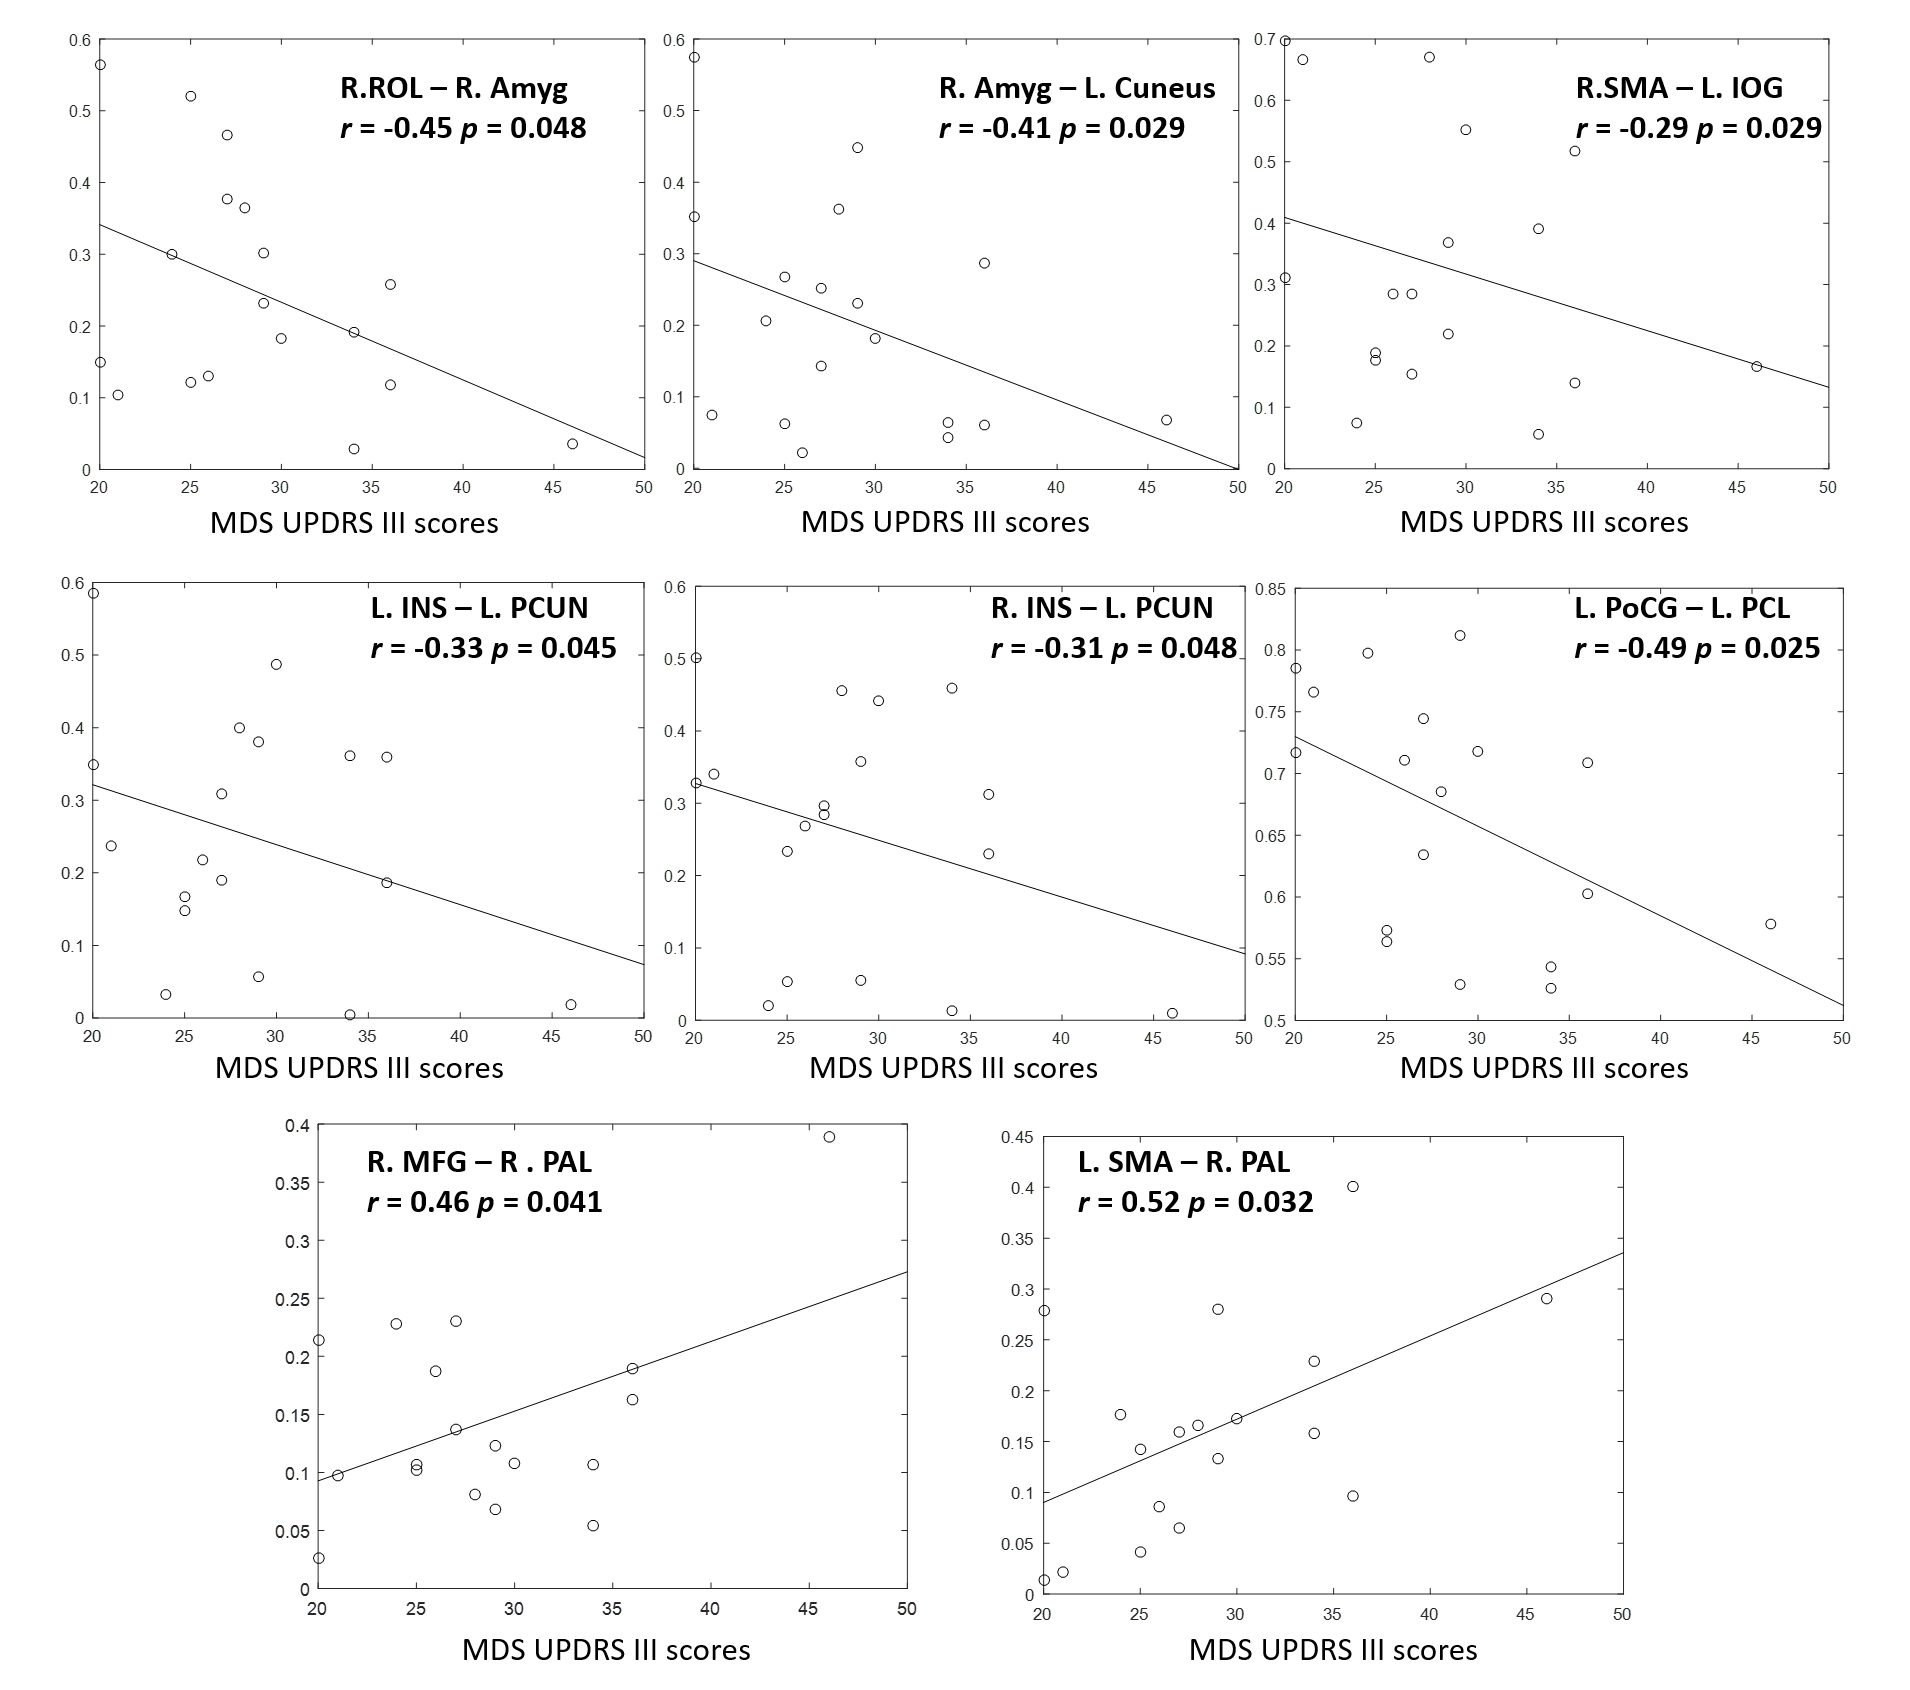
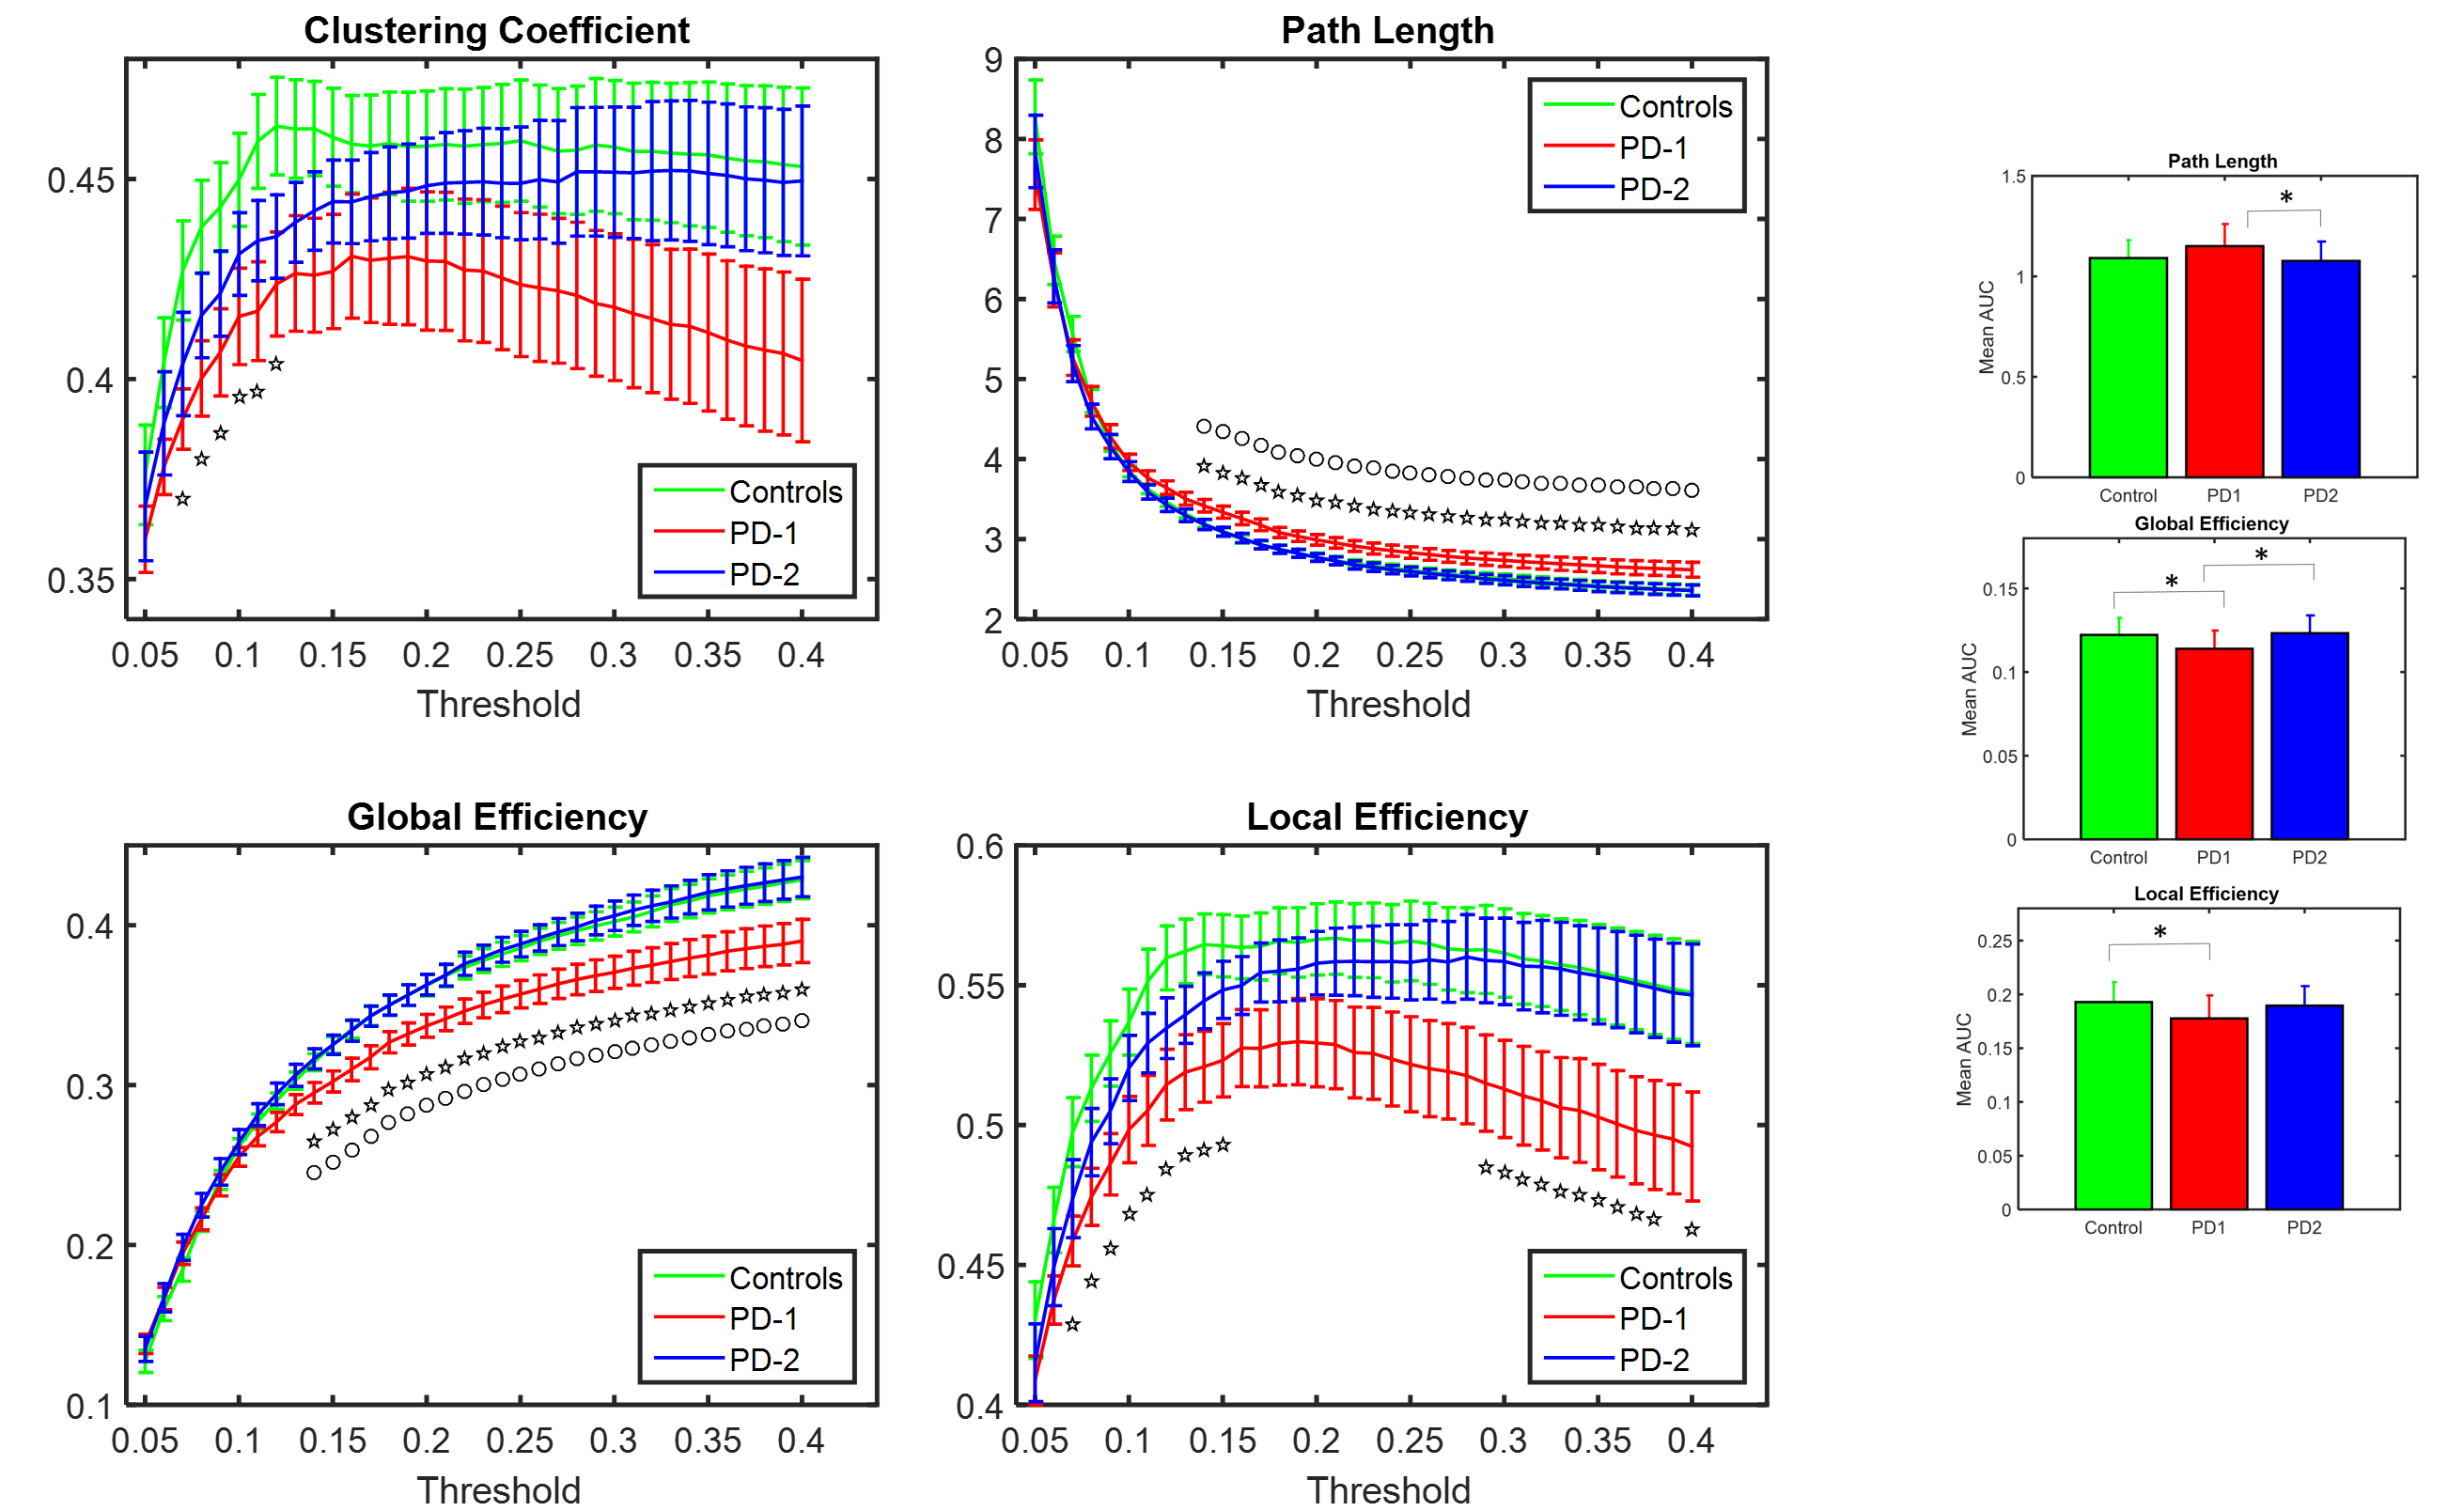
The NBS identified a set of 40 enhanced connections in control group comparing with PD1 (Fig. 1), primarily comprising the pallidum, supplementary motor area, precuneus, inferior temporal gyrus and few other regions. Results were visualized with the BrainNet Viewer (http://www.nitrc.org/projects/bnv/)4. Among these different connections, eight paths showed a significant (p<0.05) association with MDS UPDRS III scores (Fig. 2). No other group comparisons (PD1 > Control, Control > PD2 and Control < PD2) showed significant changes in connectivity. Fig. 3 shows the graph theory results. The functional connectivity networks corresponding to all three groups represented a clear small-world organization. But both γ and Cp did not show any significant differences for a defined range of sparsity (S) thresholds and also the integrated AUC values. However, the path lengths were significantly lower in controls and PD2 group when compared to the PD1 group at majority of the sparsity thresholds (0.15-0.4). The controls and PD2 had a significantly higher GE values at most sparsity thresholds (0.15 – 0.4) and the controls had a significantly higher local efficiency than PD1 group.Discussion
The current study revealed altered functional connectivity and topological properties of networks in PD with respect to severity of motor dysfunction. Our results show decreased functional connectivity in the PD1 group when compared to controls between regions known to be implicated in PD. No significant differences were found in functional connectivity between PD2 group and the controls, indicating that the severity of disease (motor dysfunction) is inversely related to functional connectivity. Furthermore, PD1 (high UPDRS III) group showed a) reduced GE and LE and increased Lp when compared to controls and b) lower GE and Lp compared to PD2 (low UPDRS III) group. These observations point to a shift towards a less efficient network topology with altered integration and segregation in more motorically affected patients.Conclusion
The functional connectivity and graph theoretical study in patients with PD revealed disrupted functional connectivity and network topology modulated by disease motoric severity. These findings are mainly important, given the fact that, looking at changes in functional networks related to different disease related factors may help us better understand the heterogeneity of PD.Acknowledgements
This study was partially supported by the NIH COBRE grant 1P20GM109025-01A1 and the Elaine P Wynn and Family Foundation. The Michael J. Fox Foundation supports the PPMI study for Parkinson’s Research. Other funding partners include a consortium of industry players, non-profit organizations and private individualsReferences
[1] Baggio, H.-C., Sala-Llonch, R., Segura, B., Marti, M.-J., Valldeoriola, F., Compta, Y., Tolosa, E. and Junqué, C. (2014), Functional brain networks and cognitive deficits in Parkinson's disease. Hum. Brain Mapp., 35: 4620–4634. doi:10.1002/hbm.22499
[2] Luo CY, Guo XY, Song W, Chen Q, Cao B, Yang J, Gong QY, Shang HF. (2015), Functional connectome assessed using graph theory in drug-naive Parkinson's disease. J. Neurol. 262(6):1557-67. doi: 10.1007/s00415-015-7750-3.
[3] Wang J, Wang X, Xia M, Liao X, Evans A and He Y (2015), GRETNA: a graph theoretical network analysis toolbox for imaging connectomics. Front. Hum. Neurosci., 30 June 2015 | http://dx.doi.org/10.3389/fnhum.2015.00386
[4] Xia M, Wang J, He Y (2013) BrainNet Viewer: A Network Visualization Tool for Human Brain Connectomics. PLoS ONE 8(7): e68910. doi:10.1371/journal.pone.0068910
Figures