5290
Contrary Effect of Stressful vs. Non-stressful Striped Patterns on Human Visual Cortical Functional Connectivity1Department of Radiology, Michigan State University, East Lansing, MI, United States, 2Department of Psychology, Michigan State University, East Lansing, MI
Synopsis
Areas across the visual cortex are functionally connected. A stressful striped pattern induces perceptual illusions/distortions and visual discomfort in most people, headaches in patients with migraine, and seizures in patients with photosensitive epilepsy. In contrary, a non-stressful striped pattern does not induce such effects. This study found that a 25-min visual stimulation showed a significantly contrary effect of the stressful vs. non-stressful striped patterns on human visual cortical functional connectivity (FC). To the contrary of the strengthening effect of the stressful striped pattern on the FC, the non-stressful striped pattern showed a weakening effect on the FC.
Introduction
Resting-state (RS) functional connectivity (FC) MRI (rs-fcMRI) has been widely used to study functional connections between brain regions, and functionally connected areas across the visual cortex have been well recognized1,2. A stressful striped pattern with a spatial frequency (SF) of 2.8 cycles per degree (cpd) induces perceptual illusions/distortions and visual discomfort in most people, headaches in patients with migraine, and seizures in patients with photosensitive epilepsy3. In contrary, a non-stressful striped pattern with SF 0.27 cpd does not induce such effects. Our recent study revealed an enhancing effect of the stressful striped pattern on human visual FC4. In this study, we further investigate the effect of the non-stressful striped pattern on human visual FC.Methods and Materials
Twelve healthy subjects (7 male, ages from 22 to 56) participated in this study. The experimental conditions and tasks were identical as that in our previous study4 except that the stressful striped pattern was replaced with the non-stressful striped pattern. Each subject had four consecutive 12-min rs-fcMRI scans under four conditions: (1) eyes fixated on a fixation mark; (2) and (3) visual stimulation with alternating 2-sec stimulation on-and-off for 25 min; and (4) same as (1). The fMRI images were acquired on a GE 3T scanner with an 8-channel head coil (TR/TE=2500/28 ms, FOV=22 cm, Matrix=64x64, slice thickness=3 mm). Same as that in our previous study4, each subject also had a functional localizer scan that was used to determine putative V1 seeds for generating a seed time course. In RS analysis, after pre-processing RS time series in AFNI, the correlation between the seed time course and the time course of every voxel in the brain was calculated5-7. Both ROI and whole brain group analyses were conducted. Fisher Z transformation was applied to the R values before statistical analyses. For ROI analysis in native space, for each of the four RS conditions, two FC maps were computed at two levels of significance: (1) P=1.0x10⁻⁵ and (6) P=1.0x10⁻¹⁰. For each significance level, the four FC maps were first used to determine a joint ROI mask in the visual cortex across all the four RS conditions, and then the mask was used to obtain a ROI-mean R value for each RS condition. Then, for each of the two P values, the group-mean of the ROI-mean R values of the 12 subjects was computed and analyzed to investigate the non-stressful visual stimulation effect on the FC. To reduce inter-subject and inter-study variations, each ROI-mean R value of the four RS conditions was normalized by dividing it with the baseline ROI-mean R value for each subject, enabling a comparison of this study with our previous study4. In whole-brain group analyses, the correlation maps of all subjects were warped to the ICBM 452 template. Whole-brain ANOVAs were carried to compare the Z values between different RS conditions.Results and Discussion
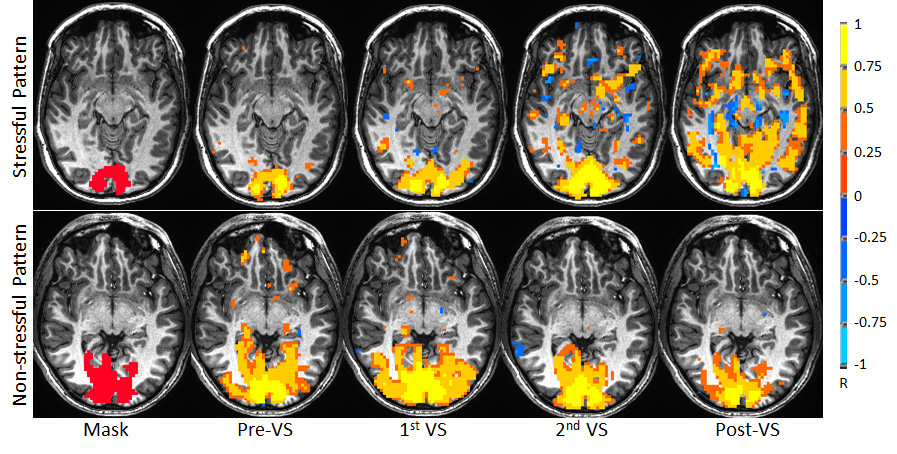
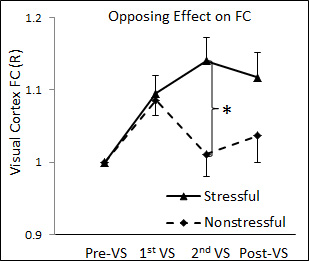
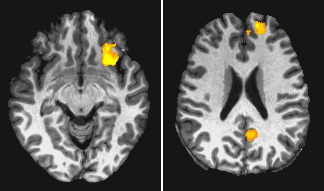
The contrary effect of the stressful vs. non-stressful striped patterns on the visual cortical FC is illustrated in Fig. 1. The size of the ROI mask in the visual cortex varied with the significance level, similar as that in our previous study4. The ROI analysis showed that the stimulation significantly increased the R value in comparison to the baseline R value during the first half of the 25-min stimulation (paired t-test, max P=0.0017) (Fig. 2), similarly as that in our previous study4. In contrary to the continued enhancement in the previous study, the R value was reduced back to the baseline R value during the second half of the 25-min stimulation, showing a significantly contrary effect between the stressful and non-stressful striped patterns (P=0.0091). After the cessation of the stimulation, the visual cortical FC showed a larger but not significant R value than that in the baseline (paired t-test, P=0.34). Besides within the visual cortex, our previous study4 found significantly enhanced connections between V1 and the other brain regions under the stressful stimulation (Fig. 3). In contrary, the whole-brain ANOVAs of this study did not find significant FC changes between pre-VS and post-VS under the non-stressful stimulation.Conclusion
The 25-min visual stimulation showed a significantly contrary effect of the stressful vs. non-stressful striped patterns on the FC within the visual cortex. There was a lasting effect even after the cessation of the stimulation under the stressful stimulation, both within and beyond the visual region, but not under the non-stressful stimulation. This suggests prolonged visual stimulation with stressful striped patterns may alter visual system FC network and its relationship with other networks.Acknowledgements
No acknowledgement found.References
1. Biswal B, et al. Functional connectivity in the motor cortex of resting human brain using echo-planar MRI. Magn Reson Med 34:537-541, 1995.
2. Yeo TBT, et al. The organization of the human cerebral cortex estimated by intrinsic functional connectivity. J Neurophysiol 106:1125-1165, 2011.
3. Wilkins AJ. Visual Stress. Oxford: Oxford University Press, 1995.
4. Huang J and Zhu D. Visual Stimulation Altered Human Visual Cortical Functional Connectivity. Proc. Intl. Soc. Mag. Reson. Med. 24, 1671, 2016.
5. Cox RW. AFNI: software for analysis and visualization of functional magnetic resonance neuroimages. Comput Biomed Res 29:162-173, 1996.
6. Fox MD, et al. The human brain is intrinsically organized into dynamic, anticorrelated functional networks. Proc Natl Acad Sci USA 102:9673-9678, 2005.
7. Zhu DC and Majumdar S. Integration of Resting-State FMRI and Diffusion-Weighted MRI Connectivity Analyses of the Human Brain: Limitations and Improvement. J Neuroimaging 24:176-186, 2014.
Figures