5288
Identify the neural basis of vascular dynamic network connectivity with high-field fMRI1High-field Magnetic Resonance, Max Planck Institute for Biological Cybernetics, Tuebingen, Germany, 2Graduate Training Centre of Neuroscience, International Max Planck Research School, University of Tuebingen, Tuebingen, Germany
Synopsis
The vascular dynamic network connectivity was detected with the resting-state fMRI in rodent and human brains (abstract: 3115). However, the basis of vascular dynamic connectivity is unclear. Here, the GCaMP6-mediated calcium signal simultaneously detected by fiber optics with fMRI showed slow-freuqncy fluctuation (0.01-0.04Hz) correlated to the single-vessel fMRI signal fluctuation with lead times from 1 to 5 seconds. In addition, the correlation was observed on the slow-frequency oscillation of the power profile of the spontaneous calcium burst spikes with frequency bandwidth of 1-10Hz. Thus, the vascular dynamic network connectivity demonstrates the hemodynamic state changes coupled to the brain state fluctuation.
Purpose
The vessel-specific connectivity patterns were detected for both resting-state and task-related fMRI mapping from rodents to humans (abstract ID: 3115). However, the basis of vascular dynamic connectivity is unclear. The slow-oscillation of the calcium signal from neurons were reported to be correlated to the deoxyhemoglobin oscillation detected with optical imaging1. Here, the calcium signal mediated by GCaMP6, which was simultaneously detected by fiber optics with fMRI2, was recorded to verify if vascular dynamic network connectivity is associated with neural activity. Both slow-frequency fluctuation of the calcium signal and the power spectral profile of the spontaneous calcium spikes were highly correlated with the single-vessel fMRI signal with slow-frequency oscillation from 0.01 to 0.04Hz. The vessel-specific correlation pattern with the slow-frequency calcium oscillation is dependent on the anesthesia levels with alpha-chloralose. In addition, the vessel-specific connectivity pattern could be observed in rats anesthetized with low-dose isoflurane (<1.2%), which showed slow-frequency oscillation up to 0.1Hz. This work suggests that the vascular dynamic connectivity could represent the large-scale brain functional dynamics in the cerebrovascular network.Methods
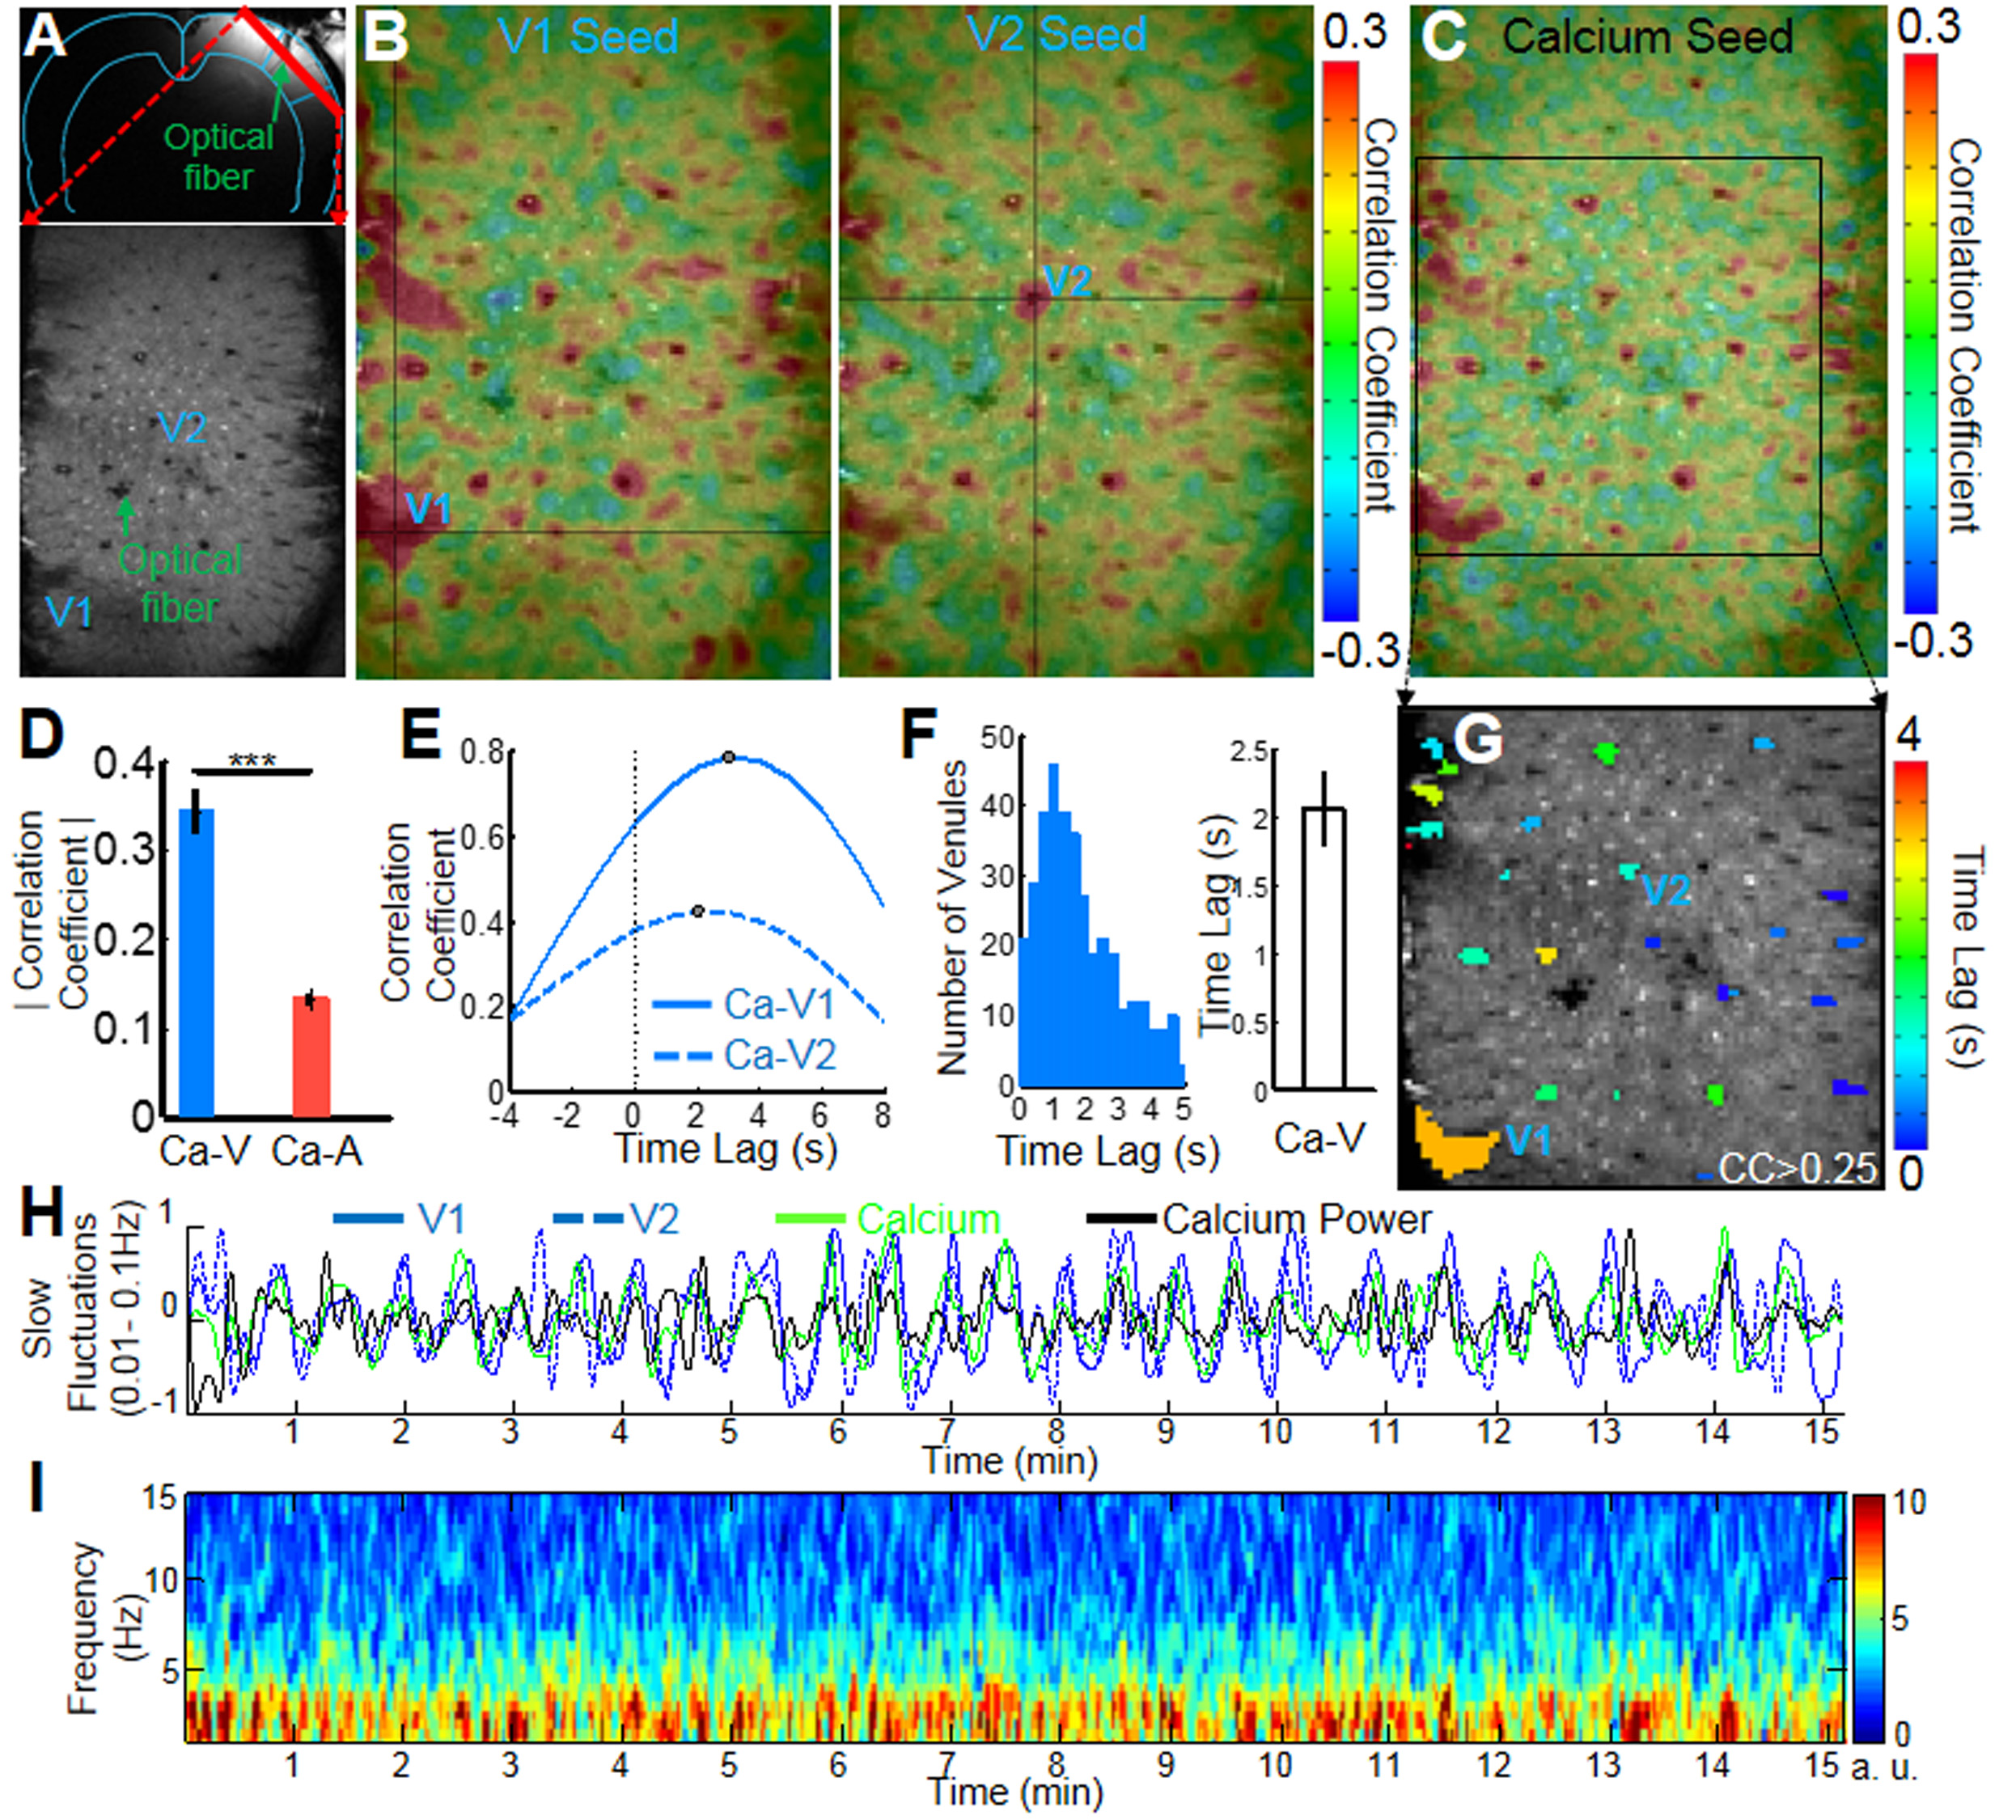
All images were acquired with a 14.1T Bruker scanner with a transreceiver surface coil(6mm diameter). The parameters of bSSFP were: TE: 3.9 ms; TR, 7.8 ms; flip angle (FA), 12° ; matric, 128x128; slice thickness, 400 μm; in-plane resolution, 100x100 μm, resulting in one slice repetition time of 1s. The duration of each trial for rs-fMRI was 15 minutes, and 1-3 trails of BOLD rs-fMRI were acquired for each rat. The setup for fiber-optic calcium recording was built up based on the previous study2. GCaMP6f3 was expressed by AAV5 in the FP somatosensory cortex or barrel cortex with Syn promoter (Upenn Vector Core). Fiber-optic (200um) was inserted into the area which expressed GCaMP for calcium-based fluorescent signal recording.Results
The calcium indicator(GCaMP6) was expressed in the neurons of the somatosensory cortex. An optical fiber was inserted to target the deep layer cortex to record the spontaneous calcium spikes and the slow-frequency oscillation of the calcium signal simultaneously with single-vessel SSFP-fMRI (Fig.1A). The slow-frequency calcium oscillation signal (0.01-0.1Hz, the green line in H) was used to correlate with the resting-state SSFP-fMRI signal, showing the correlation map (Fig. 1C) with similar patterns to the venule-seed based dynamic connectivity maps (Fig. 1B, the time course in H). And the correlation coefficient of the calcium slow oscillation with venules was significantly higher than with arterioles (n = 5 rats, paired t-test, ***, p= 0.0007) (Fig. 1D).
The cross-correlation analysis also detected the highest coefficients located at the venules voxels, showing calcium signal leading to the venule-specific fMRI signal with a mean lag-time approximately at 2s (Fig 1E-F). This calcium leading lag-time varied among penetrating vessels detected from 0.5 to 5 s, showing the surface vessels with the longest lag-time up to 3-5s (Fig 1F, G). The 5s lag-time detected from the large draining veins agrees with what has been reported by the simultaneous calcium imaging and hemoglobin-based intrinsic optical signal detection from the cortical surface1.
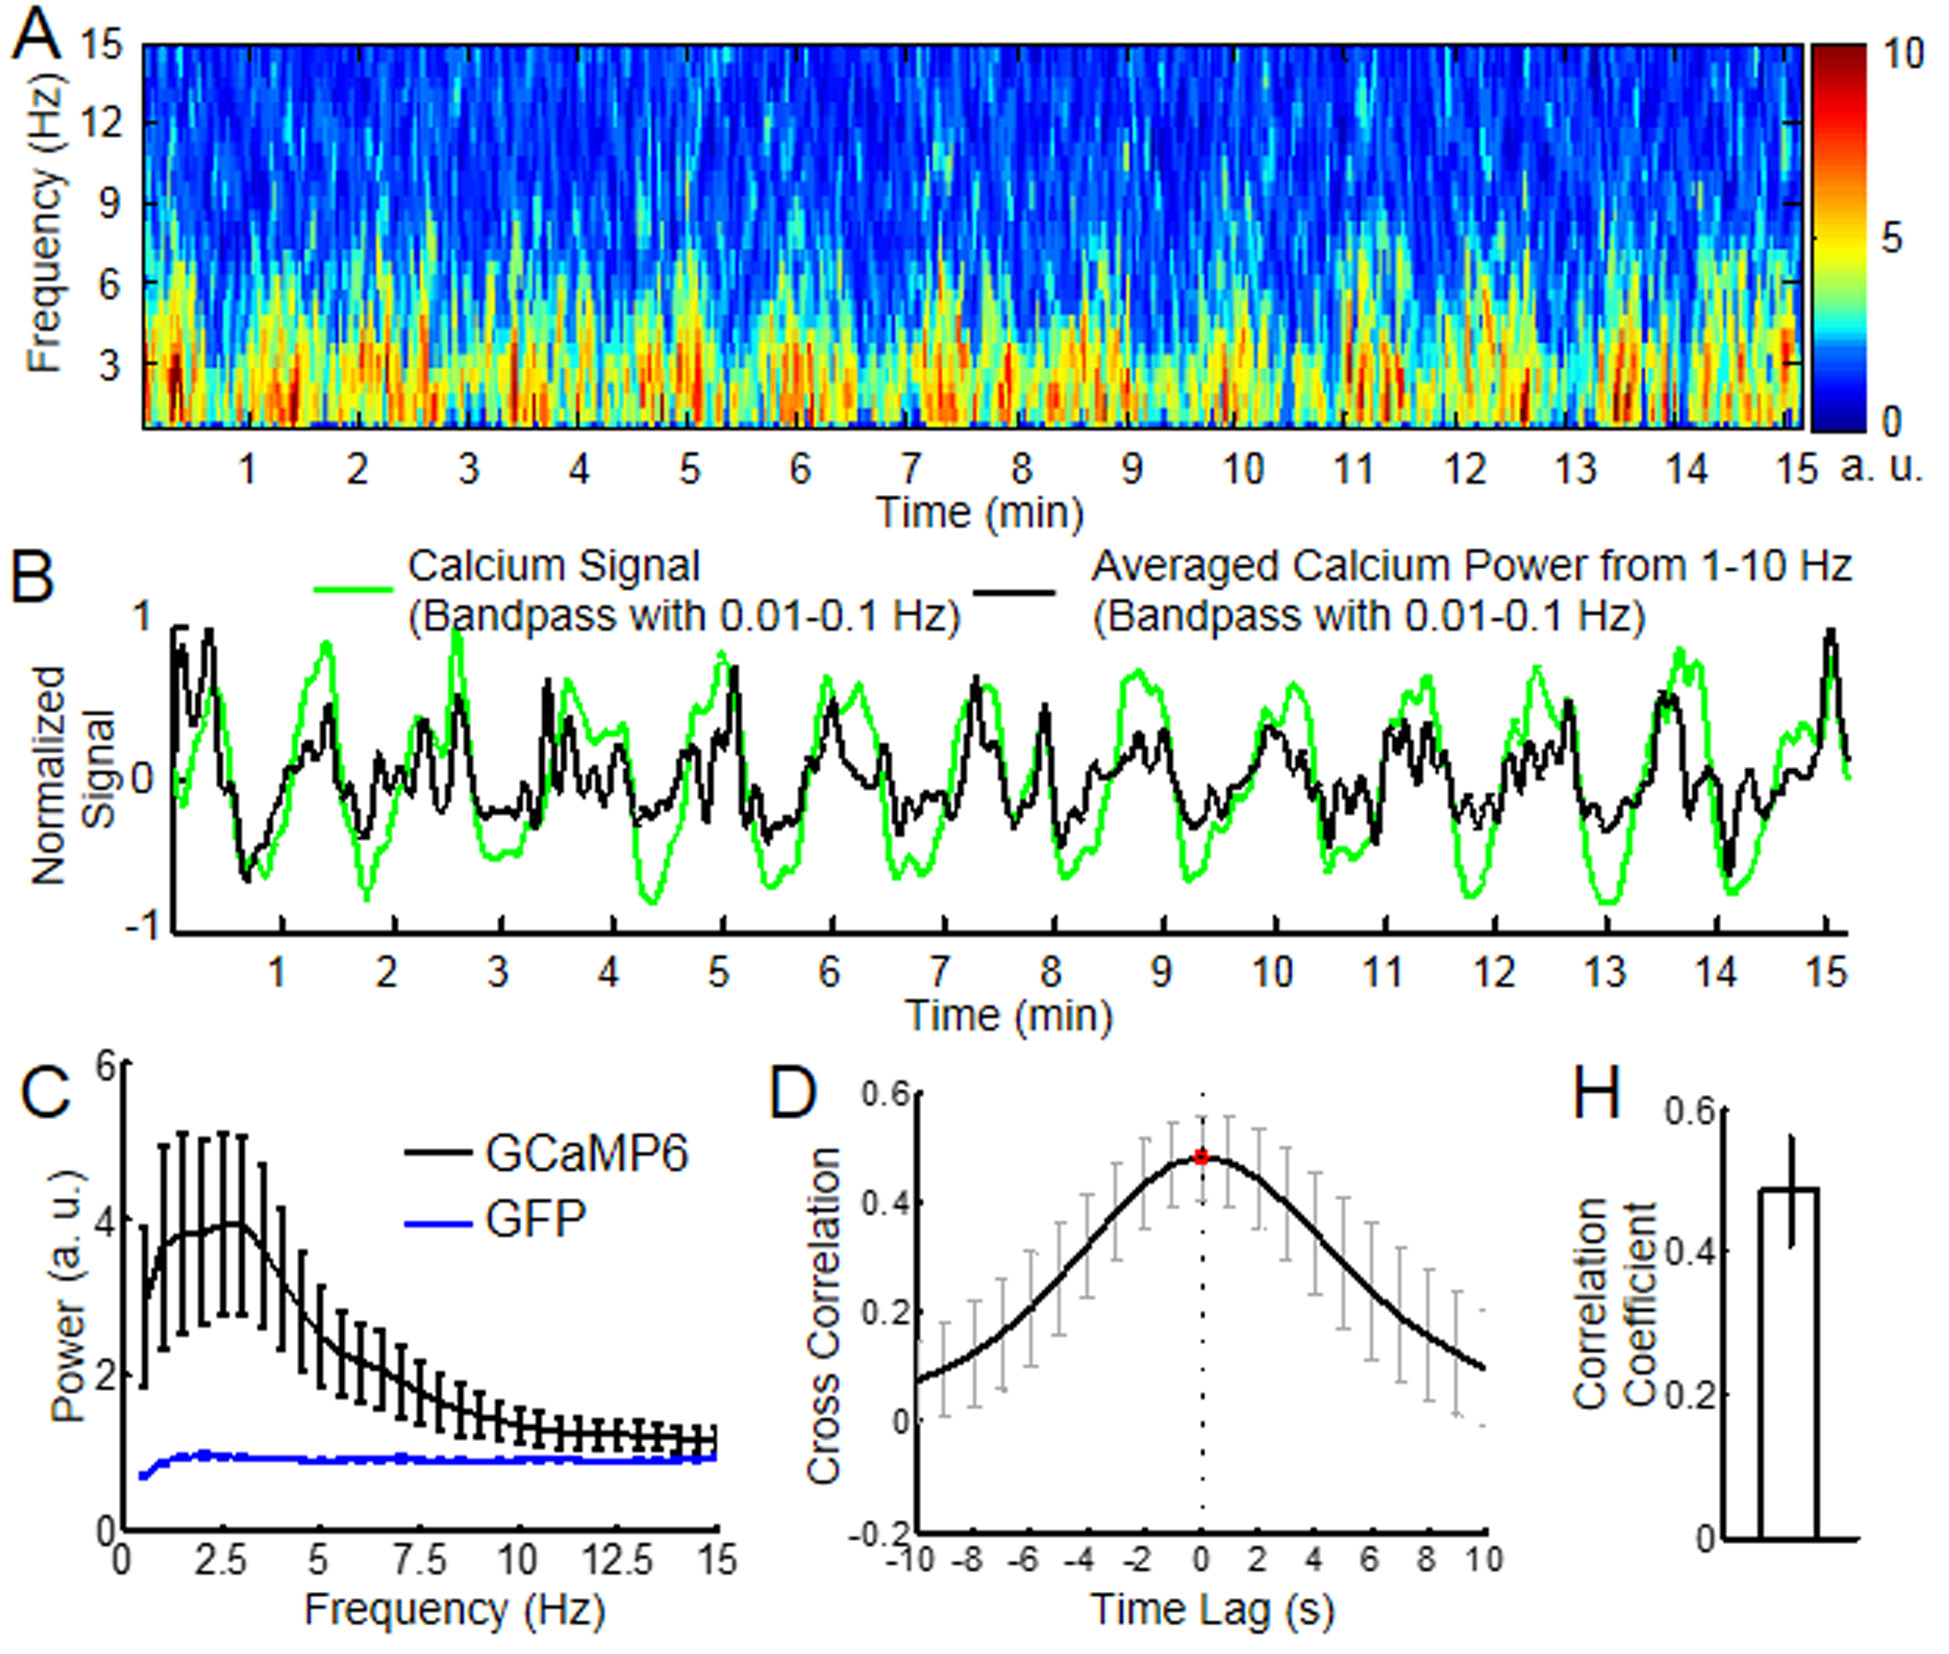
Besides the slow-frequency oscillation of the calcium signal, the power spectrogram of the spontaneous calcium spikes was analyzed as the function of time (Fig. 2). In contrast to the control rats expressing GFP in the cortex, the power spectral density map of the spontaneous calcium spikes showed strong slow-frequency components up to 10Hz (Fig. 2C). In addition, the temporal profile of the spontaneous calcium spike power from the spectrogram (1-10Hz) was highly correlated with the slow-frequency oscillation (0.01-0.1Hz) profile of the calcium signal, as well as the venule-specific fMRI signal (Fig. 1H, Fig.2). This result further supports the neuronal driven origin of the slow-frequency fMRI signal fluctuation in the cerebrovascular network detected by SSFP-fMRI.
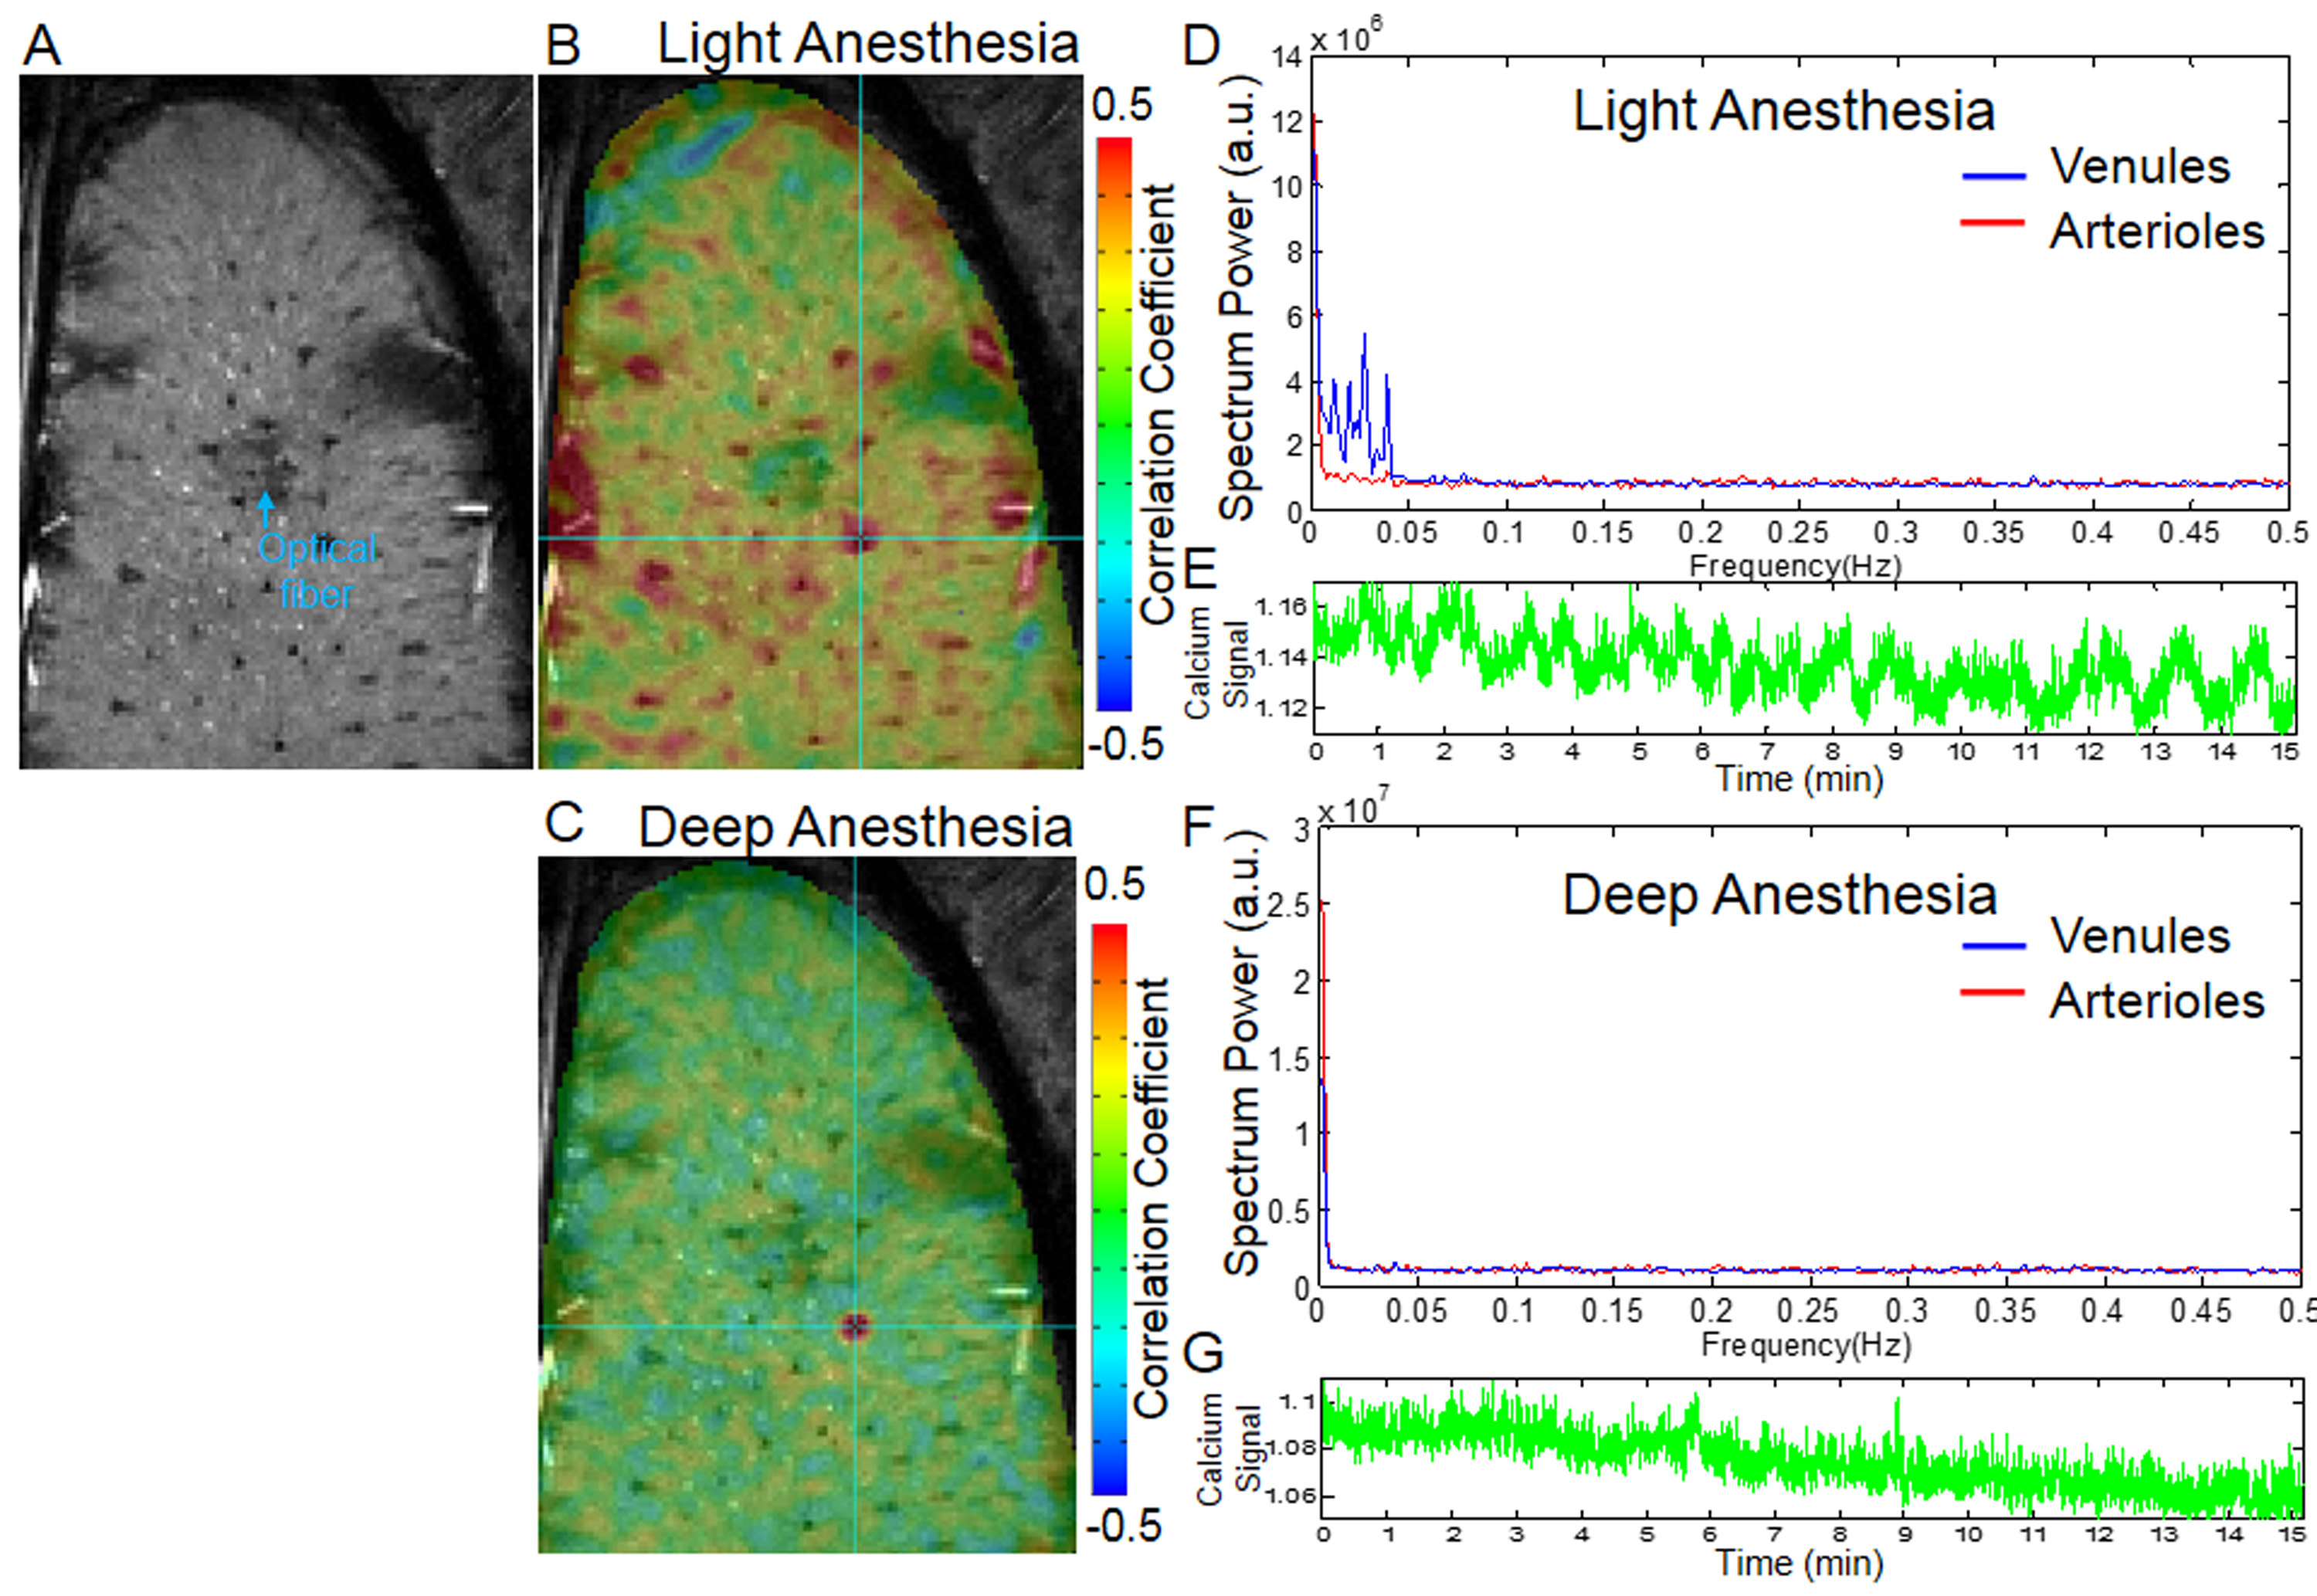
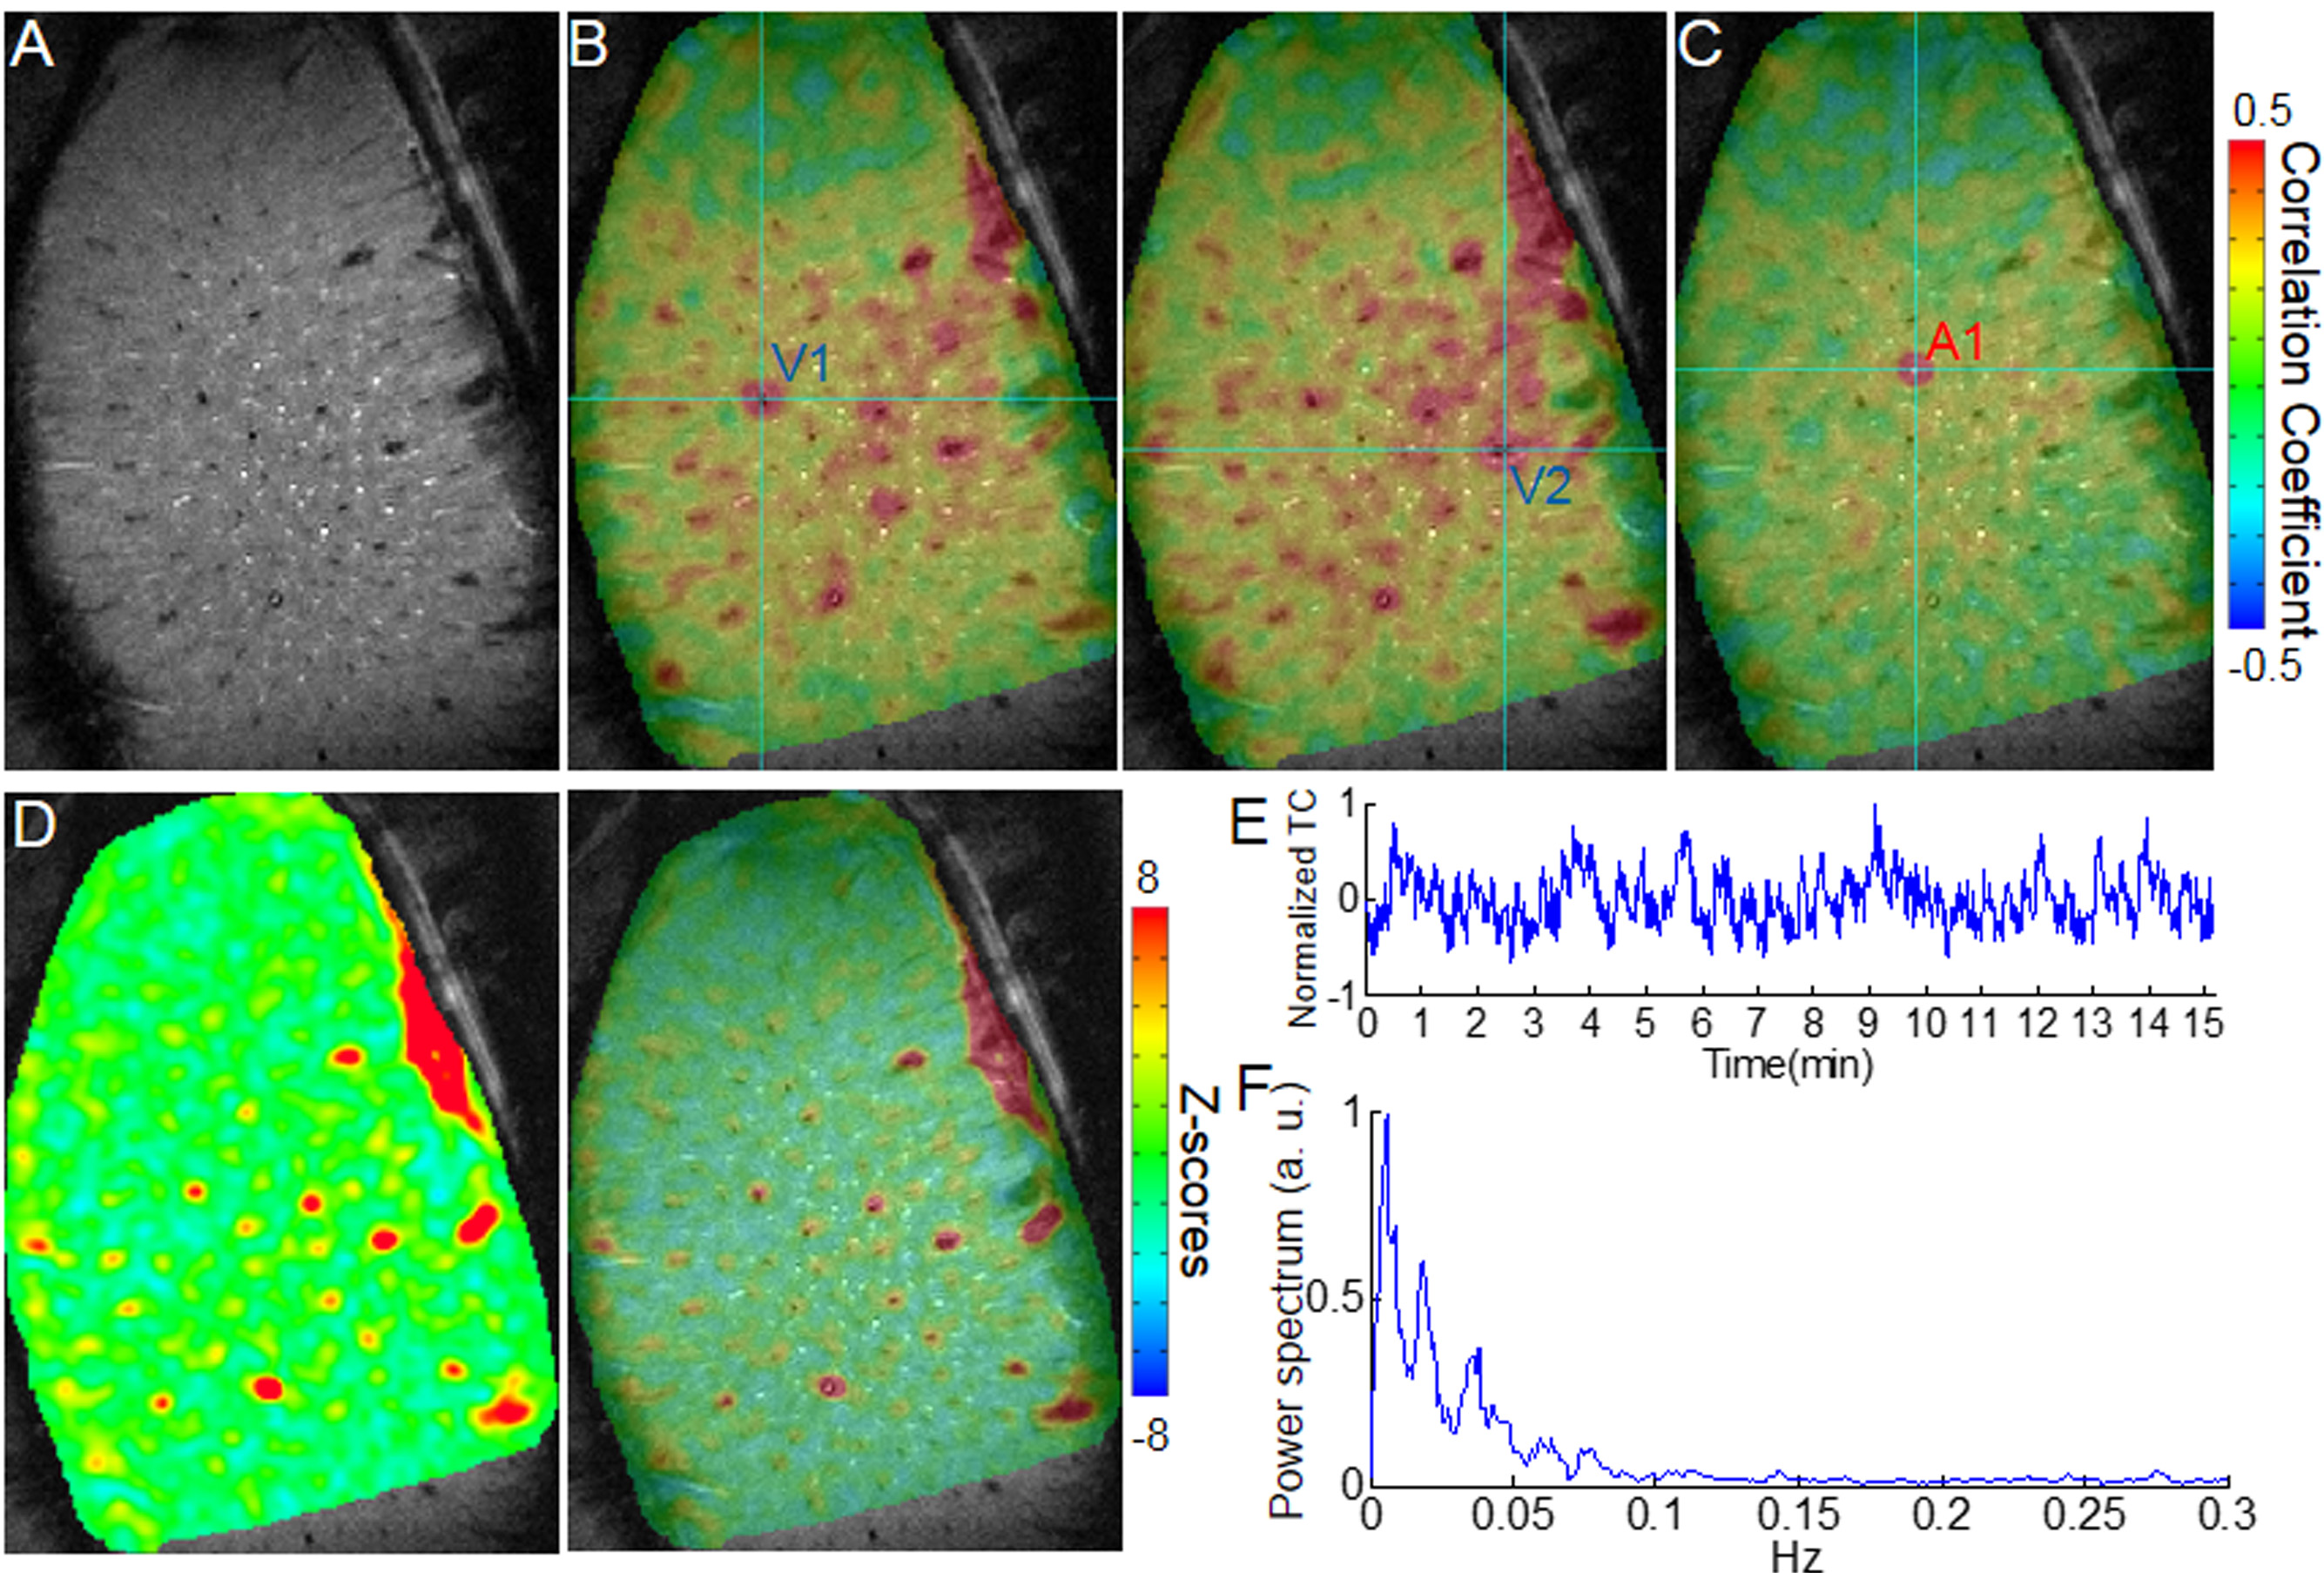
In addition, this slow-frequency oscillation of calcium signal, as well as vascular fMRI signal, could be dampened in rats under deep anesthesia (Fig. 3). At the light anesthesia level (<1.2% isoflurane), the slow-frequency oscillation could be detected from 0.01 to 0.1Hz (Fig. 4). This result suggests that the vascular dynamic connectivity is not drug-dependent, but its oscillation frequency range may vary depending on the anesthesia levels.
Conclusion
The vascular dynamic connectivity is not drug-dependent, but its oscillation frequency range may vary depending on the anesthesia levels. In addition, this vascular dynamic connectivity could share the similar neurovascular coupling source to the functional connectivity mapping, but represent the large-scale brain functional dynamics in the cerebrovascular network. Thus, the high-field fMRI pushes the spatial resolution to specify the vascular dynamic connectivity across the cerebrovasculature, demonstrating the hemodynamic state changes coupled to the brain state fluctuation.Acknowledgements
This research was
supported by the internal funding from Max Planck Society.
References
1. Du, C.W., Volkow, N.D., Koretsky, A.P., Pan, Y.. Low-frequency calcium oscillations accompany deoxyhemoglobin oscillations in rat somatosensory cortex. PNAS. 2014; 111, E4677-E4686.
2. Schulz, K., Sydekum, E., Krueppel, R., Engelbrecht, C.J., Schlegel, F., Schroter, A., Rudin, M., Helmchen, F.. Simultaneous BOLD fMRI and fiber-optic calcium recording in rat neocortex. Nat Methods. 2012; 9, 597-602.
3. Chen, T.W., Wardill, T.J., Sun, Y., Pulver, S.R., Renninger, S.L., Baohan, A., Schreiter, E.R., Kerr, R.A., Orger, M.B., Jayaraman, V., Looger, L.L., Svoboda, K., Kim, D.S.. Ultrasensitive fluorescent proteins for imaging neuronal activity. Nature. 2013; 499, 295-300.
Figures