5286
Organization and hierarchy of the human brain functional network at rest lead to a chain-like core.Tommaso Gili1,2, Rossana Mastrandrea3, Andrea Gabrielli4, Fabrizio Piras1,2, Gianfranco Spalletta2,5, and Guido Caldarelli3,4
1Enrico Fermi Center, Rome, Italy, 2Neuropsychiatry Laboratory, IRCCS Santa Lucia Foundation, Rome, Italy, 3Networks Unit, IMT School for Advanced Studies, Lucca, Italy, 4Institute for Complex Systems, CNR, Rome, Italy, 5Menninger Department of Psychiatry and Behavioral Sciences, Baylor College of Medicine, Houston, TX, United States
Synopsis
The intrinsic functional architecture of the brain and its alterations due to cognitive engagement, ageing and diseases are nodal topics in neuroscience, attracting considerable attention from many disciplines of scientific investigation. Complex network theory offers powerful tools to investigate brain connectivity disclosing the structure of the human brain functional network. Here we put forward a number of methods to investigate the network of brain areas coupled by their functional coordination without introducing exogenous thresholds. In this way we overcame the problem of having a fully connected network and found the intrinsic structure of the functional architecture of the brain.
Purpose
To investigate the scaffold of the resting brain functional connectivity by means of complex network theory,Methods
Forty healthy subjects (age(mean±sd)=(38±10); education(mean±sd)=(15±3); males/females=19/21) participated in this study. MR data acquisition MRI data were collected using gradient-echo echo-planar imaging at 3T (Philips Achieva) using a (T2*)-weighted imaging sequence sensitive to BOLD (TR/TE=3000/30 ms, voxel size=2x2x3mm, flip angle=90°, 50 slices, 240 vol). A high-resolution T1-weighted whole-brain structural scan was also acquired (1mm isotropic). Subjects were instructed to lay in the scanner at rest with eyes open. Cardiac and respiratory cycles were recorded using the scanner’s built-in photoplethysmograph and a pneumatic chest belt, respectively. FMRI preprocessing Physiological noise correction consisted of removal of time-locked cardiac and respiratory artefacts (two cardiac harmonics and two respiratory harmonics plus four interaction terms)1,2. Correction for head motion and slice-timing were performed using FSL. Head motion parameters were used to derive the frame-wise displacement (FD): time points with FD > 0.2 mm were replaced through a least-squares spectral decomposition3. Data were then demeaned, detrended and band-pass filtered (0.01-0.1Hz), using Matlab (The Mathworks). Finally data were spatially smoothed (5x5x5 mm FWHM). For each subject the brain was segmented into 116 macro-regions from the AAL template4, previously transformed from the MNI standard space to the functional space using ANTs. Resting state fMRI signals were averaged across each region to generate 116 time-series, which in turn were pairwise correlated and organized in a symmetric matrix. In order to create an average adjacency matrix at the population level, subject-wise matrices were Fisher-transformed, averaged across subjects and back-transformed5. Network Analysis Starting from the initial correlation matrix we kept only the maximum values along each row and sending all the rest to zero. This produced a Maximum Spanning Forest (MSF)6 of the initial correlation network and introduced a directionality, which simply revealed for each brain area its maximally correlated counterpart. The correlation values discarded during the construction of the MSF were ranked in increasing order and used to build a Maximum Spanning Tree (MST)6. Starting from the top of the list, a link between two nodes was drawn if they did not belong to the same group. The procedure ended when all the nodes were part of the same connected component. Null model We introduced a null-model for the human functional brain network to test the significance of our results. We kept unvaried the spectrum distribution of the observed correlation matrix and applied a series of rotations. We generated 100 randomizations of the observed correlation matrix and averaged over the ensemble. Both the randomized and the real matrix were point-wise squared in order to neglect signs but to keep the ranking of correlation values.Results
Fig.1A shows the abundance of modules with size 2 (bilateral areas or adjacent regions). Interestingly groups of size greater than 2 exhibits a chain-like structure. It implies that most of the nodes in the MSF have degree equal to one, few equal to 2 and very few greater than 2. Furthermore, nodes tend to connect with nodes belonging to the same anatomical region. The only exception is represented by ROIs belonging to the Temporal Lobe, which tends to link with all the other anatomical areas but the Cerebellum and the Deep Grey Matter ones. The null-model (Fig.1B) exhibited a star-like organization of components in the MSF. The MST in Fig.2A preserves the chain-like organization of nodes and mainly reproduces the anatomical division in regions. Some deviation form the chain emerged, revealing the centrality of certain nodes as the left Superior Temporal Lobe (AAL=82) and the left lobule 6 of cerebellum (AAL=99). In Fig.2B, The random MST confirmed the star-like organization.Discussion
The central result of this work is represented by the MSF of the ensemble of forty human brain functional networks. Keeping track only of the strongest connection for each ROI, for the first time, we showed that the network appears organized in components exhibiting a chain-like structure. A proper randomization of the real network produced hubs and star-like structures. The chain-like organization has been proved to characterize also the related MST, again with an evident difference with its randomized counterpart. Furthermore, the MST shows how cerebellar, occipital and frontal regions play a key role in the backbone of brain functional connectivity.Conclusion
We have put forward a number of methods to investigate the network of brain areas coupled by their functional resting activity. We have proved that the whole architecture of the brain activity at rest is characterized by an intrinsic chain-like structure of strongly coupled regions.Acknowledgements
No acknowledgement found.References
1) Glover GH, Li TQ & Ress D. Image-based method for retrospective correction of physiological motion effects in fMRI: RETROICOR. Magn. Reson. Med. 44, 162–7 (2000). 2) Chang C & Glover GH. Effects of model-based physiological noise correction on default mode network anti-correlations and correlations. Neuroimage 47, 1448–59 (2009). 3) Power et al. Methods to detect, characterize, and remove motion artifact in resting state fMRI. Neuroimage 84, 320-341 (2014). 4) Tzourio-Mazoyer N et al. Automated anatomical labeling of activations in SPM using a macroscopic anatomical parcellation of the MNI MRI single-subject brain. Neuroimage 15, 273-289 (2002). 5) Bardella G et al. Hierarchical organization of functional connectivity in the mouse brain: a complex network approach. Sci. Rep. 6, 32060 (2016). 6) Caldarelli G. Scale-Free Networks: Complex Webs in Nature and Technology (2010). Oxford University Press.Figures
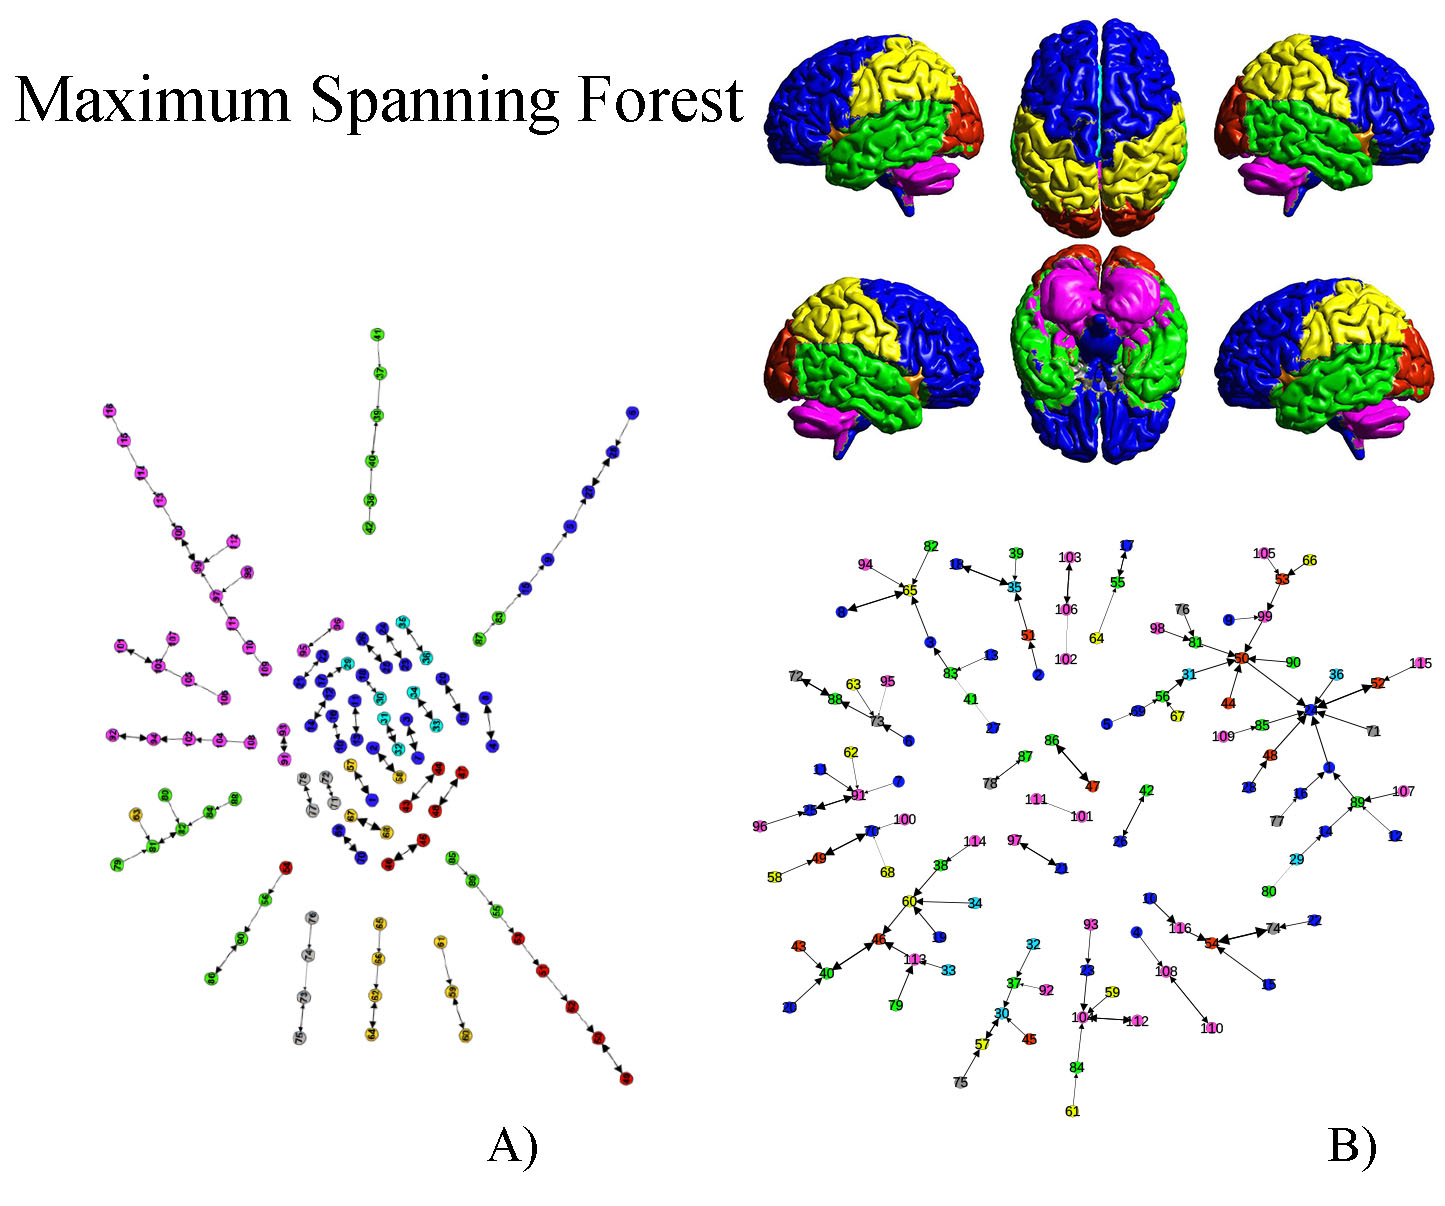
Fig1 A)Maximum Spanning Forest of the real brain
network; B)Maximum Spanning Forest of the ensemble of randomized networks.
Colors represent anatomical regions according to the AAL classification5:Blue, Frontal Lobe; Orange, Insula; Cyan, Cingulate; Green, Temporal Lobe;
Red, Occipital Lobe; Yellow, Parietal Lobe; Grey, Deep Grey Matter; Pink,
Cerebellum.
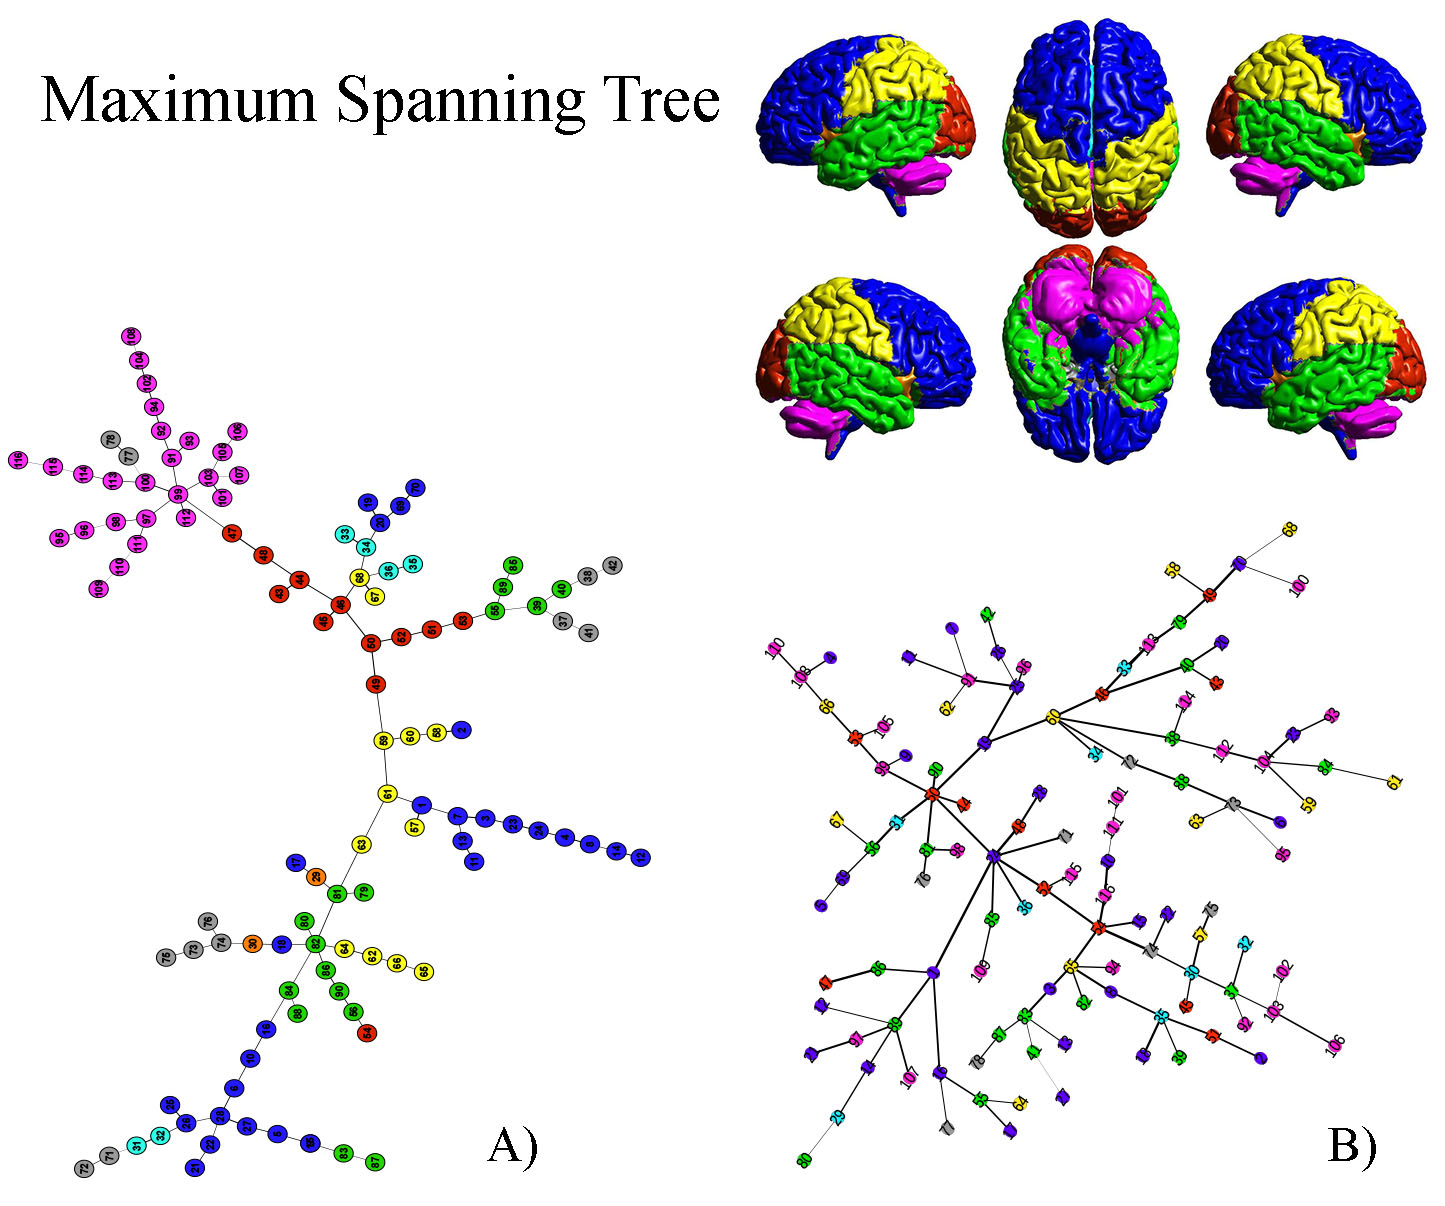
Fig2
A)Maximum Spanning Tree of the real brain network; B)Maximum Spanning Tree of
the ensemble of randomized networks. Colors represent anatomical regions
according to the AAL classification (see 1): Blue, Frontal Lobe; Orange,
Insula; Cyan, Cingulate; Green, Temporal Lobe; Red, Occipital Lobe; Yellow,
Parietal Lobe; Grey, Deep Grey Matter; Pink, Cerebellum.