5285
Sense of agency is a biological function sustained by a somatosensory-premotor networkTommaso Gili1,2, Valentina Ciullo2,3, Daniela Vecchio2,3, Gianfranco Spalletta2,4, and Federica Piras2
1Enrico Fermi Center, Rome, Italy, 2Neuropsychiatry Laboratory, IRCCS Santa Lucia Foundation, Rome, Italy, 3Psychology Department, Sapienza University, Rome, Italy, 4Menninger Department of Psychiatry and Behavioral Sciences, Baylor College of Medicine, Houston, TX, United States
Synopsis
Sense of agency (SoA) refers to the experience of controlling one’s own actions. Temporal distortions between the action and the effect mislead agency attribution. We investigated the covariance between the amount of functional interactions among brain regions at rest and SoA. We found that the functional network involved in self-agency attribution included the premotor and somatosensory cortices bilaterally, and the right superior parietal lobule. This provides the first evidence that functional connectivity at rest in healthy subjects varies along with experienced SoA, implying that self-agency is processed within an intrinsic brain functional module.
Purpose
To look at the relationship between brain network topology and the performance in a Judgment of Agency task in healthy subjects.Methods
Sixteen naïve healthy subjects (age(mean±sd)=(38±16); education(mean±sd)=(15±4); males/females=6/10) participated in this study. The behavioural tasks were administered off-resonance after the MRI acquisition. Behavioural Task Participants were required to fixate a white cross at the centre of a black screen and to press with their left hand the space bar once the fixation cross had disappeared. The key press action triggered the appearance of a blue ball at the centre of the screen. Subjects were told that the ball appearance would be either caused by their own action or controlled by the computer. The delay between the key press and the ball appearance was systematically varied using two different staircase procedures: a descending one (70 trails with a starting delay of 1620 ms) and an ascending one (70 trails with a starting delay of 90 ms). In both procedures the delay was increased by 90 ms when subjects reported they caused the effect, and decreased by 180 ms otherwise. On each trial, participants were required to judge who was the agent that caused the ball appearance. MR data acquisition MRI data were collected using gradient-echo echo-planar imaging at 3T (Philips Achieva) using a (T2*)-weighted imaging sequence sensitive to BOLD (TR/TE=3000/30 ms, voxel size=2x2x3mm, flip angle=90°, 50 slices, 240 vol). A high-resolution T1-weighted whole-brain structural scan was also acquired (1mm isotropic). Subjects were instructed to lay in the scanner at rest with eyes open. Cardiac and respiratory cycles were recorded using the scanner’s built-in photoplethysmograph and a pneumatic chest belt, respectively. FMRI preprocessing Physiological noise correction consisted of removal of time-locked cardiac and respiratory artefacts (two cardiac harmonics and two respiratory harmonics plus four interaction terms)1,2. Correction for head motion and slice-timing were performed using FSL. Head motion parameters were used to derive the frame-wise displacement (FD): time points with FD > 0.2 mm were replaced through a least-squares spectral decomposition3. Data were then demeaned, detrended and band-pass filtered (0.01-0.1 Hz), using Matlab (The Mathworks). For group analysis maps were transformed first linearly from functional space to structural space and then non-linearly to MNI standard space using Advanced Normalization Tools (ANTs). Finally data were spatially smoothed (5x5x5 mm FWHM). Behavioural Data analysis For each participant, the normalized number of trials across the sampled delays was fitted to a Gaussian function. The delay corresponding to the curve peak value was taken as the point of subjective equality (tPSE). Network analysis For each subject, the square value of the BOLD correlation matrix was calculated, a threshold was applied to ensure that the Erdos–Renyi entropy S was equal two and the eigenvector centrality (EC) was calculated4. EC maps were entered in a multiple regression design (performed using SPM8), which included one regressor of interest (tPSE) and three nuisance variables (gender, education and age). Results were considered statistically significant at p<0.001 voxel level uncorrected with a threshold on the cluster size k=400. The threshold chosen included two cluster level FWE corrections: p<0.1 (k=450) and p<0.05 (k=600).Results
At the group level we found tPSE(mean±sd)=(667±27)ms (Fig.1). Brain graphs were obtained from 40,000 voxels of the grey matter. Positive correlation between EC and tPSE was found in the primary somatosensory cortex bilaterally (BA3, [-45,-22, 54] and [48, -19, 56], p<0.05 FWE), the premotor cortex bilaterally (BA6, [-52, -1, 50] and [42, -15, 63], p<0.05 FWE) and the right superior parietal lobule (BA7, [18, -57, 69], p<0.1 FWE) (Fig.2).Discussion
We characterised the Sense of Agency (SoA) as a function of the delay between an action and its effect. We found that the functional network sustaining agency processing comprised the premotor and somatosensory cortices bilaterally, and the right superior parietal lobule. Such prefronto-parietal circuitry is densely connected and represents the pattern of a highly specialized network dedicated to the conscious experience of controlling external events. This findings support the comparator model account of SoA5, which suggests intensive crosstalk between motor and somatosensory areas, calling for a somatosensory-motor coding of sense of control6.Conclusion
Here we demonstrated for the first time, that functional connectivity at rest in healthy subjects is related to self-agency attribution when action feedback is temporally distorted. Such findings are most informative for the debate regarding the relative contribution of physiological/bottom-up and top-down processes in self-agency attribution. They also provide a conceptual framework for interpreting disorders of SoA in neuropsychiatric illnesses characterized by both disrupted somatosensory systems and aberrant resting state activity.Acknowledgements
No acknowledgement found.References
1) Glover GH, Li TQ & Ress D. Image-based method for retrospective correction of physiological motion effects in fMRI: RETROICOR. Magn. Reson. Med. 44, 162–7 (2000). 2) Chang C & Glover GH. Effects of model-based physiological noise correction on default mode network anti-correlations and correlations. Neuroimage 47, 1448–59 (2009). 3) Power et al. Methods to detect, characterize, and remove motion artifact in resting state fMRI. Neuroimage 84, 320-341 (2014). 4) Gili T. et al. The thalamus and brainstem act as key hubs in alterations of human brain network connectivity induced by mild propofol sedation. J. Neurosci. 33, 4024–31 (2013). 5) Blakemore SJ, Wolpert DM & Frith CD. Abnormalities in the awareness of action. Trends in Cognitive Sciences. 6, 237–242 (2002). 6) Cui F et al. Functional magnetic resonance imaging connectivity analyses reveal efference-copy to primary somatosensory area, BA2. PLoS One 9, (2014).Figures
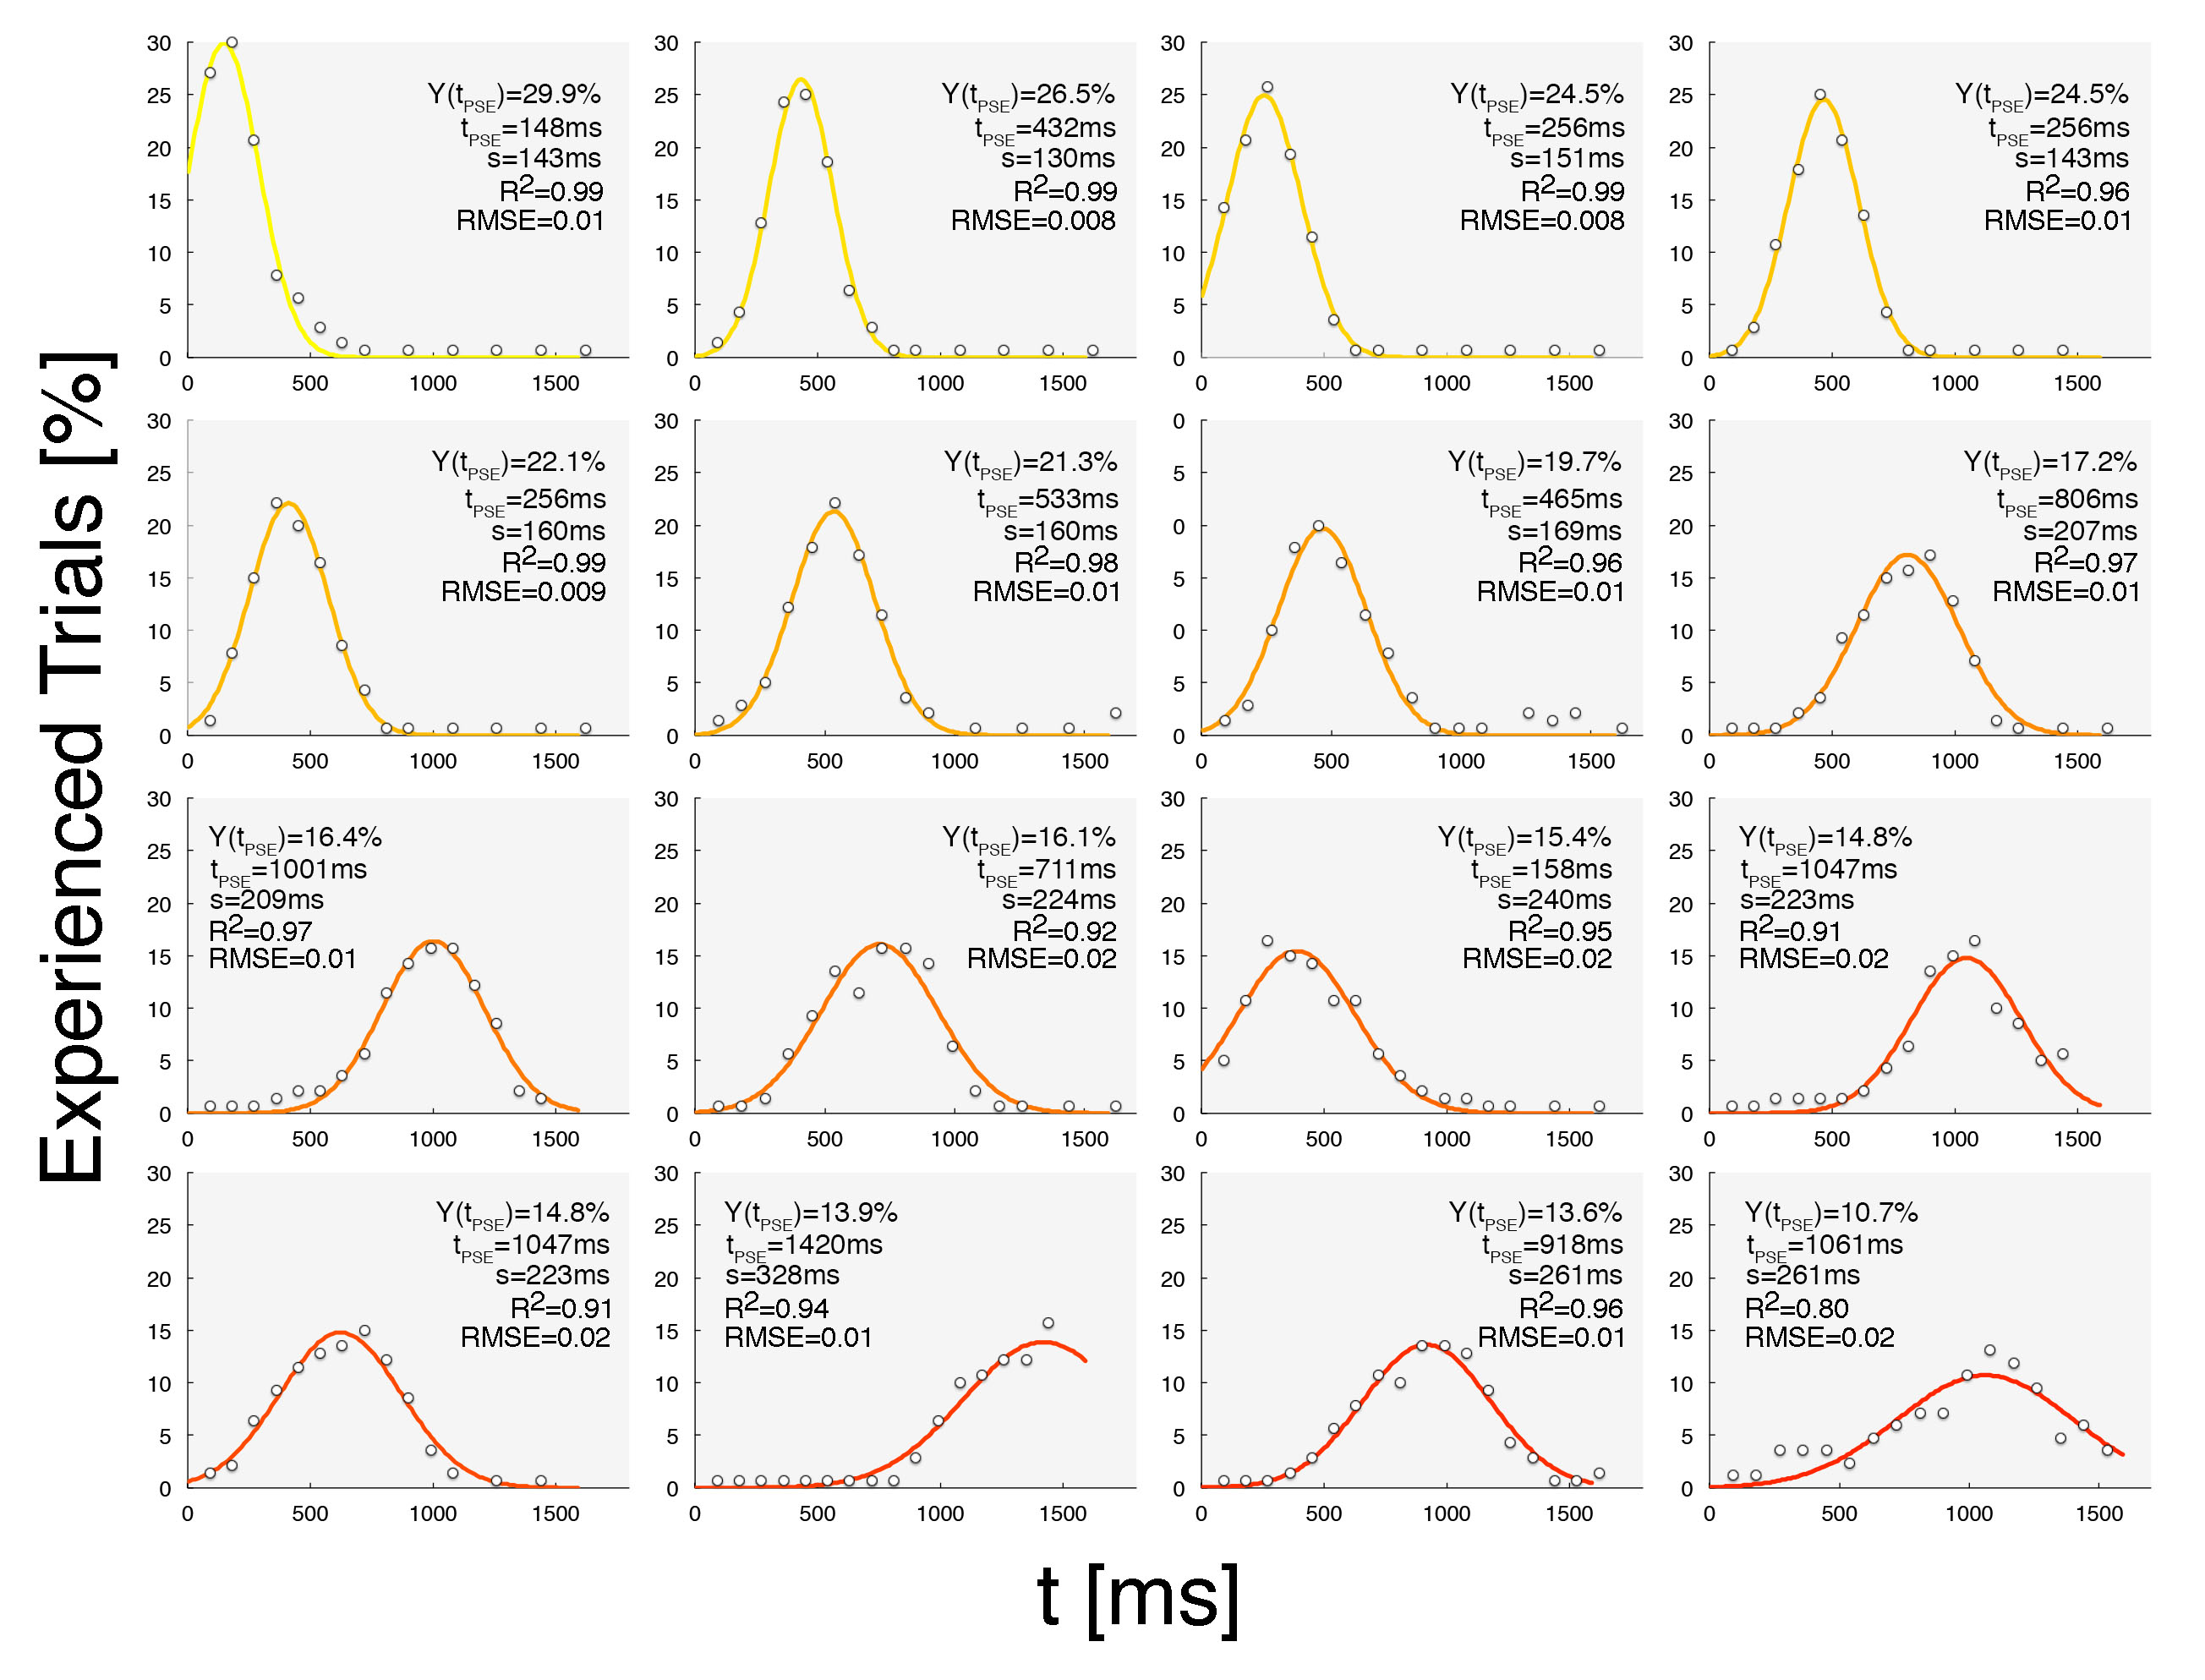
Fig.1
Behavioural data were fitted to a
Gaussian function y(t)=y(tPSE)*exp((t-tPSE)/(σ*21/2))2.
Results of the fitting procedures are reported together with the R2
and the RMSE. Curves color code refers to the extent of the SoA, from yellow
(narrow temporal grouping) to red (broad temporal grouping).
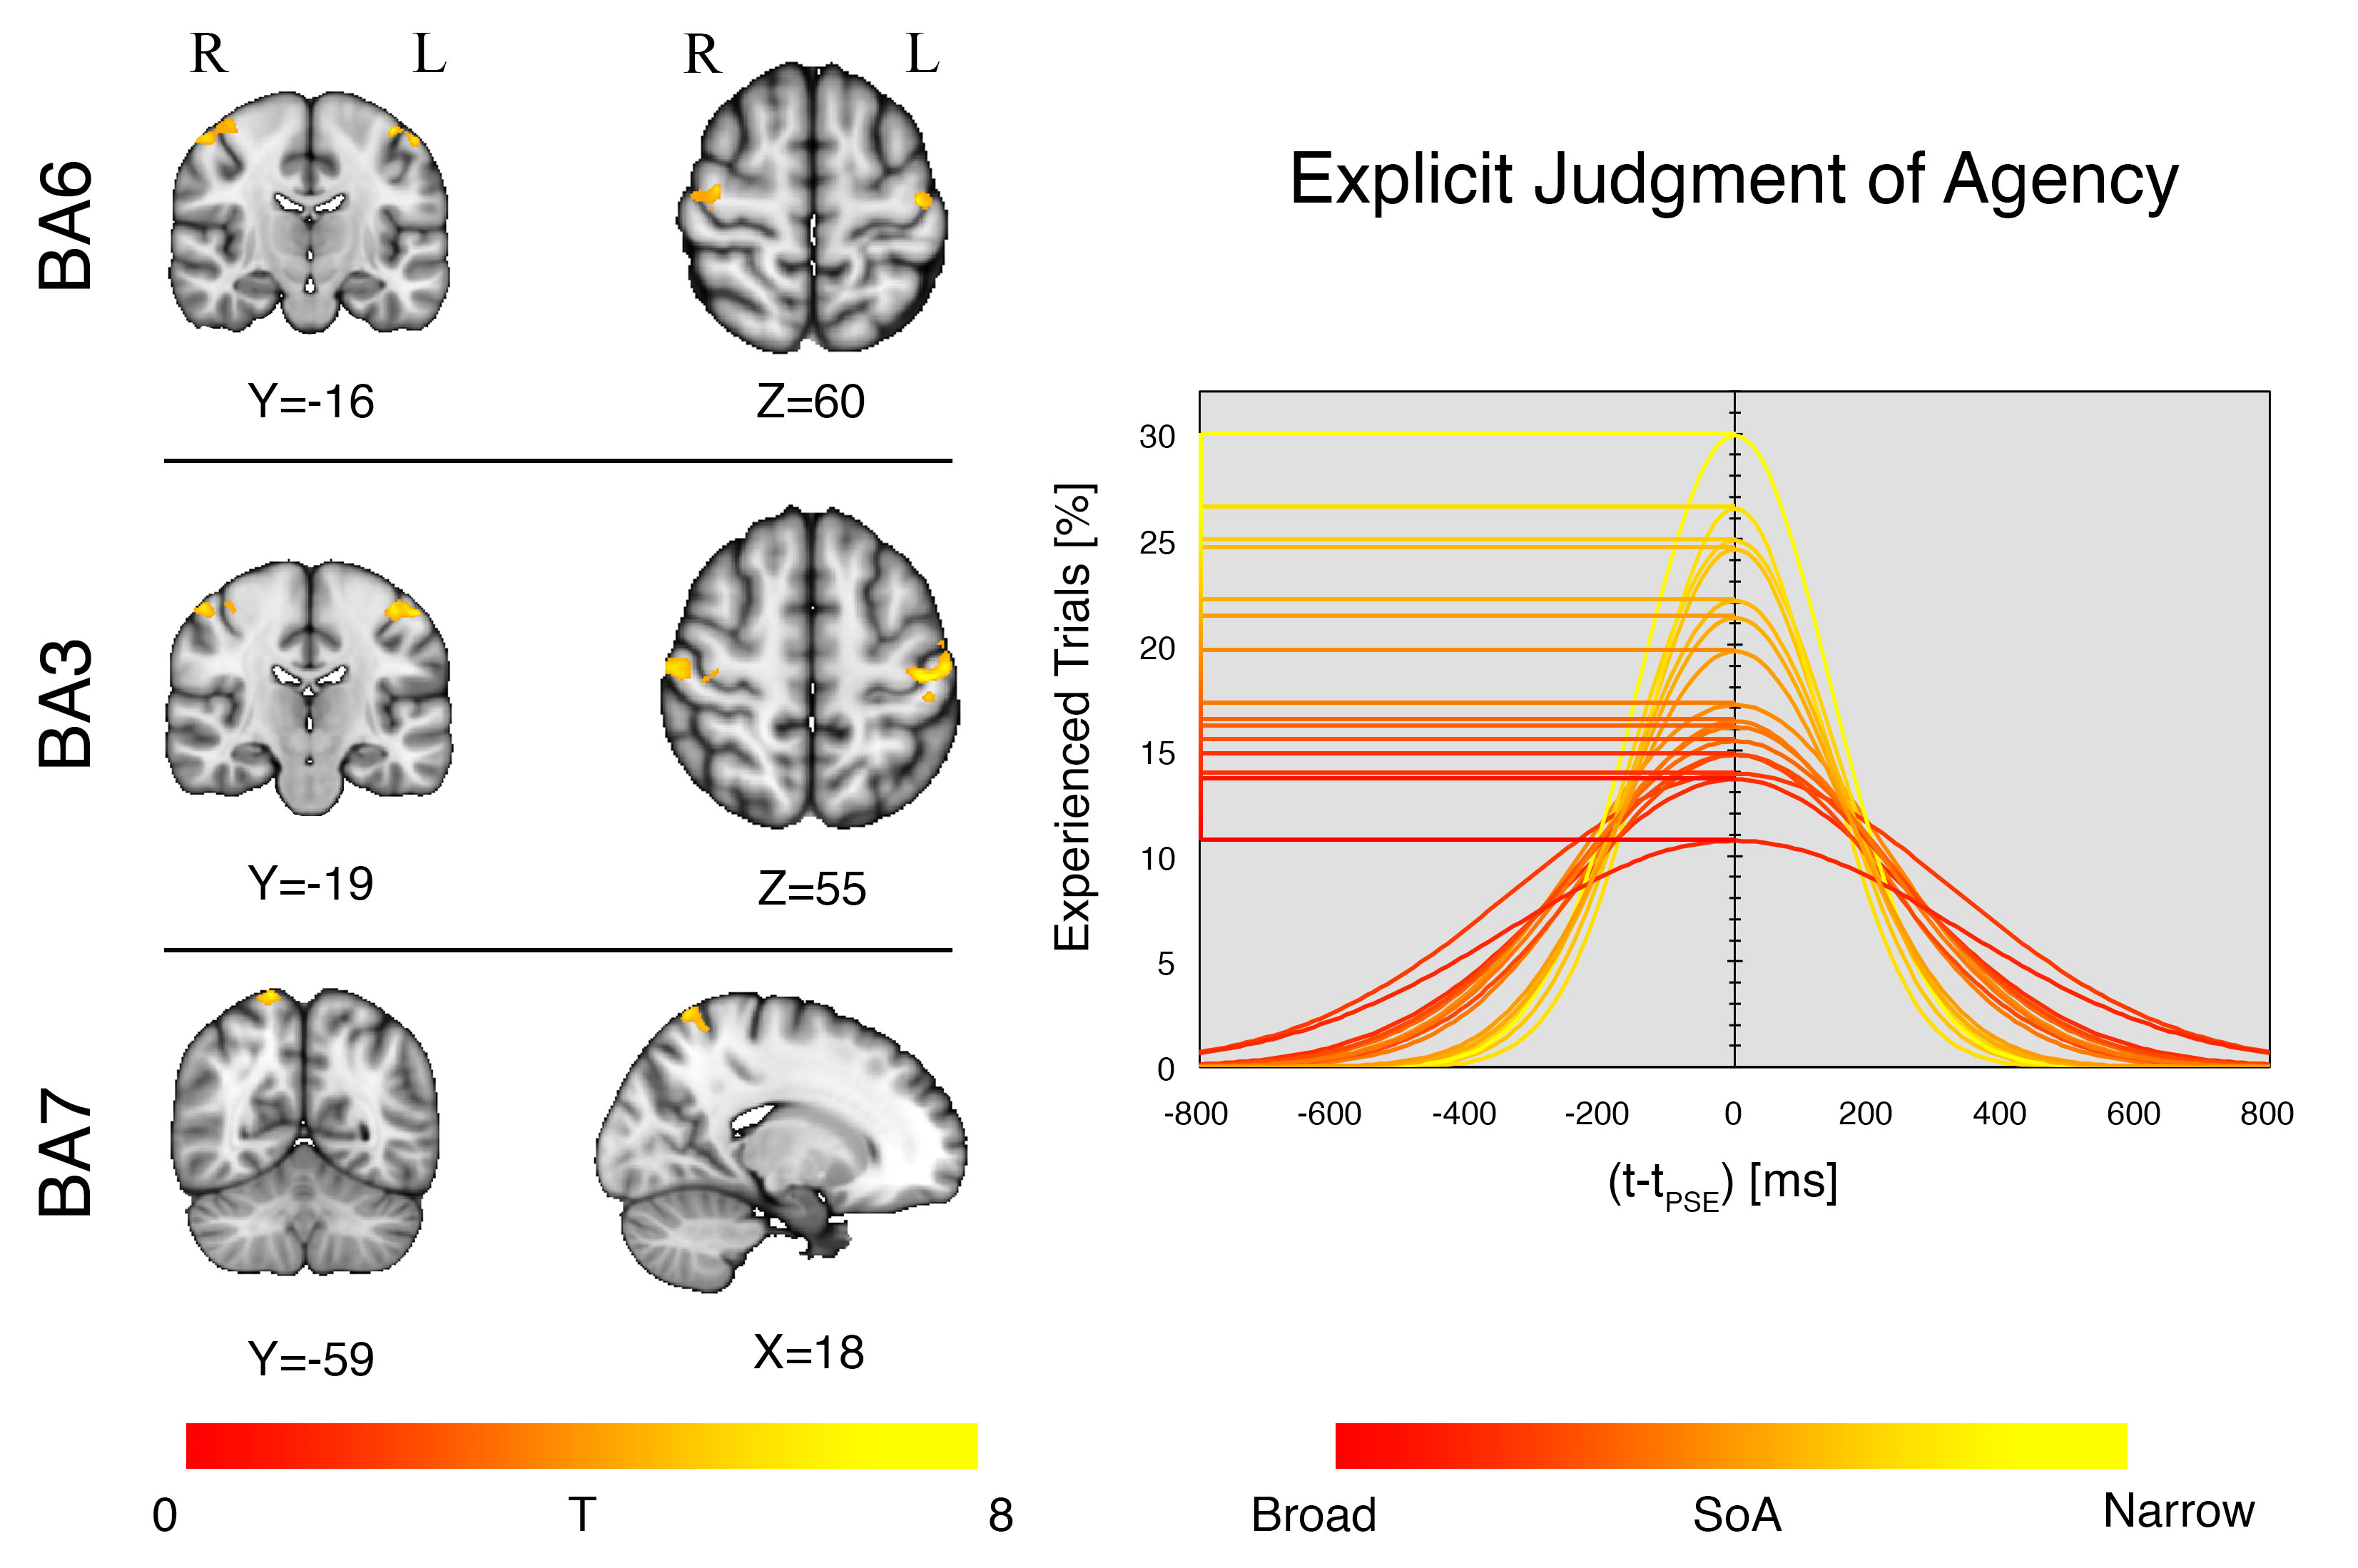
Fig.2
A regression analysis was
performed between EC maps and the tPSE. Covariance (p<0.001 voxel
level uncorrected) was observed in the primary somatosensory cortex (BA3,
bilaterally), the premotor cortex (BA6, bilaterally) and the right superior
parietal lobule (BA7). BA3 and BA6 were found significant at p<0.05FWE
cluster level corrected; BA7 was found significant at p<0.1FWE cluster
level corrected. Curves color code refers to the extent of SoA, from red (broad
temporal grouping) to yellow (narrow temporal grouping). Horizontal lines
highlight values assumed by the curves at the tPSE, leading to the
variable of interest used for the regression analysis.