5277
Is Iron Concentration Linked to Structural Connectivity in the Subthalamic Nucleus? Implications for Planning of Deep Brain Stimulation1Radiology, Icahn School of Medicine at Mount Sinai, New York, NY, United States, 2The City College of New York, New York, NY, United States, 3Weill Cornell Medical College, 4Psychiatry, Icahn School of Medicine at Mount Sinai, 5Neurosurgery, Icahn School of Medicine at Mount Sinai
Synopsis
The relationship between iron concentration, evaluated via quantitative susceptibility mapping (QSM) and white matter connectivity, assessed with 3T MRI, was explored. Such a relationship might be useful in deep brain stimulation (DBS) surgical planning, where both QSM and white matter connectivity are gaining interest. For several relevant regions of interest in movement disorders such as the superior frontal, pre central and post central gyrus there was a strong correlation between STN connectivity and QSM intensity. To allow quick assessment of the spatial variation of connectivity in the STN, an RGB image was computed from connectivity in 3 regions of interest.
Purpose
Deep brain stimulation (DBS) is used to treat a variety of neurological and psychiatric conditions. Previously, the potential impact of white matter tractography on pre-surgical planning in DBS has been demonstrated, but not widely adopted in clinical practice1. Current clinical planning of DBS is done using structural images, including quantitative susceptibility mapping (QSM), which is sensitive to iron content. Given success in targeting iron-rich structures such as the subthalamic nucleus (STN) and previous results indicating that white matter localization using tractography is useful in DBS planning2 and possibly predicting side-effects3, we hypothesize that there is a relationship between QSM intensities and white matter connectivity. To test this we compared connectivity profiles from fiber tractography and QSM intensities in several manually drawn ROIs in the STN in three subjects that were candidates for DBS.Methods
Subjects: Three patients with Parkinson’s Disease who were candidates for bilateral DBS of the STN were used for this study. Preoperative MRI: MRI performed prior to surgery included a T1-weighted anatomical scan, diffusion-weighted imaging (DWI) (2mm x 2mm x 2mm resolution, 60 directions and 5 b0 scans) and QSM. CT was performed preoperatively (0.5 x 0.5 x 1 mm resolution). Data Processing: Cortical and sub-cortical segmentation was performed from the T1-weighted image with Freesurfer (http://freesurfer.net/). Geometric distortions were removed from DWI images by estimating and correcting for susceptibility-induced magnetic fields. Fibre-tracking was performed using the MRtrix package4 (https://github.com/MRtrix3/mrtrix3). QSM and T1-weighted anatomical scans were be registered to post- operative CT. Fiber orientation distributions for tractography were approximated from diffusion-weighted data using spherical deconvolution. Tractography was performed using the iFOD2 algorithm implemented in MRtrix to obtain 100 million fibers seeded from the grey-white matter border. Connectivity matrices were computed for each voxel from the tractography seeded from that voxel and the Freesurfer parcellation. ROI: ROIs were drawn manually on the STN of each subject. The connectivity profiles and the total number of tracks connected to each ROI were computed by summing the columns of the connectivity matrices for each ROI. The connectivity profiles were plotted versus the mean QSM intensity in each ROI. To assess the spatial variation of connectivity in the STN, an RGB image was computed by coloring the connectivity profile of the superior frontal, precentral, and postcentral gyri, red, green, and blue respectively. These gyri were chosen based on their importance to DBS planning as deemed by a neurosurgeon.Results
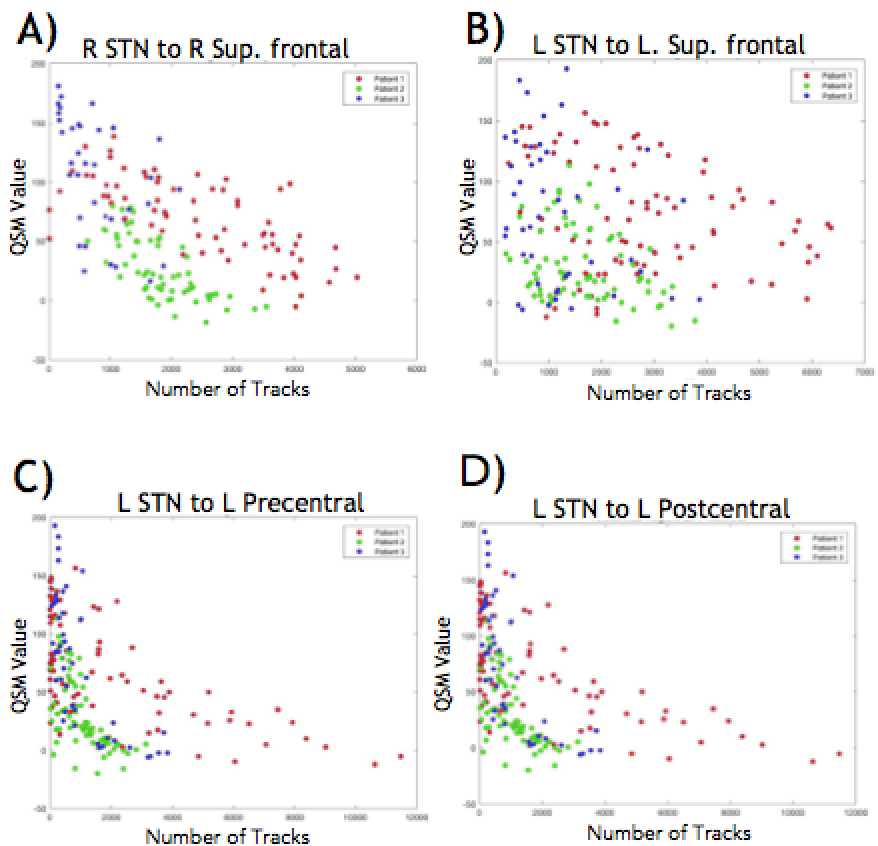
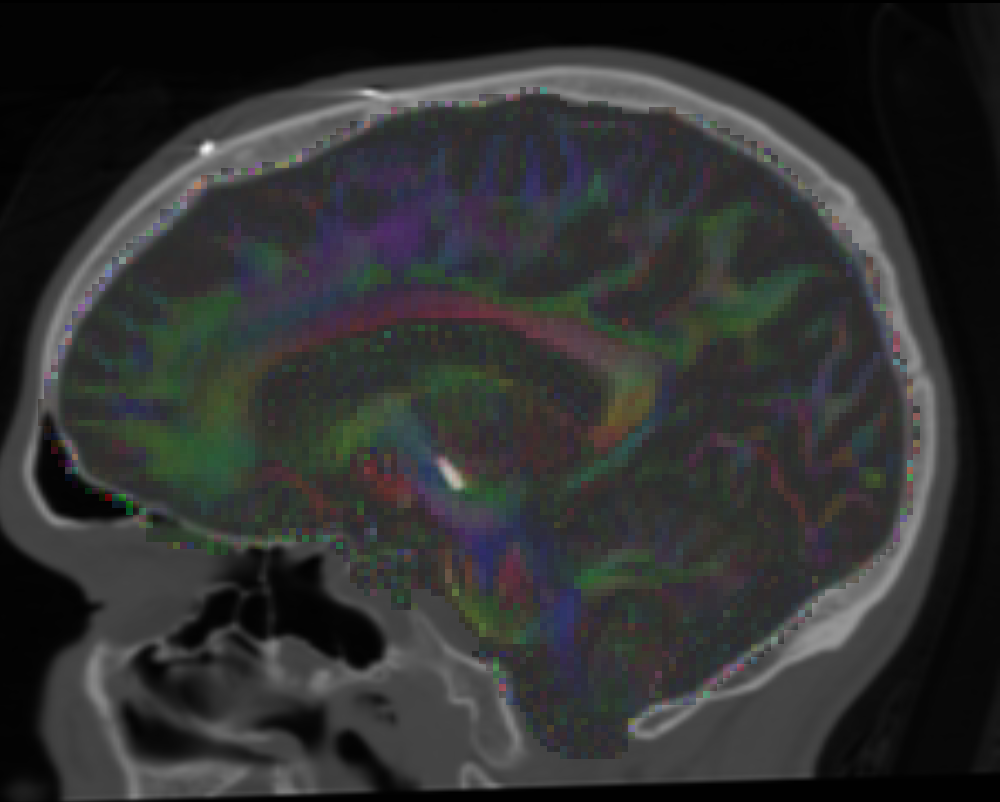
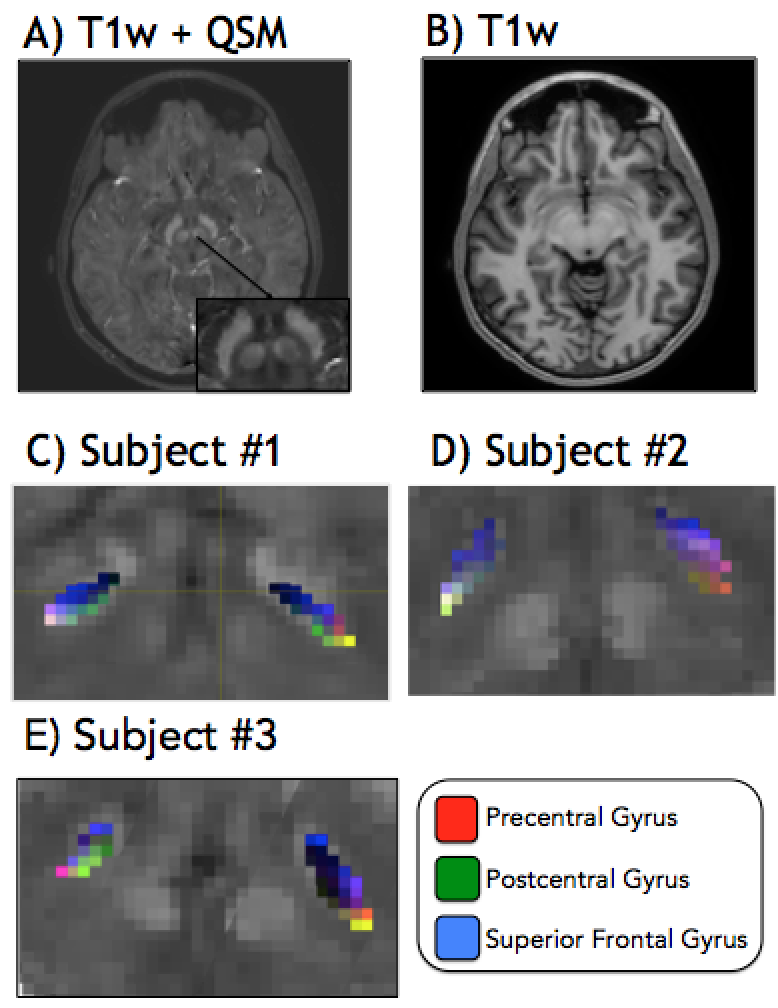
The three regions with STN connectivity most correlated to QSM value were the right superior frontal gyrus, left ventral dorsal column and right middle frontal gyrus with correlation coefficients of .23, .20, .26 and p-values < 10-8 uncorrected (~150 comparisons performed). Plots of connectivity versus QSM value are given in Figure 1 for some of the regions chosen a priori, showing similar trends for the 3 subjects. A tensor map of eigenvectors of the diffusion tensor overlaid over CT scans for one patient is shown in Figure 2. Images of registered structural scans are shown in Figure 3a-b. Axial slices of the RGB connectivity maps overlaid on QSM images are given in Figure 3c-e. The red green and blue channels represent connectivity with the superior frontal, pre- and post-central gyri respectively.Discussion
QSM values and connectivity were negatively correlated in regions where correlation was significant. This could indicate that lower QSM values are present in areas more connected to regions of interest - in other words regions with high density of axons of passage. However, there was a great amount of variability across subjects and brain regions. The RGB images show expected variations in connectivity, with post central connectivity medial posterior, pre central connectivity lateral posterior and superior frontal connectivity towards the anterior STN. Such a view may be useful in surgical planning to provide an individualized, concise and intuitive picture of connectivity. These 3 regions were chosen a priori, however other renderings, for example regions with highest correlation, might be more clinically useful. More work is needed to determine this.Conclusion
Strong negative correlations of connectivity to the QSM value were observed in several anatomical regions relevant to DBS. A simple map of connectivity of 3 priori regions - the superior frontal, pre- and post-central gyri - that captures regional variations in connectivity was presented. Such a mapping may be useful in surgical planning. If these patterns are consistent over many patients, they could be used to avoid/prevent cognitive/psychiatric side effects associated with DBS. Future will work will extend this to a larger sample as well as other DBS targets such as the globus pallidus and caudal zona incerta.Acknowledgements
This work is supported by seed funding from the Icahn School of Medicine at Mount Sinai.
References
1. Machado A, Rezai AR, Kopell BH, Gross RE, Sharan AD, and Benabid AL. Deep brain stimulation for Parkinson’ disease: surgical technique and perioperative management. Mov Disord. 2006; S14:S247-S258.
2. McIntyre CC, Grill WM, Sherman DL, and Thakor NV. Cellular effects of deep brain stimulation: model-based analysis of activation and inhibition. Journal of neurophysiology. 2004; 91(4):1457-1469.
3. RL O’Halloran, A Chartrain, J Rasouli, RA Ramdhani, BH Kopell. A Case Study of Image-Guided Deep Brain Stimulation: MRI-Based White Matter Tractography Shows Differences in Responders and Non-Responders. http://dx.doi.org/10.1016/j.wneu.2016.08.103 World Neurosurgery 2016
4. Tournier J, Calamante F, Connelly A et al. Mrtrix: diffusion tractography in crossing fiber regions. International Journal of Imaging Systems and Technology. 2012; 22:53–66.
Figures