5274
THE IMPACT OF THE LOCAL, MESOSCOPIC FREQUENCY DISTRIBUTION AND DIFFUSION IN GRAY AND WHITE MATTER TO THE STATIC bSSFP SIGNAL PROFILE1Department of High-Field Magnetic Resonance, Max Planck Institute for Biological Cybernetics, Tuebingen, Germany, 2Graduate Training Centre of Neuroscience, University of Tuebingen, Tuebingen, Germany, 3Department of Biomedical Magnetic Resonance, University of Tuebingen, Germany
Synopsis
The phase accumulation that spins experience during a MR sequence is closely linked to the microstructure within the voxel, and basically produces changes in T2* or T2. The present abstract demonstrates how the static bSSFP signal profile is modified by the influence of local susceptibility differences produce by the underlying local-frequency distribution and diffusion effects related to white matter and gray matter at 9.4T. We apply an analytical presentation of the diffusion-modified frequency distribution, previously only used for gradient and spin echoes, to bSSFP and we prove the applicability of this theory to bSSFP by Monte Carlo simulations and measurements.
PURPOSE
The present abstract demonstrates how the bSSFP signal profile is altered by the influence of the local-frequency distribution and diffusion effects in white matter (WM) and gray matter (GM) using an analytical description and numerical simulations. These predictions are confirmed by measurements of the amplitude-frequency profile of bSSFP at 9.4T and how this information can be used to obtain information of the underlying microstructure.INTRODUCTION
The frequency distribution within an imaging voxel is induced by the different susceptibility, size, shape, orientation and density of tissue components, exhibiting a unique local pattern. Examples are the neurovascular network in GM or nerve fibers/bundles in WM. In addition, water molecules are not static but diffuse freely/restricted within this local field pattern. In the most simple case these diffusion and frequency effect produce a reduction in T2* or T2. The phase evolution that spins experience over an experiment is closely related with the microstructure in a voxel1. The expected signal changes can be studied with analytical or numerical models.
Analytical and numerical approximations have been proposed to study the MR signal behavior for different sequences and applications2,3,7. There are several approaches to understand the influence of the frequency distribution within the voxel and how the MR signal is alterated. Simple models assume a Gaussian or non-or Lorentzian distribution4, however, do not reflect the real local frequency pattern in a voxel. Moreover, recent analytical solution of the Bloch-Torrey equation and Monte Carlo numerical models suggest that the frequency distribution can be studied by combining different parameters such as susceptibility differences and diffusion processes. Those models have been applied to GE and SE sequences5, however, the validity to apply these approaches to bSSFP has not been proven yet.
Recently, bSSFP at very high fields has been proposed as an alternative to GE approaches to capture BOLD-related signal changes6 due to its potential selectivity to small vessels. The neurovascular fingerprint of bSSFP can be analyzed by time consuming Monte Carlo simulations as demonstrated in several papers9,10. Here, we proposed to use the analytical approach of Ziener5 originally applied to GE and SE for bSSFP.
METHODS
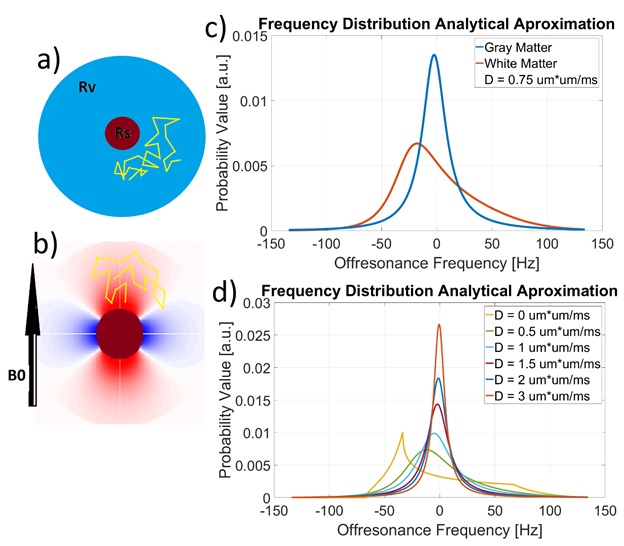
To tackle this problem, we used both the analytical models of Ziener5 and Monte Carlo simulations. Monte Carlo simulations: we created a spherical magnetic object (SMO) with a defined radius (Rs) immersed in a spherical voxel (Rv) (Figure 1.a and b). The SMO fills a certain volume fraction. Spin diffusion is simulated as random walks and transversal phase is acquired during the diffusion process2, 3X3Bloch rotation and relaxation matrices are applied to mimic the bSSFP sequence. Analytical calculations: Based on the Bloch-Torrey equation and the novel way to treat the Laplacian (diffusion term) of the equation as a stochastic process (Strong Collision Approximation5), is possible to calculate the frequency distribution of the spherical object as a function of the diffusion process.
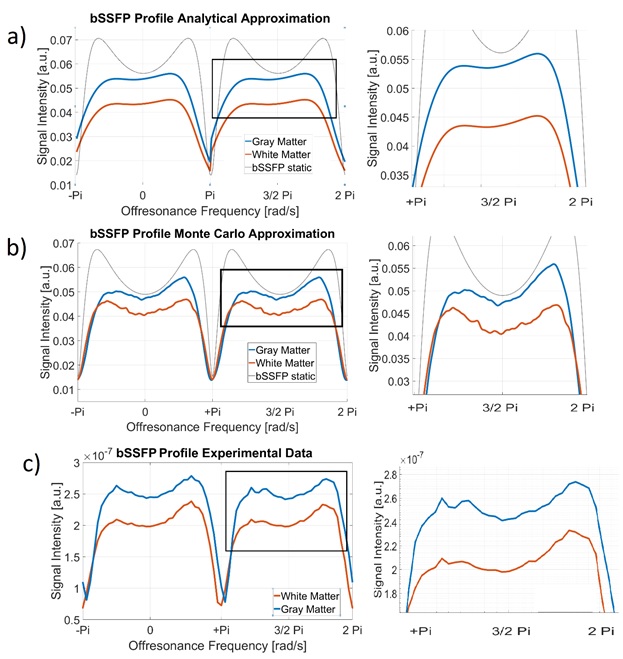
Based on the well-known static bSSFP profile that depends on the repetition time(TR), echo time(TE), flip angle(FA) and relaxation times, is possible to calculate modified bSSFP profile related to the local susceptibility differences and diffusion. The modified bSSFP can be obtained by the convolution of the local, diffusion-dependent frequency profile and the static bSSFP profile.
RESULTS
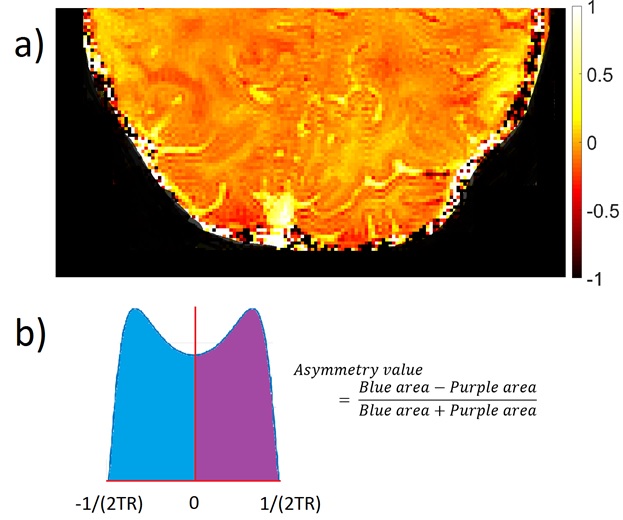
The strong collision approximation was implemented in Matlab. Fig1.c shows the local-frequency distribution calculated for WM and GM. Fig1.d shows changes of the frequency distribution with increasing diffusion coefficients for GM. The frequency distribution tends to be more centered at zero frequency and decreased width and asymmetry with increasing diffusion coefficients. Fig2.a and Fig2.b show the result of the convolution based on analytical and Monte Carlo methods with the static bSSFP profile(dashed line), respectively, and Fig2.c the experimental data. Fig3.a shows a calculated asymmetry brain map where it is possible to appreciate differences between WM and GM, and Fig3.b a schematic how this asymmetry map is calculated.DISCUSSION/ CONCLUSION
The frequency distribution shows a prominent asymmetry5,7,8 compared to the frequency distributions used before. The influence of the frequency distribution that modified the SSFP profile can be observed in both analytical and numerical methods and confirm by the experimental data.
Qualitatively is possible to compare the alternations in the SSFP profile. The asymmetry in the peaks is due to influence of the mixture in frequencies and can be explained by convolution properties. Both results show an asymmetry respect to the original SSFP profile. The diffusion-modified frequency distribution results are demonstrated with experimental data and comparable with Monte Carlo simulations. The strong collision approximation1,5 is straightforward to use to assess the influence on the SSFP profile and its relation with the microenvironment.
Acknowledgements
No acknowledgement found.References
1. Buschle, LR et al, Diffusion-mediated dephasing in the dipole field around a single spherical magnetic object, MRM (2015) 33(9):1126-45
2. Weisskoff et al, Microscopic Susceptibility Variation and Transverse Relaxation: Theory and Experiment, MRM (1994) 31:601-610
3. Frohlich et al, Theory of susceptibility-induced transverse relaxation in the capillary network in the diffusion narrowing regime, MRM (2005) 53:564-573
4. Miller, K. et al, Asymmetries of the balanced SSFP profile. Part II: white matter, MRM (2010) 63,396-406
5. Ziener, C. H. et al, W. R. Local frequency density of states around field inhomogeneities in magnetic resonance imaging: Effects of diffusion, Phys. Rev. E (2007)
6. Scheffler, K et al, High-resolution mapping of neuronal activation with balanced SSFP at 9.4 tesla, MRM (2015) 76, 163-171
7. Yablonskiy, DA et al, Theory of NMR signal behavior in magnetically inhomogeneous tissues: the static dephasing regime, MRM. (1994) 32,749-63.
8. Yu Chung, et al, An exact form for the magnetic field density of states for a dipole, MRM (2001) 19, 1017-1023
9. Bieri O et al, Effect of diffusion in inhomogeneous magnetic fields on balanced steady-state free precession, NMR Biomed. (2007) 20: 1–10.
10. Kim TS et al, Analysis of the BOLD Characteristics in Pass-Band bSSFP fMRI. Int J Imaging Syst Technol (2012) 22(1): 23–32.
Figures